| Param | Original file | Final file |
|---|---|---|
| Filename | modeM0/AS1A10_053T23_9000004404_30579cztM0_level2.evt | modeM0/AS1A10_053T23_9000004404_30579cztM0_level2_quad_clean.evt |
| Size (bytes) | 372,836,160 | 50,855,040 |
| Size | 355.6 MB | 48.5 MB |
| Events in quadrant A | 1,937,825 | 321,309 |
| Events in quadrant B | 3,290,478 | 317,198 |
| Events in quadrant C | 2,002,707 | 305,444 |
| Events in quadrant D | 3,778,871 | 304,147 |
| Mode SS | |||
|---|---|---|---|
| Quadrant | BADHDUFLAG | Total packets | Discarded packets |
| A | 0 | 84 | 0 |
| B | 0 | 84 | 0 |
| C | 0 | 84 | 0 |
| D | 0 | 84 | 0 |
| Mode M0 | |||
|---|---|---|---|
| Quadrant | BADHDUFLAG | Total packets | Discarded packets |
| A | 0 | 8520 | 2 |
| B | 0 | 12903 | 2 |
| C | 0 | 8564 | 2 |
| D | 0 | 13979 | 2 |
| Quadrant | Total seconds | Saturated seconds | Saturation percentage |
|---|---|---|---|
| A | 4131 | 83 | 2.009199% |
| B | 4132 | 168 | 4.065828% |
| C | 4132 | 115 | 2.783156% |
| D | 4132 | 583 | 14.109390% |
Noise dominated data is calculated using 1-second bins in cleaned event files. If a bin has >2000 counts, and if more than 50% of those come from <1% of pixels, then it is considered to be noise-dominated and hence unusable.
| Quadrant | # 1 sec bins | Bins with >0 counts | Bins with >2000 counts | High rate bins dominated by noise | Noise dominated (total time) | Noise dominated (detector-on time) | Marked lightcurve |
|---|---|---|---|---|---|---|---|
| A | 4181 | 4132 | 0 | 0 | 0.00% | 0.00% | 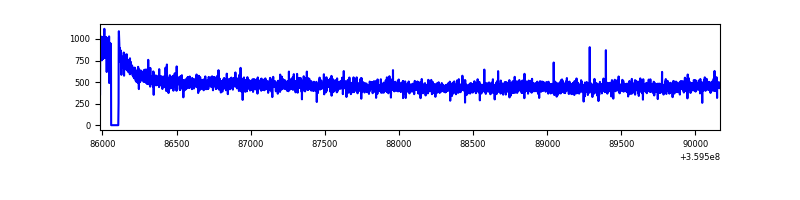 |
| B | 4182 | 4133 | 11 | 11 | 0.26% | 0.27% | 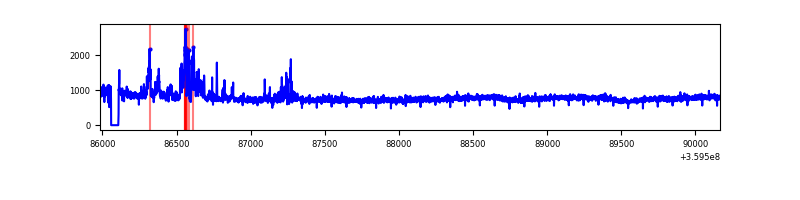 |
| C | 4182 | 4133 | 1 | 1 | 0.02% | 0.02% | 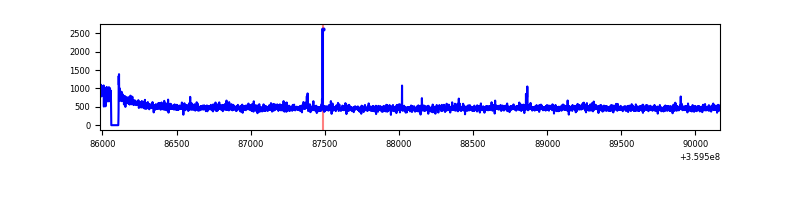 |
| D | 4182 | 4133 | 552 | 552 | 13.20% | 13.36% | 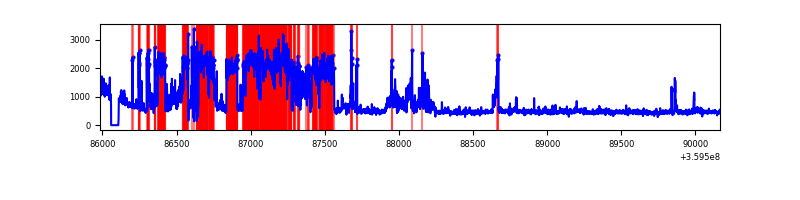 |
Top three noisy pixels from each quadrant. If the there are fewer than three noisy pixels in the level2.evt file, extra rows are filled as -1
| Pixel properties | Quadrant properties | ||||||
|---|---|---|---|---|---|---|---|
| Quadrant | DetID | PixID | Counts | Sigma | Mean | Median | Sigma |
| A | 13 | 254 | 7659 | 69.54 | 501 | 491 | 103.1 |
| A | 3 | 137 | 5110 | 44.81 | 501 | 491 | 103.1 |
| A | 0 | 226 | 4201 | 35.99 | 501 | 491 | 103.1 |
| B | 6 | 159 | 1174779 | 12044.03 | 492 | 478 | 97.5 |
| B | 6 | 36 | 185919 | 1901.95 | 492 | 478 | 97.5 |
| B | 12 | 111 | 11997 | 118.14 | 492 | 478 | 97.5 |
| C | 14 | 238 | 77780 | 682.55 | 480 | 482 | 113.2 |
| C | 3 | 233 | 20067 | 172.94 | 480 | 482 | 113.2 |
| C | 10 | 22 | 10241 | 86.17 | 480 | 482 | 113.2 |
| D | 1 | 52 | 1531719 | 13316.06 | 473 | 458 | 115.0 |
| D | 13 | 104 | 188417 | 1634.52 | 473 | 458 | 115.0 |
| D | 8 | 195 | 118332 | 1025.05 | 473 | 458 | 115.0 |
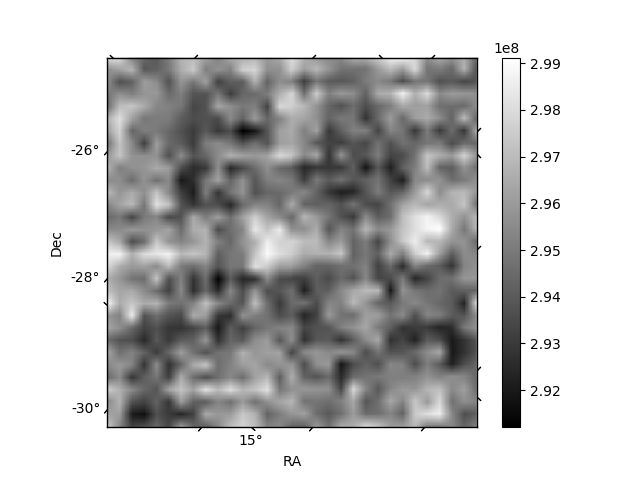
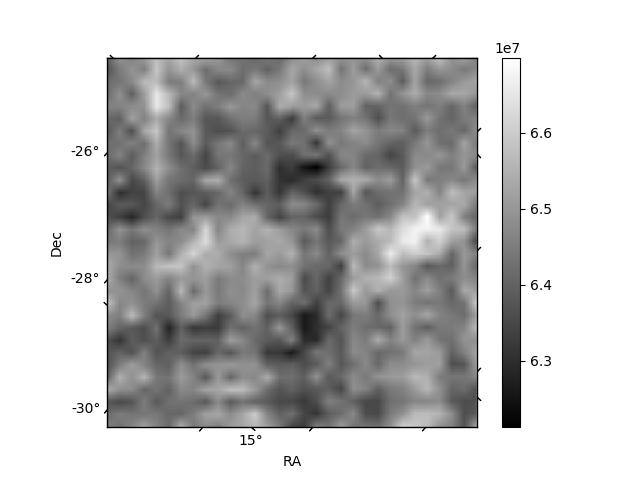
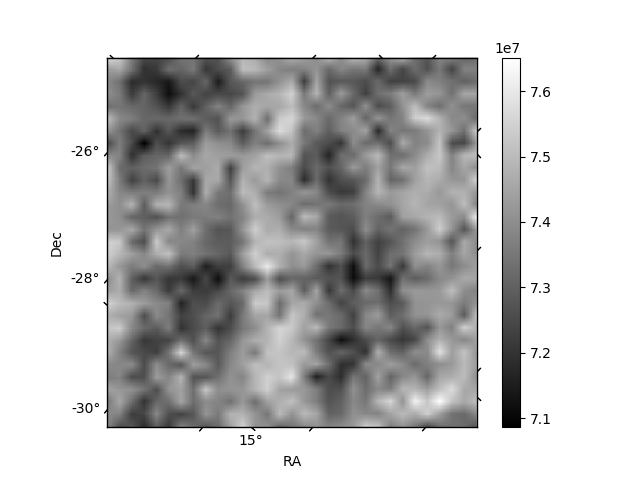
Histogram calculated using DETX and DETY for each event in the final _common_clean file
| Quadrant A | 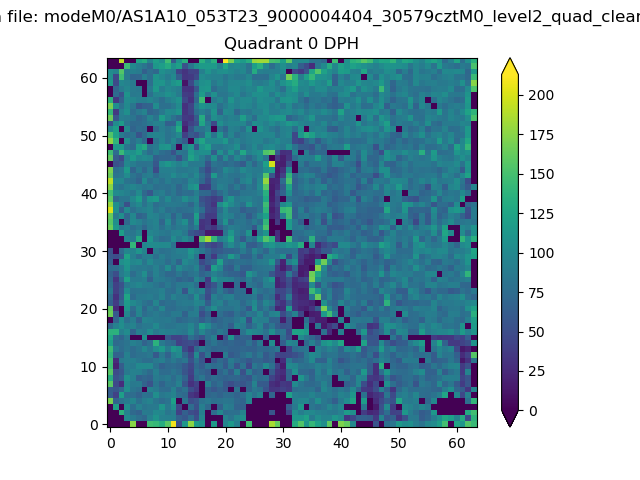 |
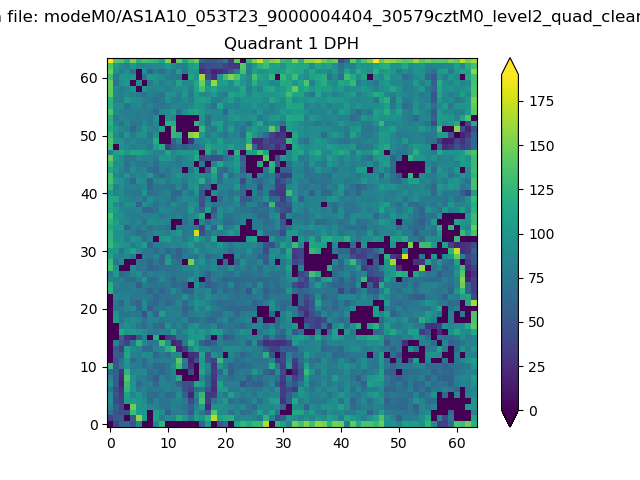 |
Quadrant B |
|---|---|---|---|
| Quadrant D | 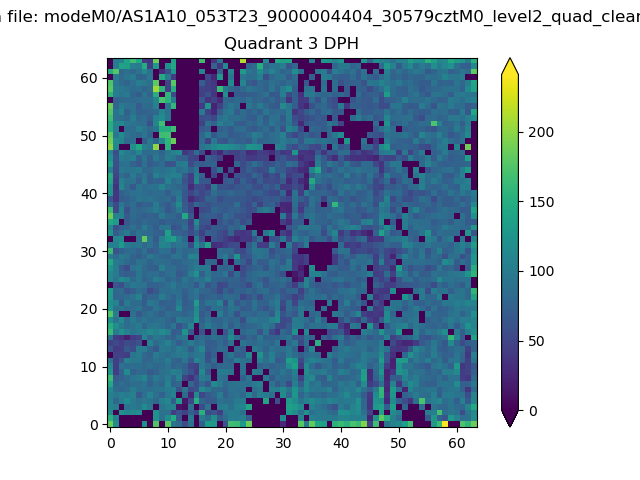 |
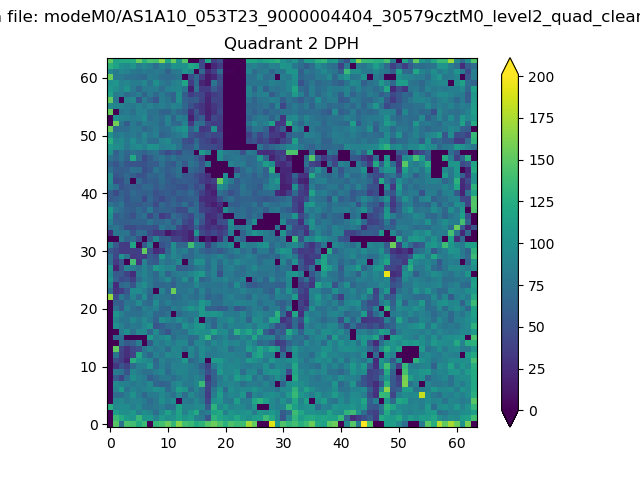 |
Quadrant C |
| Plot type | Count rate plots | Images |
|---|---|---|
| Comparison with Poisson distribution Blue bars denote a histogram of data divided into 1 sec bins. Red curve is a Poisson curve with rate = median count rate of data. |
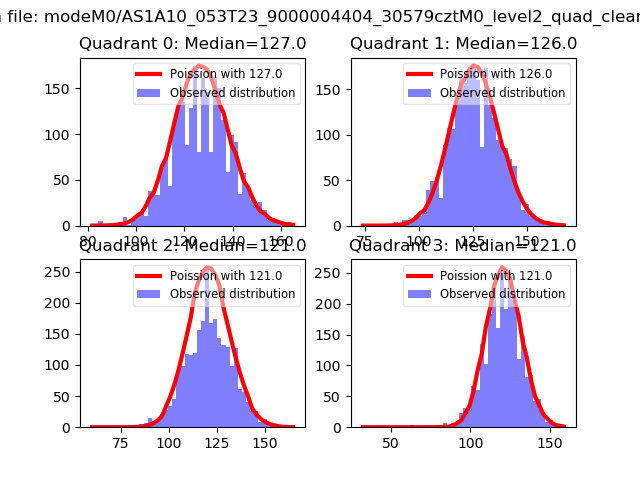 |
 |
| Quadrant-wise count rates Data is divided into 100 sec bins |
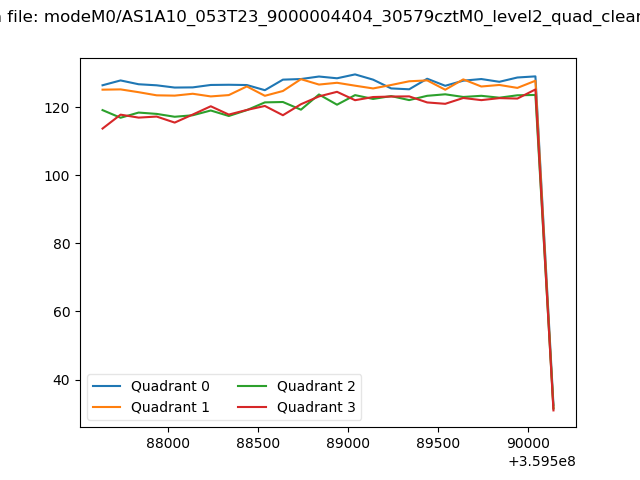 |
|
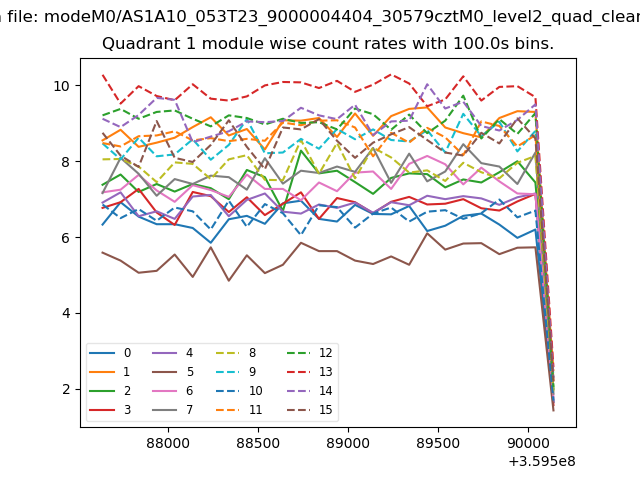
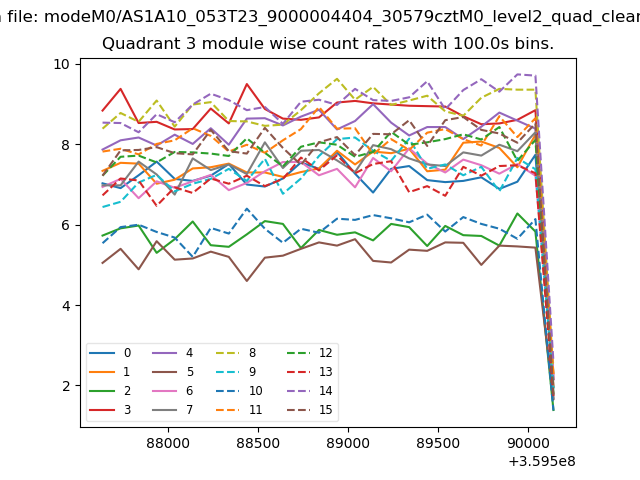
| Module-wise count rates for Quadrant A Data is divided into 100 sec bins |
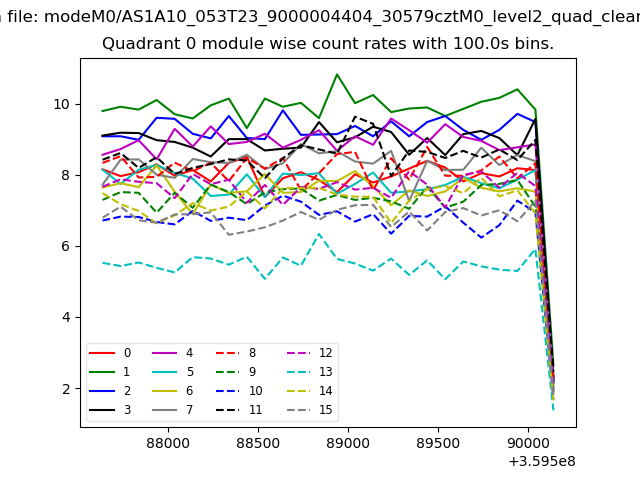 |
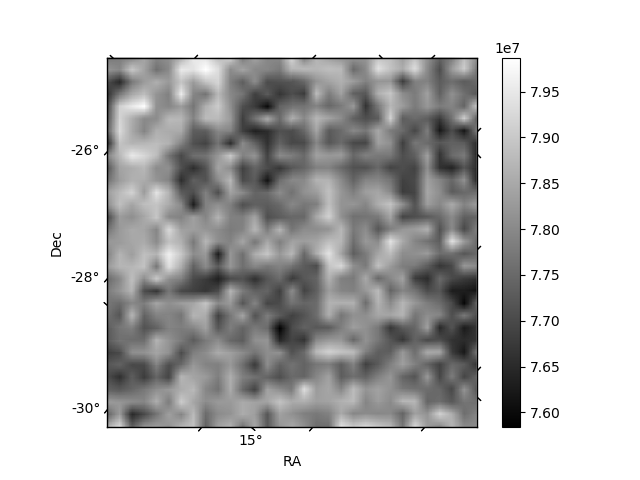 |
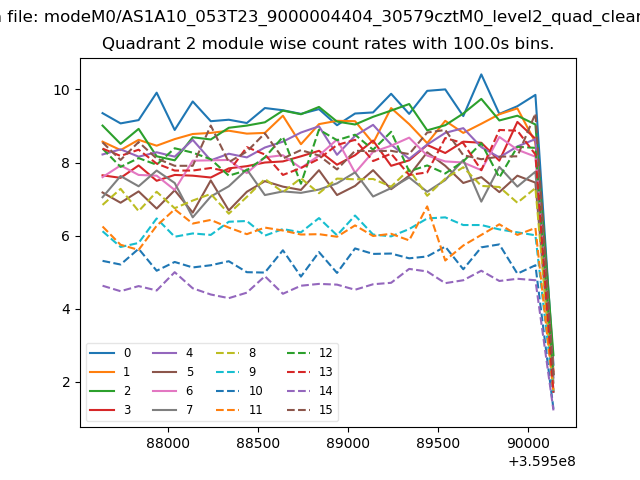
| Module-wise count rates for Quadrant B Data is divided into 100 sec bins |
 |
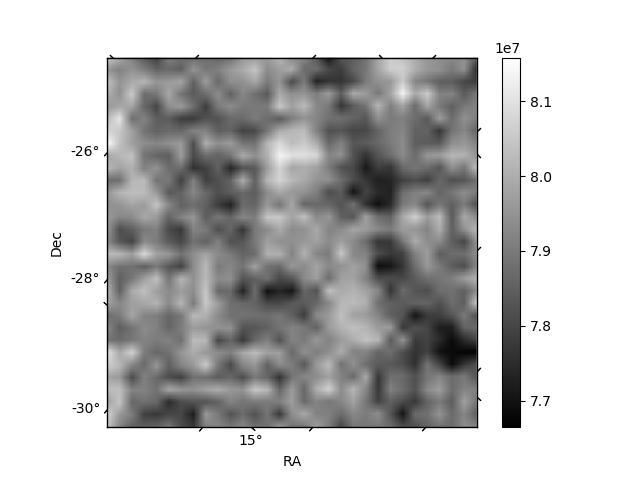 |
| Module-wise count rates for Quadrant C Data is divided into 100 sec bins |
 |
 |
| Module-wise count rates for Quadrant D Data is divided into 100 sec bins |
 |
 |
| Parameter | Plot |
|---|---|
| CZT HV Monitor | 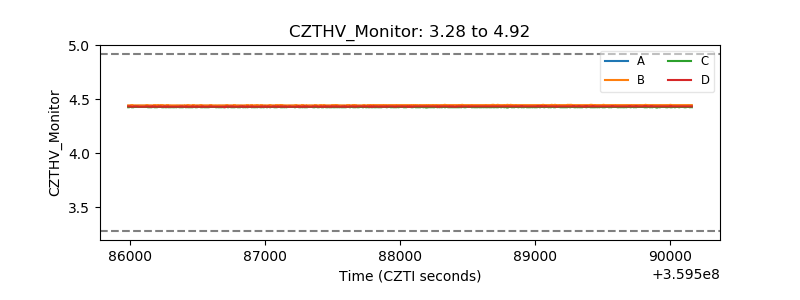 |
| D_VDD | 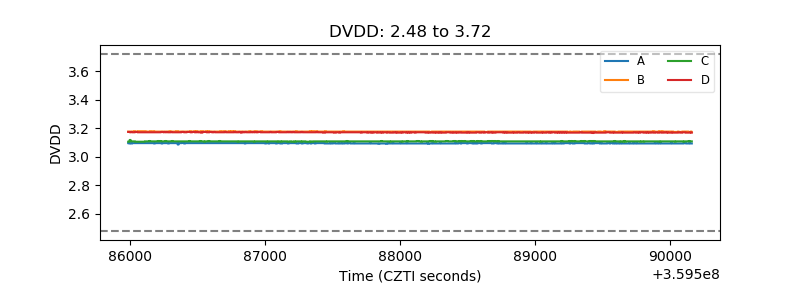 |
| Temperature 1 | 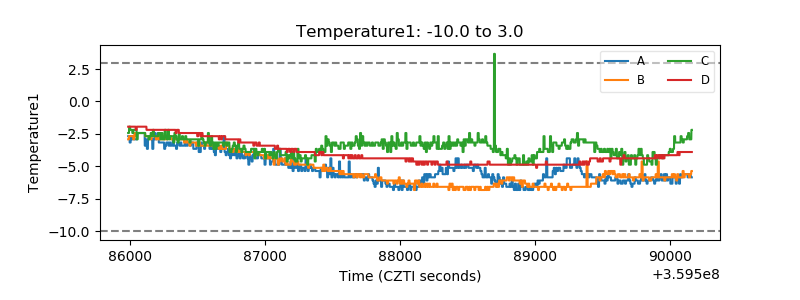 |
| Veto HV Monitor | 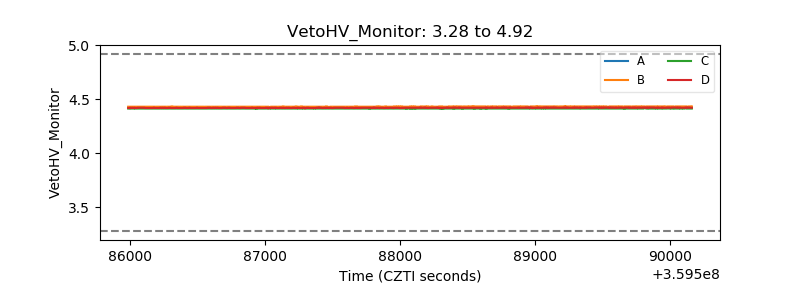 |
| Veto LLD | 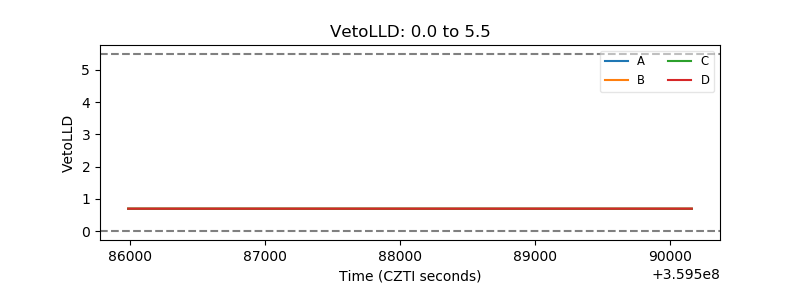 |
| Alpha Counter | 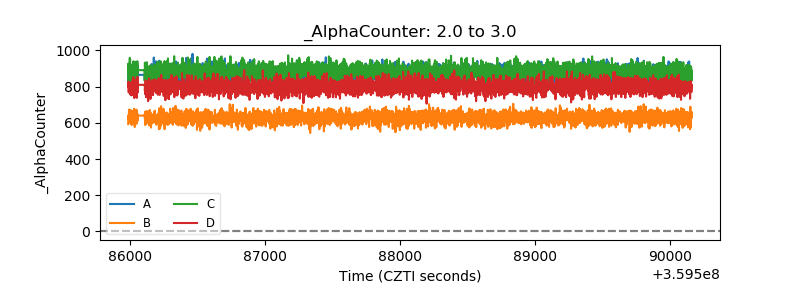 |
| _CPM_Rate | 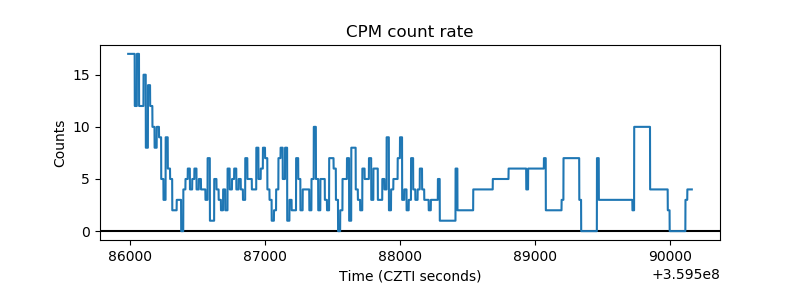 |
| CZT Counter | 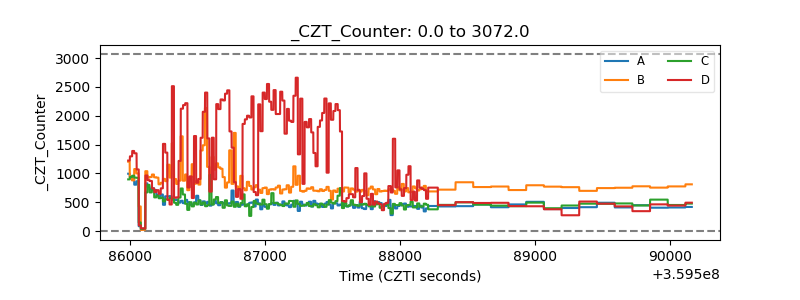 |
| +2.5 Volts monitor |  |
| +5 Volts monitor |  |
| _ROLL_ROT | 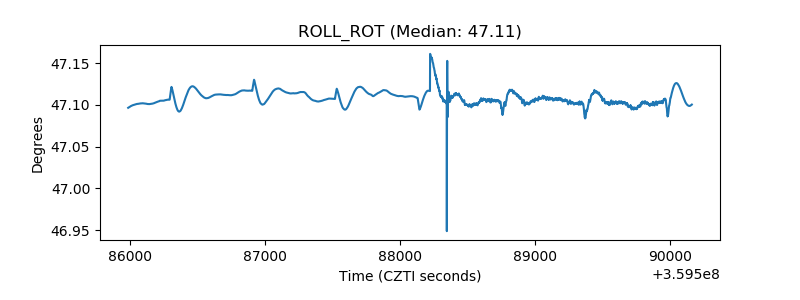 |
| _Roll_DEC | 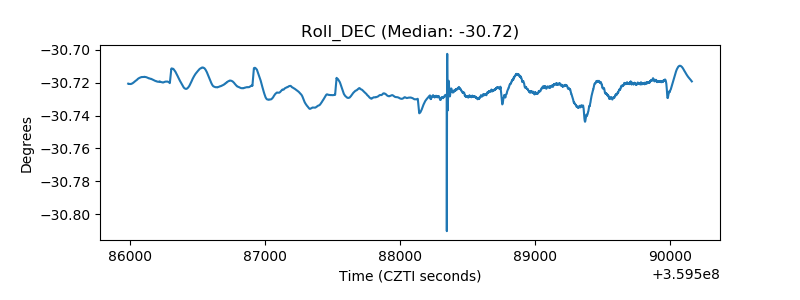 |
| _Roll_RA | 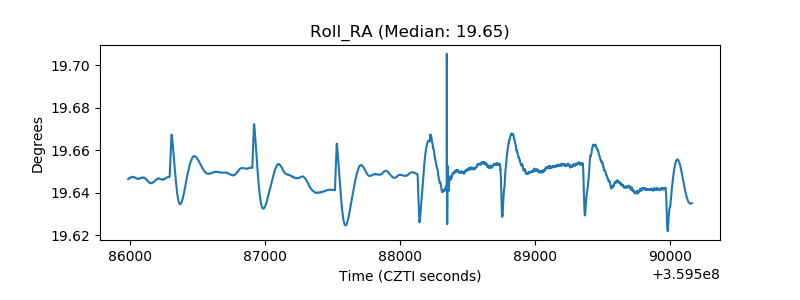 |
| Veto Counter | 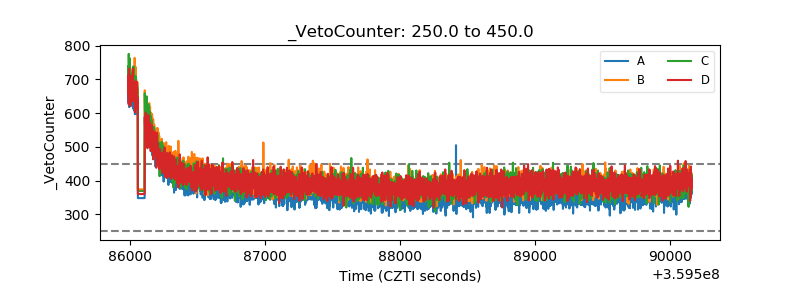 |