| Param | Original file | Final file |
|---|---|---|
| Filename | modeM0/AS1A10_103T02_9000004406cztM0_level2.fits | modeM0/AS1A10_103T02_9000004406cztM0_level2_quad_clean.evt |
| Size (bytes) | 594,316,800 | 458,556,480 |
| Size | 566.8 MB | 437.3 MB |
| Events in quadrant A | 3,806,016 | 2,655,617 |
| Events in quadrant B | 3,532,844 | 2,608,472 |
| Events in quadrant C | 3,562,212 | 2,462,678 |
| Events in quadrant D | 3,187,098 | 2,248,800 |
| Mode M9 | |||
|---|---|---|---|
| Quadrant | BADHDUFLAG | Total packets | Discarded packets |
| A | 0 | 109 | 0 |
| B | 0 | 109 | 0 |
| C | 0 | 109 | 0 |
| D | 0 | 109 | 0 |
| Mode SS | |||
|---|---|---|---|
| Quadrant | BADHDUFLAG | Total packets | Discarded packets |
| A | 0 | 1162 | 0 |
| B | 0 | 1162 | 0 |
| C | 0 | 1162 | 0 |
| D | 0 | 1162 | 0 |
| Mode M0 | |||
|---|---|---|---|
| Quadrant | BADHDUFLAG | Total packets | Discarded packets |
| A | 0 | 125081 | 0 |
| B | 0 | 177940 | 0 |
| C | 0 | 128384 | 0 |
| D | 0 | 158904 | 0 |
| Quadrant | Total seconds | Saturated seconds | Saturation percentage |
|---|---|---|---|
| A | 56990 | 1027 | 1.802071% |
| B | 56990 | 1699 | 2.981225% |
| C | 56990 | 2432 | 4.267415% |
| D | 56990 | 2159 | 3.788384% |
Noise dominated data is calculated using 1-second bins in cleaned event files. If a bin has >2000 counts, and if more than 50% of those come from <1% of pixels, then it is considered to be noise-dominated and hence unusable.
| Quadrant | # 1 sec bins | Bins with >0 counts | Bins with >2000 counts | High rate bins dominated by noise | Noise dominated (total time) | Noise dominated (detector-on time) | Marked lightcurve |
|---|---|---|---|---|---|---|---|
| A | 67915 | 56990 | 0 | 0 | 0.00% | 0.00% |  |
| B | 67915 | 56989 | 0 | 0 | 0.00% | 0.00% |  |
| C | 67915 | 56959 | 0 | 0 | 0.00% | 0.00% |  |
| D | 67915 | 56987 | 0 | 0 | 0.00% | 0.00% |  |
Top three noisy pixels from each quadrant. If the there are fewer than three noisy pixels in the level2.evt file, extra rows are filled as -1
| Pixel properties | Quadrant properties | ||||||
|---|---|---|---|---|---|---|---|
| Quadrant | DetID | PixID | Counts | Sigma | Mean | Median | Sigma |
| A | 7 | 110 | 3051 | 8.93 | 991 | 939 | 236.4 |
| A | 0 | 29 | 3017 | 8.79 | 991 | 939 | 236.4 |
| A | 9 | 19 | 2852 | 8.09 | 991 | 939 | 236.4 |
| B | 2 | 9 | 2755 | 10.28 | 936 | 900 | 180.5 |
| B | 3 | 80 | 2343 | 8.0 | 936 | 900 | 180.5 |
| B | 5 | 128 | 2316 | 7.85 | 936 | 900 | 180.5 |
| C | 1 | 80 | 2662 | 7.51 | 941 | 888 | 236.2 |
| C | 1 | 81 | 2639 | 7.41 | 941 | 888 | 236.2 |
| C | 3 | 187 | 2504 | 6.84 | 941 | 888 | 236.2 |
| D | 15 | 46 | 2483 | 6.81 | 912 | 837 | 241.7 |
| D | 7 | 3 | 2231 | 5.77 | 912 | 837 | 241.7 |
| D | 6 | 67 | 2211 | 5.68 | 912 | 837 | 241.7 |
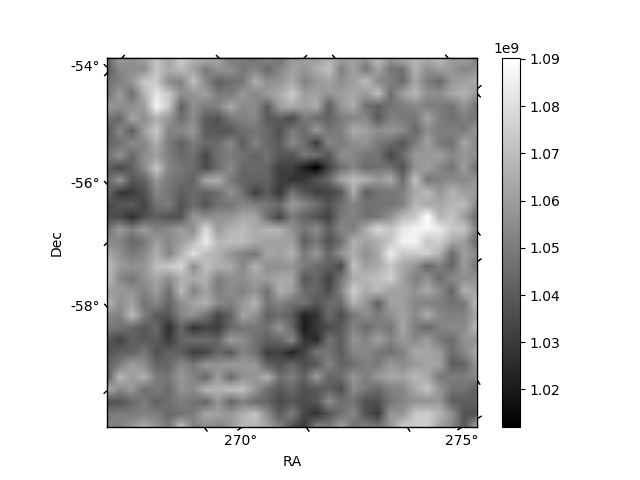
Histogram calculated using DETX and DETY for each event in the final _common_clean file
| Quadrant A |  |
 |
Quadrant B |
|---|---|---|---|
| Quadrant D |  |
 |
Quadrant C |
| Plot type | Count rate plots | Images |
|---|---|---|
| Comparison with Poisson distribution Blue bars denote a histogram of data divided into 1 sec bins. Red curve is a Poisson curve with rate = median count rate of data. |
 |
 |
| Quadrant-wise count rates Data is divided into 100 sec bins |
 |
|
| Module-wise count rates for Quadrant A Data is divided into 100 sec bins |
 |
 |
| Module-wise count rates for Quadrant B Data is divided into 100 sec bins |
 |
 |
| Module-wise count rates for Quadrant C Data is divided into 100 sec bins |
 |
 |
| Module-wise count rates for Quadrant D Data is divided into 100 sec bins |
 |
 |
| Parameter | Plot |
|---|---|
| CZT HV Monitor |  |
| D_VDD | 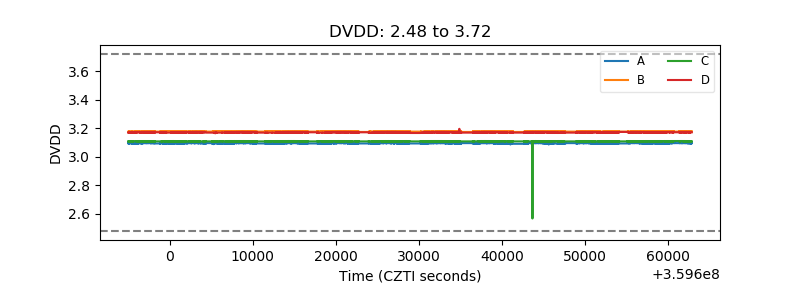 |
| Temperature 1 |  |
| Veto HV Monitor |  |
| Veto LLD |  |
| Alpha Counter |  |
| _CPM_Rate |  |
| CZT Counter |  |
| +2.5 Volts monitor |  |
| +5 Volts monitor |  |
| _ROLL_ROT |  |
| _Roll_DEC |  |
| _Roll_RA |  |
| Veto Counter |  |