| Param | Original file | Final file |
|---|---|---|
| Filename | modeM0/AS1A10_103T02_9000004406_30580cztM0_level2.evt | modeM0/AS1A10_103T02_9000004406_30580cztM0_level2_quad_clean.evt |
| Size (bytes) | 1,292,725,440 | 208,408,320 |
| Size | 1.2 GB | 198.8 MB |
| Events in quadrant A | 7,960,044 | 1,339,122 |
| Events in quadrant B | 12,461,223 | 1,343,636 |
| Events in quadrant C | 8,052,670 | 1,282,243 |
| Events in quadrant D | 9,609,034 | 1,255,130 |
| Mode M9 | |||
|---|---|---|---|
| Quadrant | BADHDUFLAG | Total packets | Discarded packets |
| A | 0 | 22 | 0 |
| B | 0 | 22 | 0 |
| C | 0 | 22 | 0 |
| D | 0 | 22 | 0 |
| Mode SS | |||
|---|---|---|---|
| Quadrant | BADHDUFLAG | Total packets | Discarded packets |
| A | 0 | 320 | 0 |
| B | 0 | 320 | 0 |
| C | 0 | 320 | 0 |
| D | 0 | 320 | 0 |
| Mode M0 | |||
|---|---|---|---|
| Quadrant | BADHDUFLAG | Total packets | Discarded packets |
| A | 0 | 33737 | 3 |
| B | 0 | 49037 | 3 |
| C | 0 | 33352 | 3 |
| D | 0 | 38828 | 3 |
| Quadrant | Total seconds | Saturated seconds | Saturation percentage |
|---|---|---|---|
| A | 15837 | 169 | 1.067121% |
| B | 15837 | 331 | 2.090042% |
| C | 15836 | 359 | 2.266987% |
| D | 15836 | 309 | 1.951250% |
Noise dominated data is calculated using 1-second bins in cleaned event files. If a bin has >2000 counts, and if more than 50% of those come from <1% of pixels, then it is considered to be noise-dominated and hence unusable.
| Quadrant | # 1 sec bins | Bins with >0 counts | Bins with >2000 counts | High rate bins dominated by noise | Noise dominated (total time) | Noise dominated (detector-on time) | Marked lightcurve |
|---|---|---|---|---|---|---|---|
| A | 17947 | 15840 | 56 | 56 | 0.31% | 0.35% |  |
| B | 17947 | 15840 | 108 | 108 | 0.60% | 0.68% | 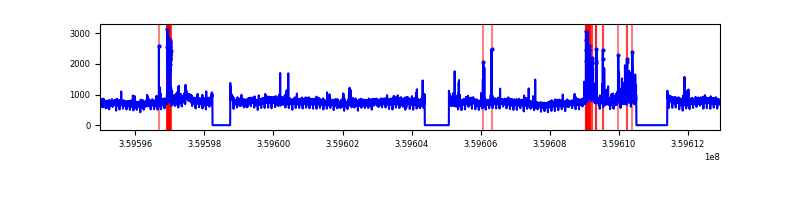 |
| C | 17946 | 15839 | 27 | 27 | 0.15% | 0.17% | 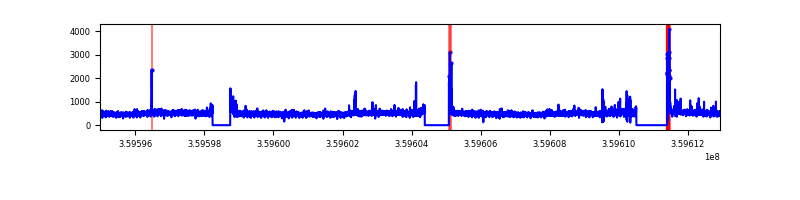 |
| D | 17946 | 15839 | 209 | 209 | 1.16% | 1.32% | 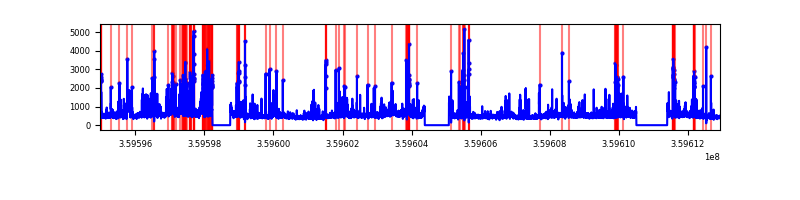 |
Top three noisy pixels from each quadrant. If the there are fewer than three noisy pixels in the level2.evt file, extra rows are filled as -1
| Pixel properties | Quadrant properties | ||||||
|---|---|---|---|---|---|---|---|
| Quadrant | DetID | PixID | Counts | Sigma | Mean | Median | Sigma |
| A | 0 | 13 | 453748 | 1182.93 | 1913 | 1870 | 382.0 |
| A | 12 | 96 | 91603 | 234.9 | 1913 | 1870 | 382.0 |
| A | 8 | 192 | 35268 | 87.43 | 1913 | 1870 | 382.0 |
| B | 6 | 159 | 4360024 | 12034.23 | 1890 | 1837 | 362.1 |
| B | 6 | 36 | 337861 | 927.86 | 1890 | 1837 | 362.1 |
| B | 15 | 36 | 168620 | 460.54 | 1890 | 1837 | 362.1 |
| C | 14 | 238 | 341229 | 789.96 | 1842 | 1855 | 429.6 |
| C | 3 | 233 | 205641 | 474.35 | 1842 | 1855 | 429.6 |
| C | 0 | 10 | 181567 | 418.32 | 1842 | 1855 | 429.6 |
| D | 1 | 52 | 1397634 | 3160.98 | 1862 | 1813 | 441.6 |
| D | 12 | 227 | 418007 | 942.51 | 1862 | 1813 | 441.6 |
| D | 13 | 249 | 209897 | 471.23 | 1862 | 1813 | 441.6 |
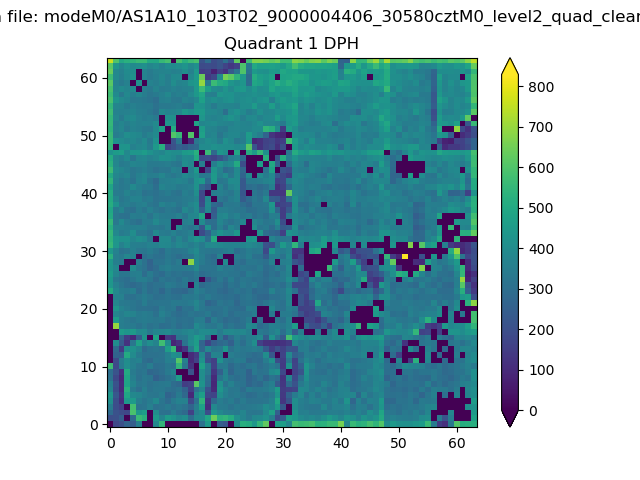
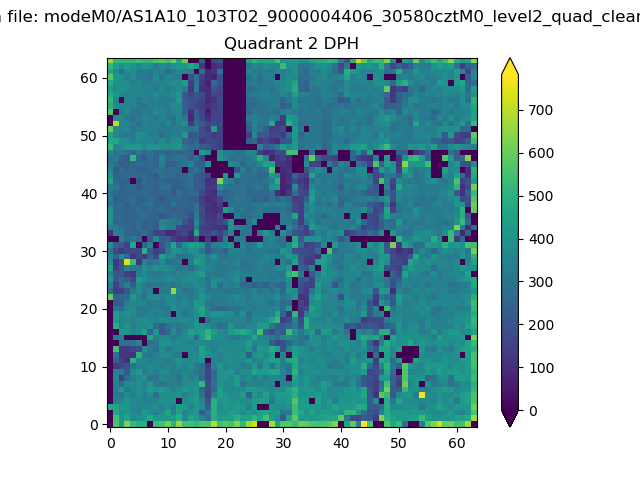
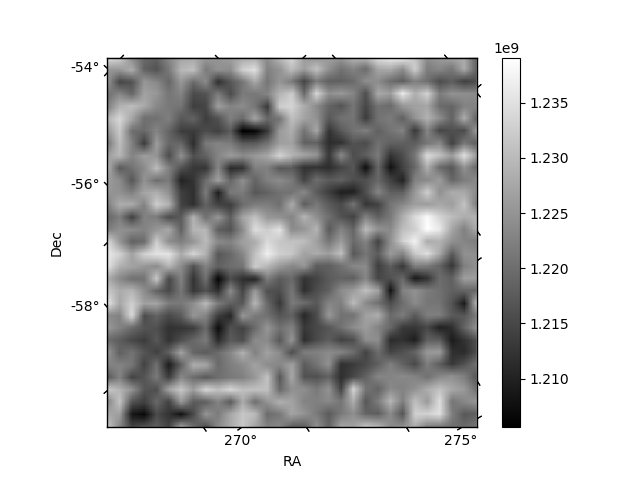
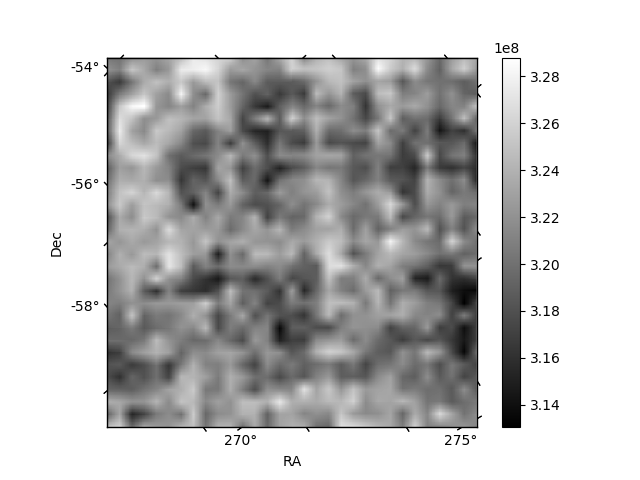
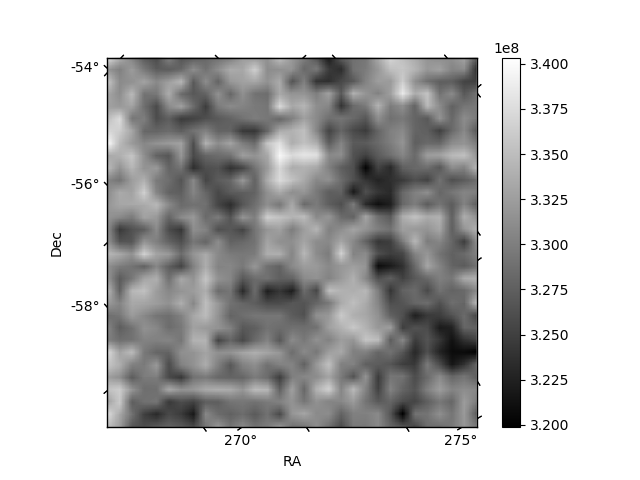
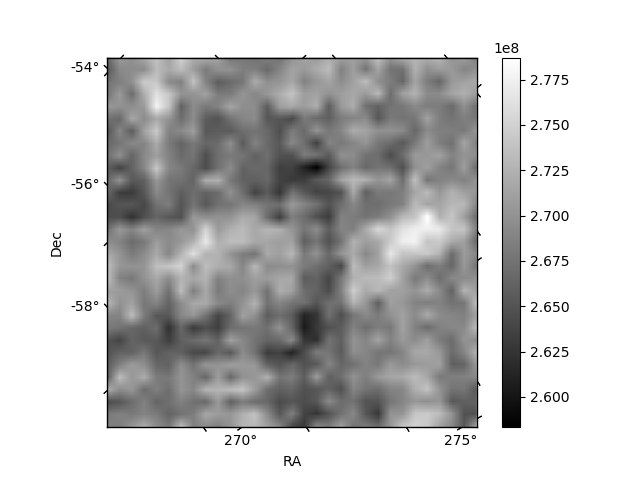
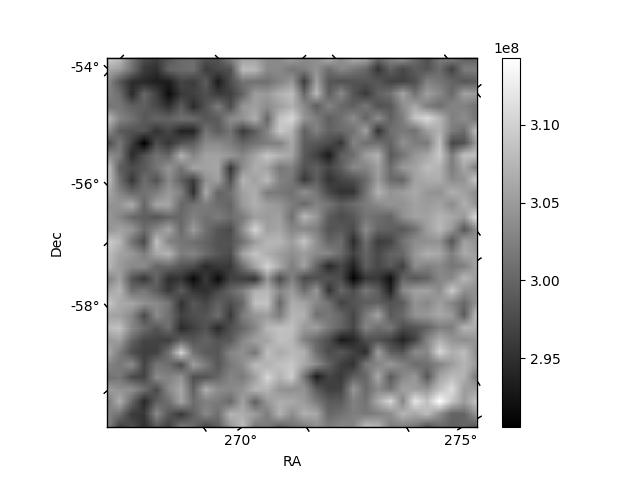
Histogram calculated using DETX and DETY for each event in the final _common_clean file
| Quadrant A | 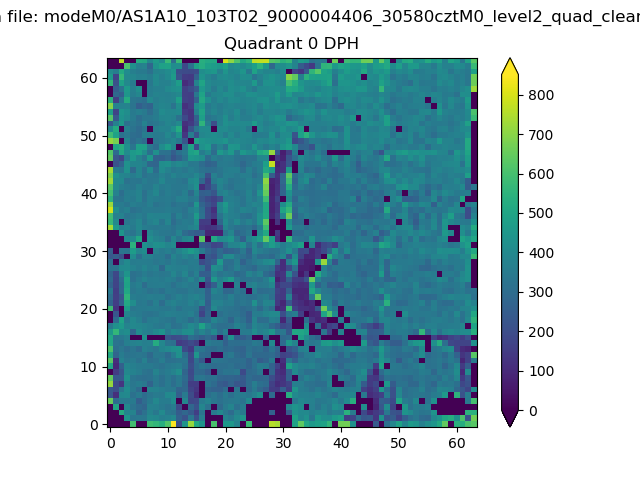 |
 |
Quadrant B |
|---|---|---|---|
| Quadrant D | 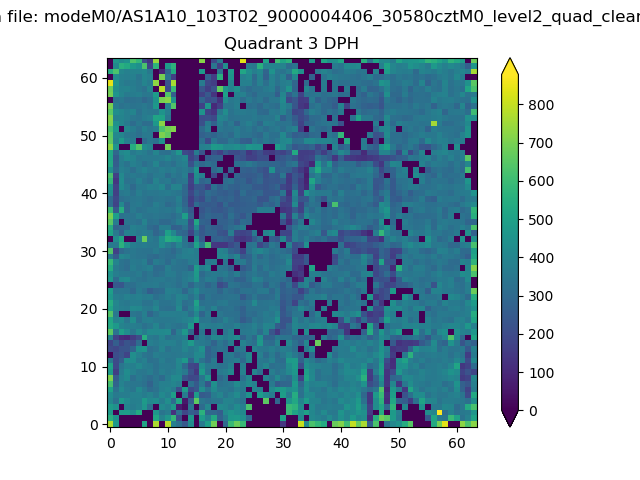 |
 |
Quadrant C |
| Plot type | Count rate plots | Images |
|---|---|---|
| Comparison with Poisson distribution Blue bars denote a histogram of data divided into 1 sec bins. Red curve is a Poisson curve with rate = median count rate of data. |
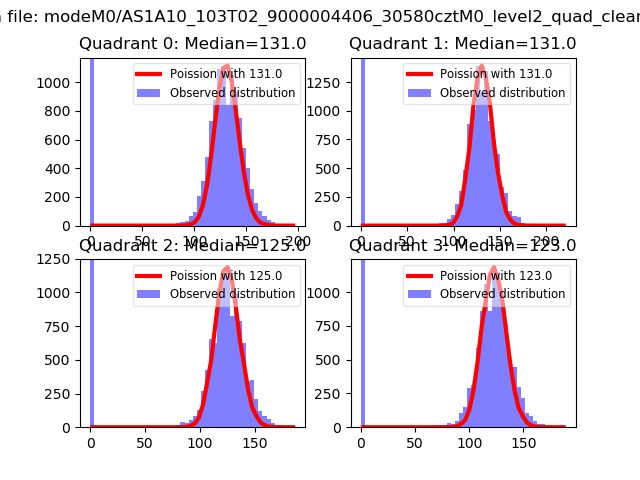 |
 |
| Quadrant-wise count rates Data is divided into 100 sec bins |
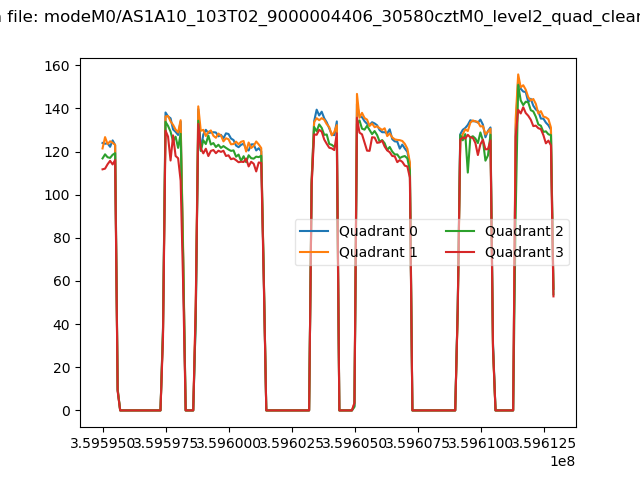 |
|
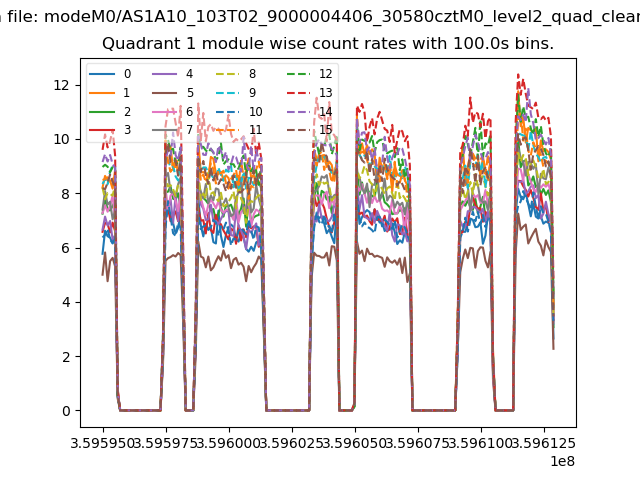
| Module-wise count rates for Quadrant A Data is divided into 100 sec bins |
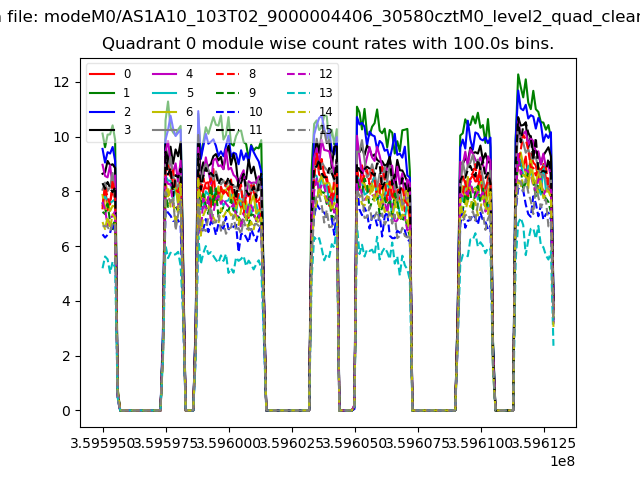 |
 |
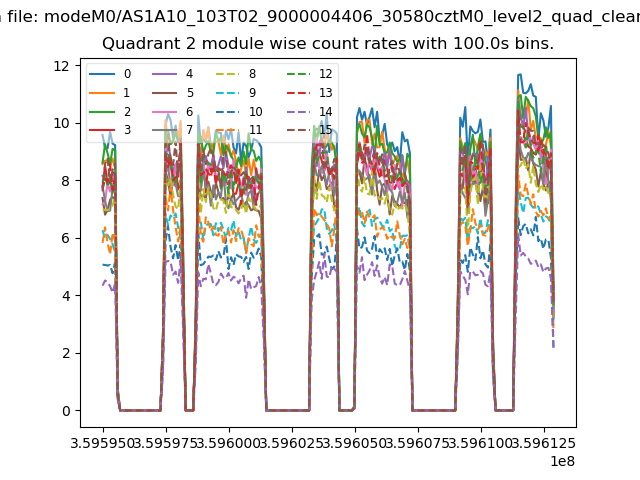
| Module-wise count rates for Quadrant B Data is divided into 100 sec bins |
 |
 |
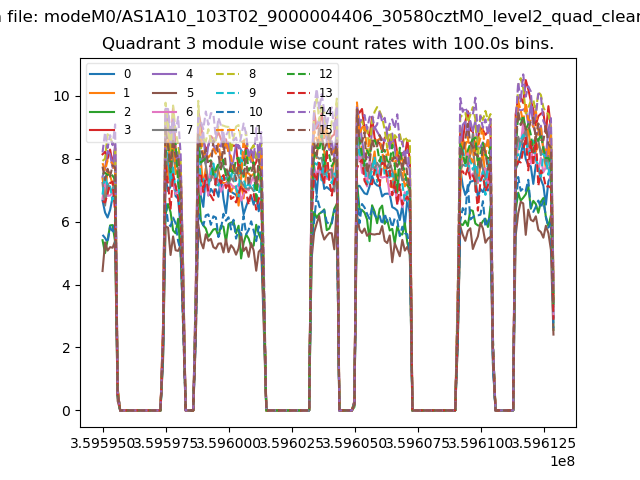
| Module-wise count rates for Quadrant C Data is divided into 100 sec bins |
 |
 |
| Module-wise count rates for Quadrant D Data is divided into 100 sec bins |
 |
 |
| Parameter | Plot |
|---|---|
| CZT HV Monitor | 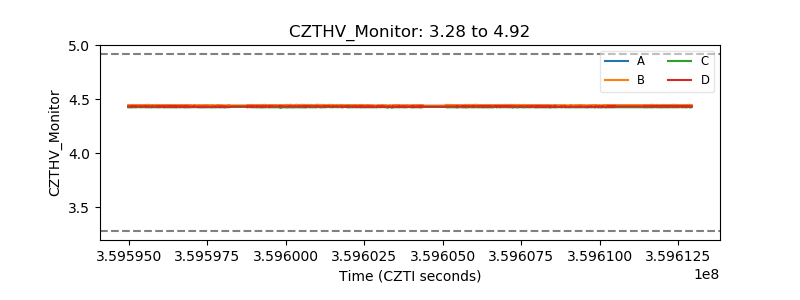 |
| D_VDD | 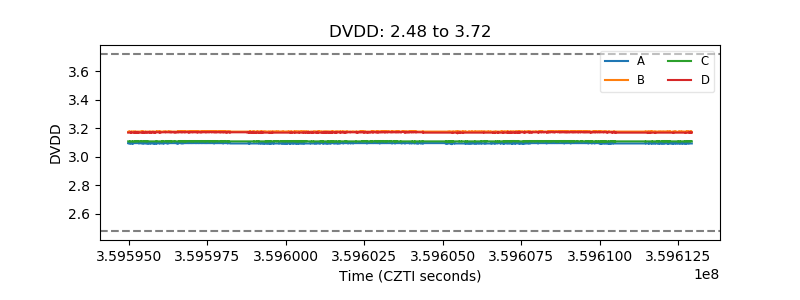 |
| Temperature 1 | 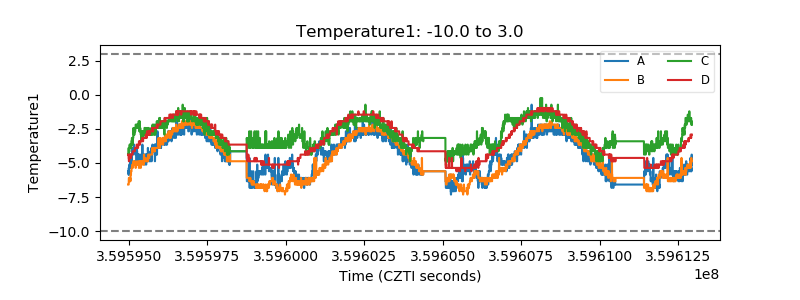 |
| Veto HV Monitor | 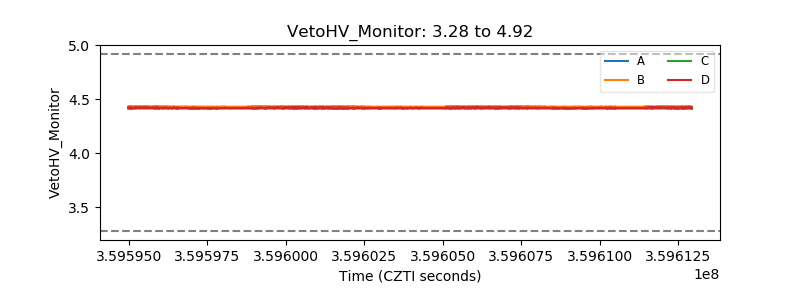 |
| Veto LLD | 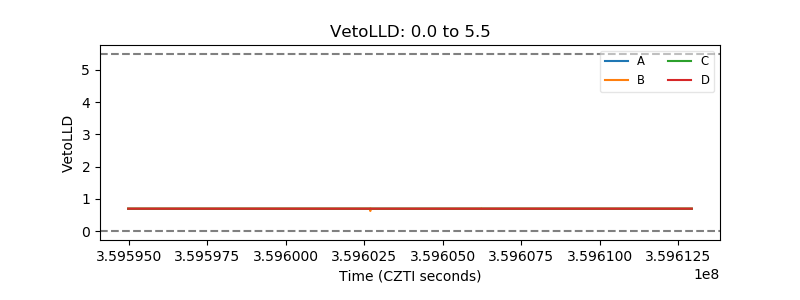 |
| Alpha Counter | 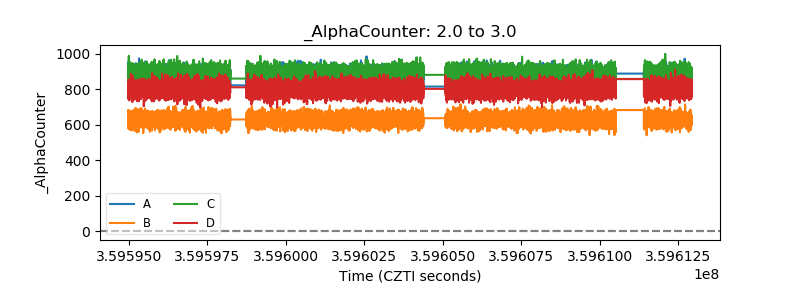 |
| _CPM_Rate | 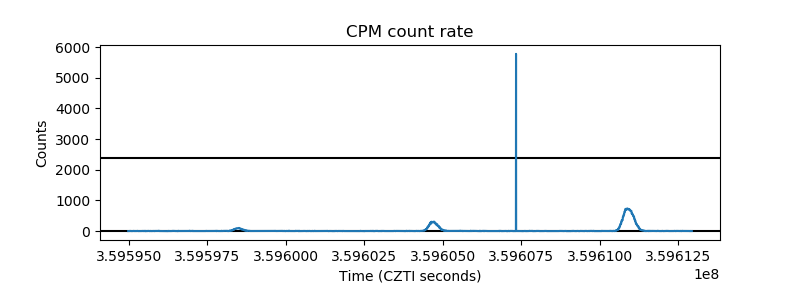 |
| CZT Counter | 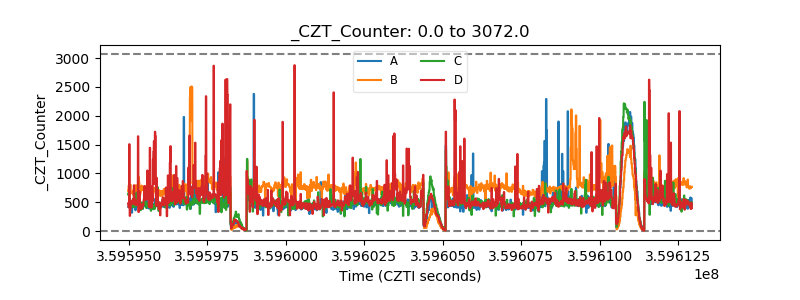 |
| +2.5 Volts monitor |  |
| +5 Volts monitor |  |
| _ROLL_ROT | 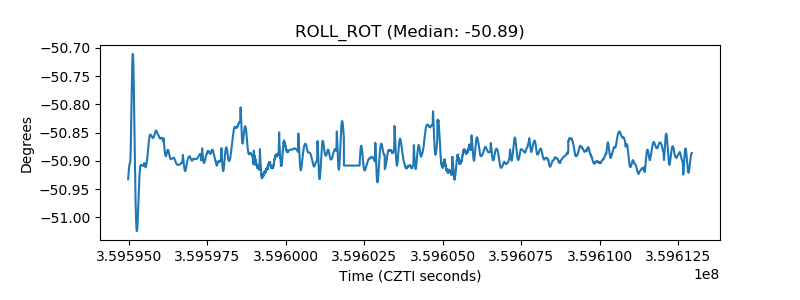 |
| _Roll_DEC | 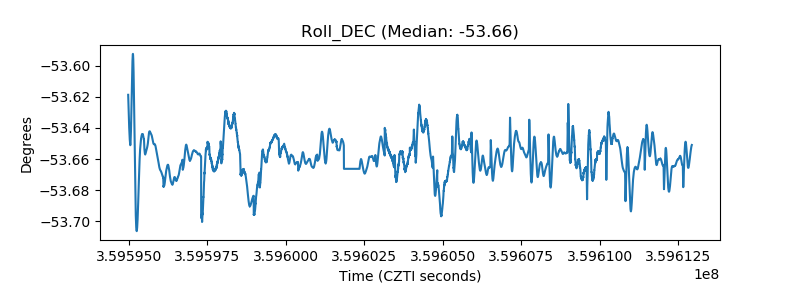 |
| _Roll_RA | 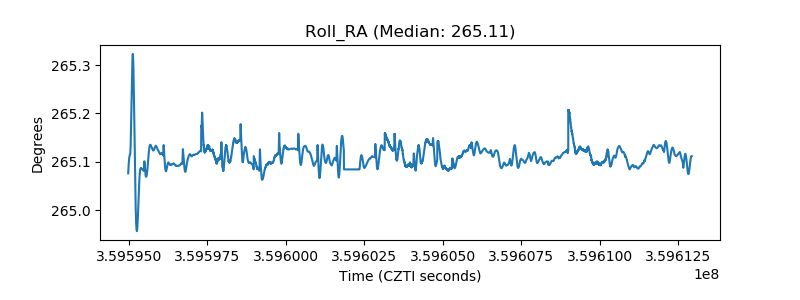 |
| Veto Counter | 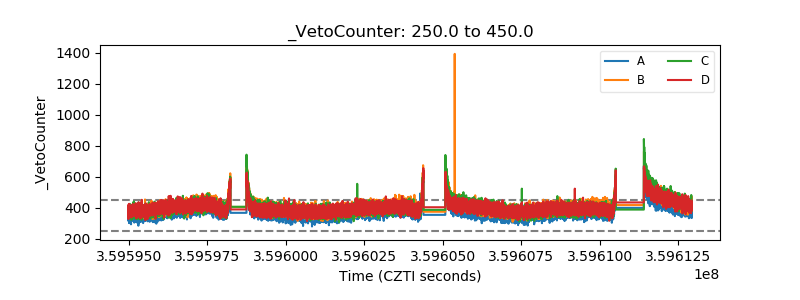 |