| Param | Original file | Final file |
|---|---|---|
| Filename | modeM0/AS1A10_103T02_9000004406_30581cztM0_level2.evt | modeM0/AS1A10_103T02_9000004406_30581cztM0_level2_quad_clean.evt |
| Size (bytes) | 525,778,560 | 94,628,160 |
| Size | 501.4 MB | 90.2 MB |
| Events in quadrant A | 3,329,709 | 623,658 |
| Events in quadrant B | 4,878,390 | 625,327 |
| Events in quadrant C | 3,507,320 | 592,060 |
| Events in quadrant D | 3,779,867 | 583,916 |
| Mode M9 | |||
|---|---|---|---|
| Quadrant | BADHDUFLAG | Total packets | Discarded packets |
| A | 0 | 11 | 0 |
| B | 0 | 11 | 0 |
| C | 0 | 11 | 0 |
| D | 0 | 11 | 0 |
| Mode SS | |||
|---|---|---|---|
| Quadrant | BADHDUFLAG | Total packets | Discarded packets |
| A | 0 | 128 | 0 |
| B | 0 | 128 | 0 |
| C | 0 | 128 | 0 |
| D | 0 | 128 | 0 |
| Mode M0 | |||
|---|---|---|---|
| Quadrant | BADHDUFLAG | Total packets | Discarded packets |
| A | 0 | 13781 | 1 |
| B | 0 | 19195 | 1 |
| C | 0 | 14288 | 1 |
| D | 0 | 15274 | 1 |
| Quadrant | Total seconds | Saturated seconds | Saturation percentage |
|---|---|---|---|
| A | 6314 | 84 | 1.330377% |
| B | 6315 | 54 | 0.855107% |
| C | 6315 | 271 | 4.291370% |
| D | 6315 | 130 | 2.058591% |
Noise dominated data is calculated using 1-second bins in cleaned event files. If a bin has >2000 counts, and if more than 50% of those come from <1% of pixels, then it is considered to be noise-dominated and hence unusable.
| Quadrant | # 1 sec bins | Bins with >0 counts | Bins with >2000 counts | High rate bins dominated by noise | Noise dominated (total time) | Noise dominated (detector-on time) | Marked lightcurve |
|---|---|---|---|---|---|---|---|
| A | 7374 | 6315 | 49 | 49 | 0.66% | 0.78% | 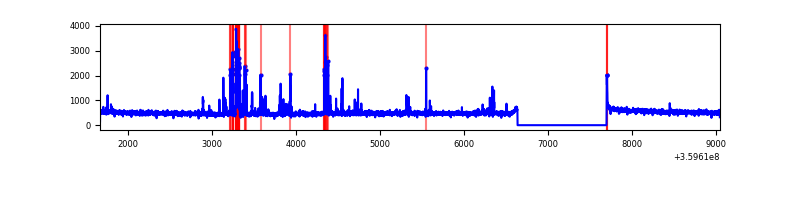 |
| B | 7375 | 6316 | 3 | 3 | 0.04% | 0.05% | 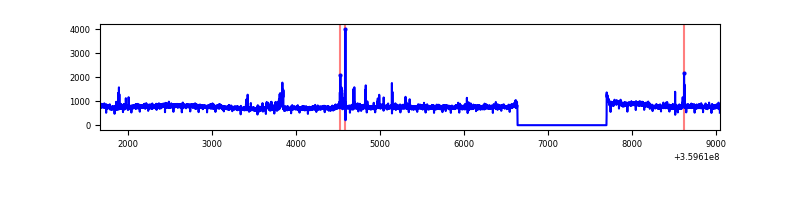 |
| C | 7375 | 6316 | 47 | 47 | 0.64% | 0.74% | 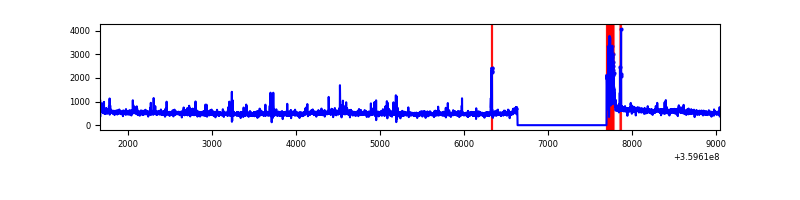 |
| D | 7375 | 6316 | 104 | 104 | 1.41% | 1.65% |  |
Top three noisy pixels from each quadrant. If the there are fewer than three noisy pixels in the level2.evt file, extra rows are filled as -1
| Pixel properties | Quadrant properties | ||||||
|---|---|---|---|---|---|---|---|
| Quadrant | DetID | PixID | Counts | Sigma | Mean | Median | Sigma |
| A | 0 | 13 | 286557 | 1817.46 | 785 | 770 | 157.2 |
| A | 13 | 254 | 11725 | 69.67 | 785 | 770 | 157.2 |
| A | 8 | 192 | 11097 | 65.67 | 785 | 770 | 157.2 |
| B | 6 | 159 | 1721692 | 11632.9 | 778 | 758 | 147.9 |
| B | 0 | 229 | 41301 | 274.06 | 778 | 758 | 147.9 |
| B | 15 | 36 | 39873 | 264.4 | 778 | 758 | 147.9 |
| C | 14 | 238 | 167173 | 945.95 | 753 | 759 | 175.9 |
| C | 0 | 10 | 159805 | 904.07 | 753 | 759 | 175.9 |
| C | 3 | 233 | 129397 | 731.22 | 753 | 759 | 175.9 |
| D | 1 | 52 | 421909 | 2335.8 | 763 | 743 | 180.3 |
| D | 5 | 222 | 139323 | 768.57 | 763 | 743 | 180.3 |
| D | 13 | 249 | 113356 | 624.55 | 763 | 743 | 180.3 |
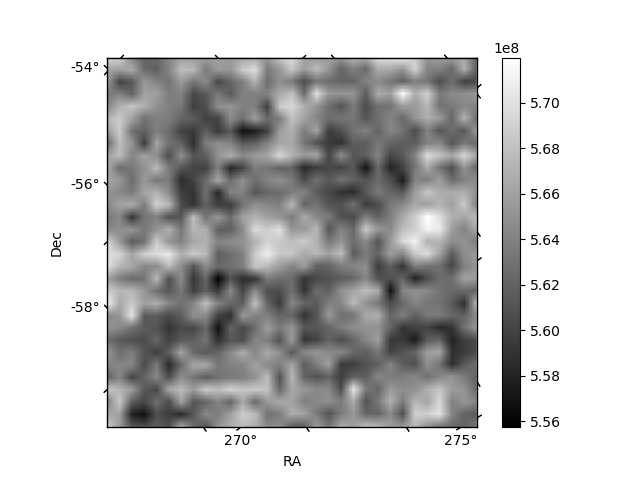
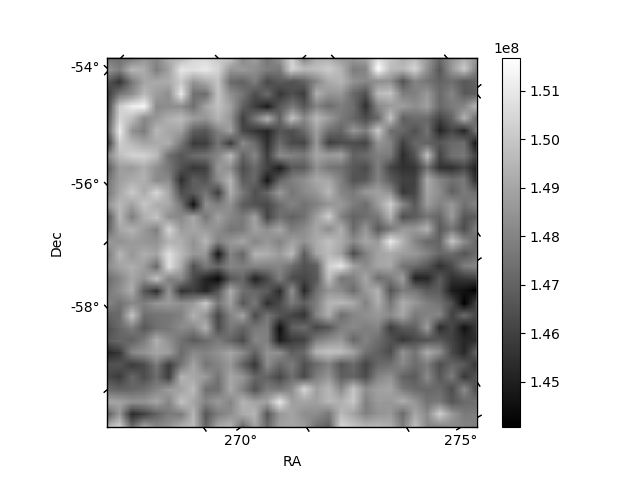
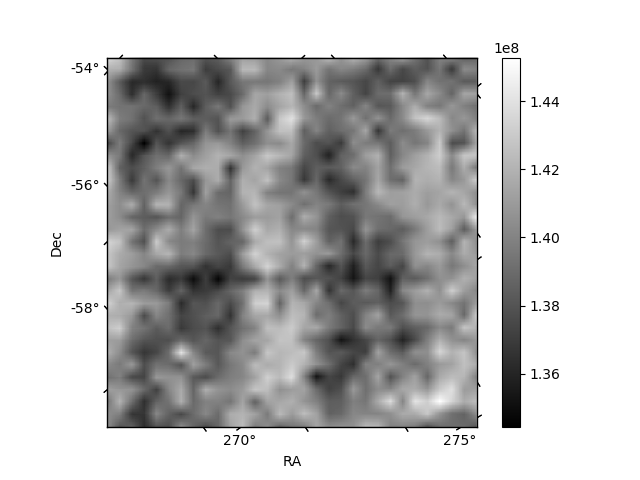
Histogram calculated using DETX and DETY for each event in the final _common_clean file
| Quadrant A | 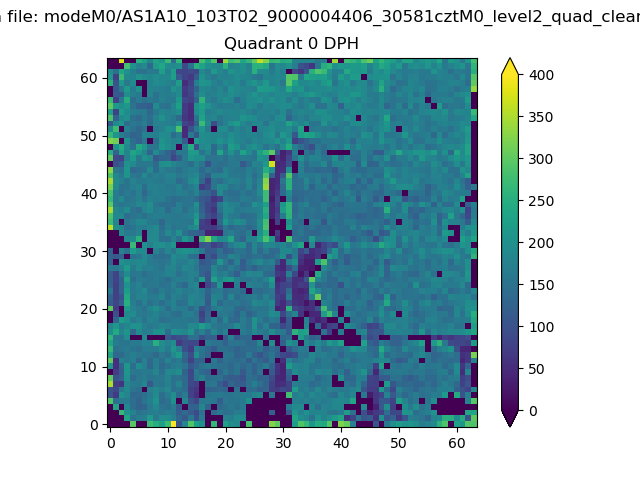 |
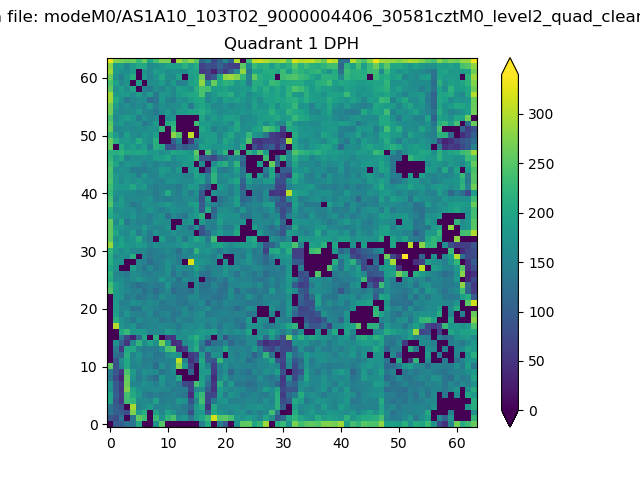 |
Quadrant B |
|---|---|---|---|
| Quadrant D | 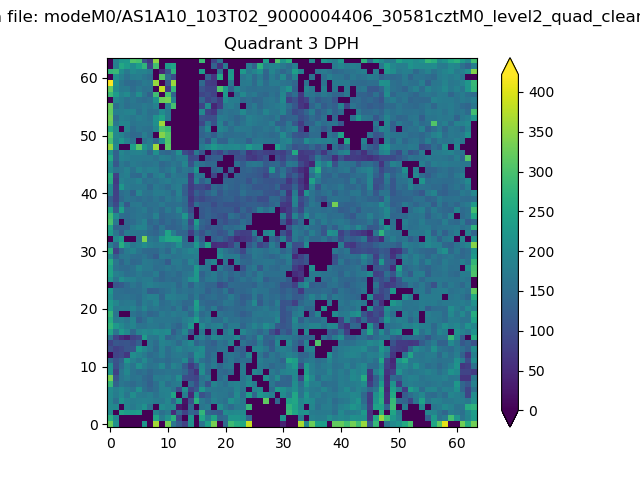 |
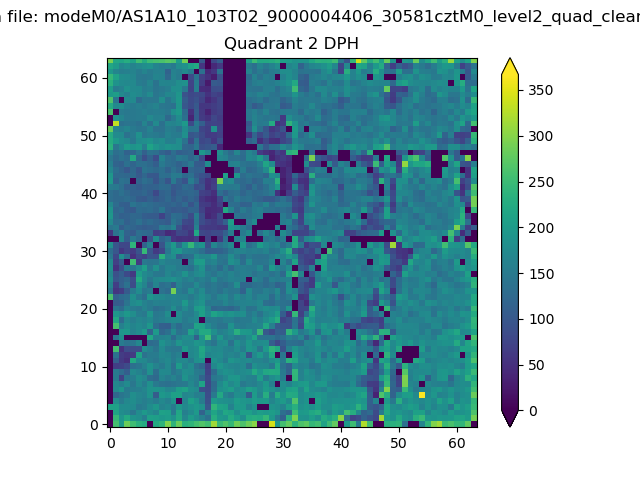 |
Quadrant C |
| Plot type | Count rate plots | Images |
|---|---|---|
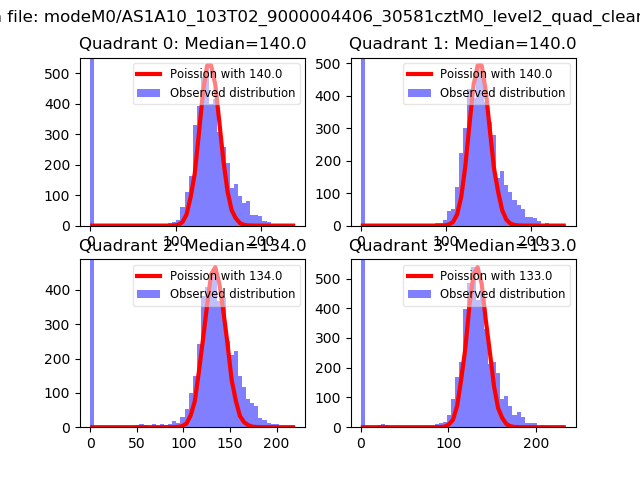
| Comparison with Poisson distribution Blue bars denote a histogram of data divided into 1 sec bins. Red curve is a Poisson curve with rate = median count rate of data. |
 |
 |
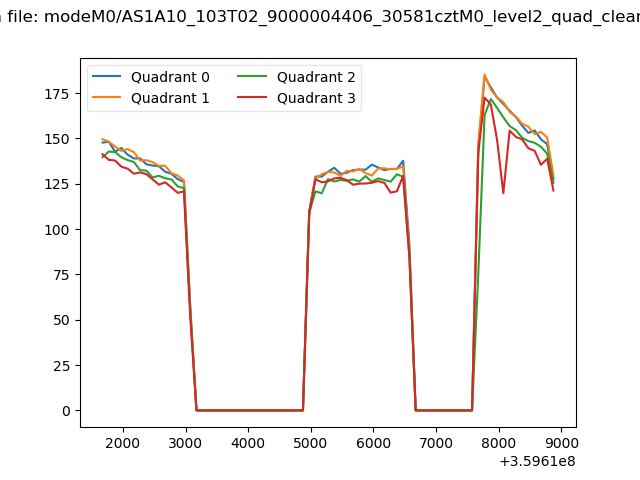
| Quadrant-wise count rates Data is divided into 100 sec bins |
 |
|
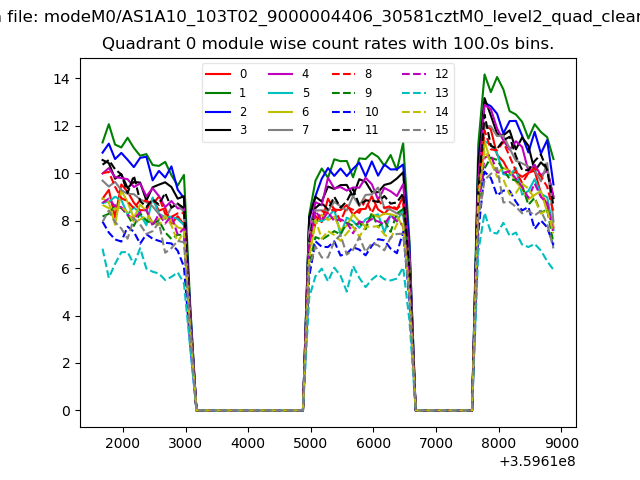
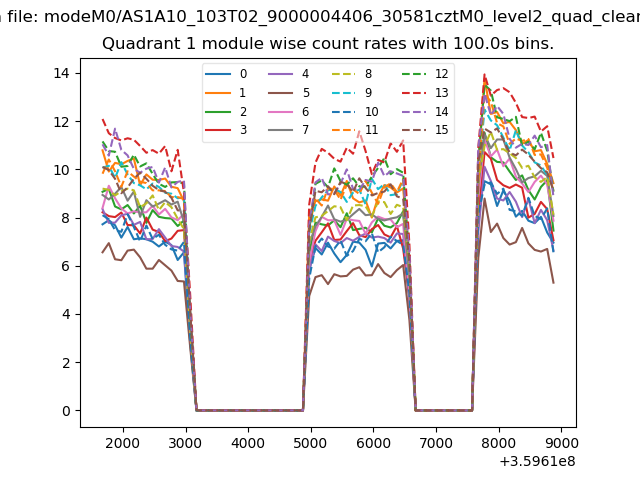
| Module-wise count rates for Quadrant A Data is divided into 100 sec bins |
 |
 |
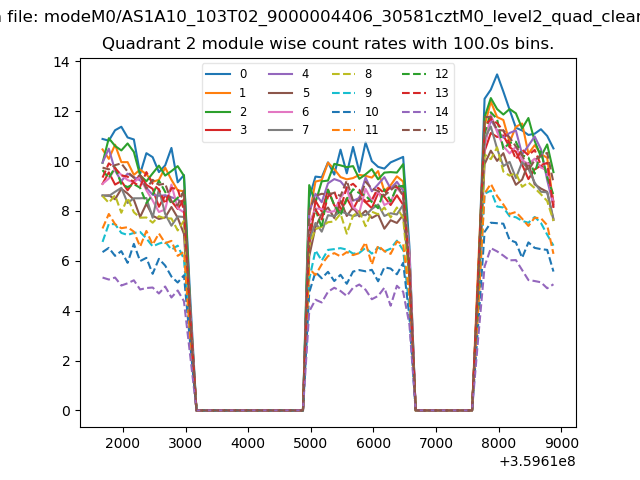
| Module-wise count rates for Quadrant B Data is divided into 100 sec bins |
 |
 |
| Module-wise count rates for Quadrant C Data is divided into 100 sec bins |
 |
 |
| Module-wise count rates for Quadrant D Data is divided into 100 sec bins |
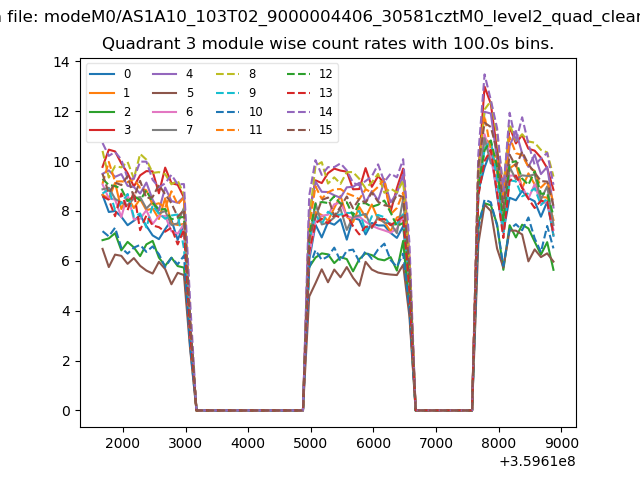 |
 |
| Parameter | Plot |
|---|---|
| CZT HV Monitor | 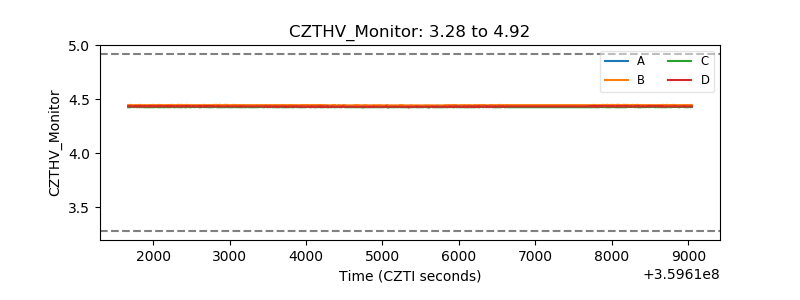 |
| D_VDD |  |
| Temperature 1 | 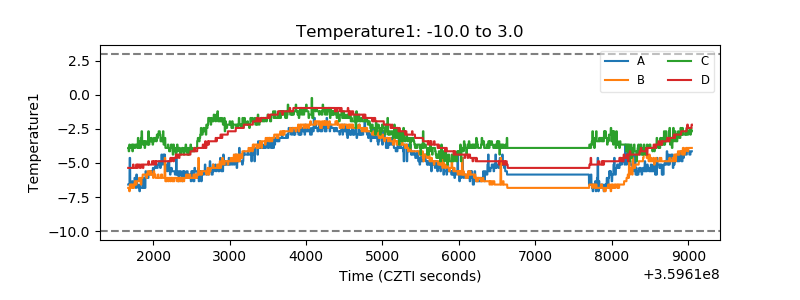 |
| Veto HV Monitor | 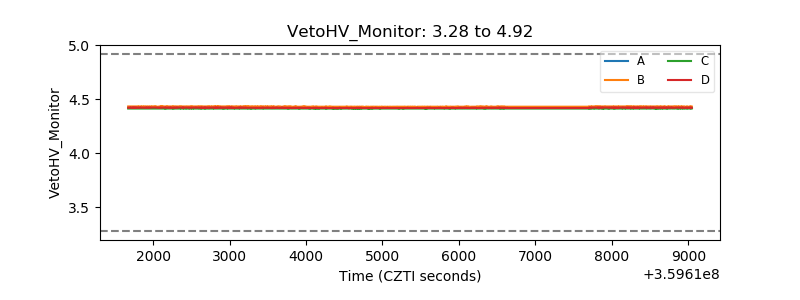 |
| Veto LLD | 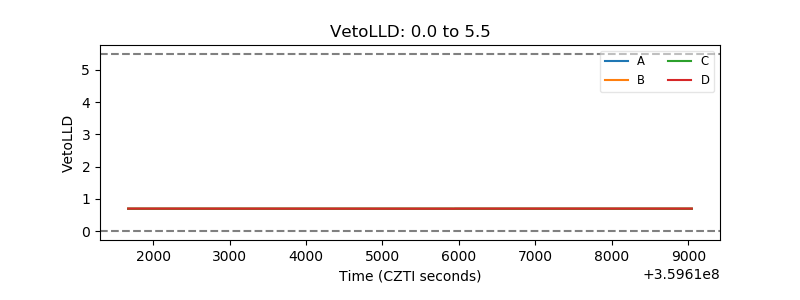 |
| Alpha Counter | 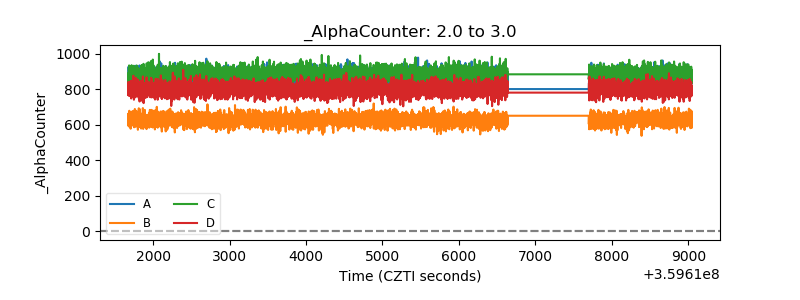 |
| _CPM_Rate | 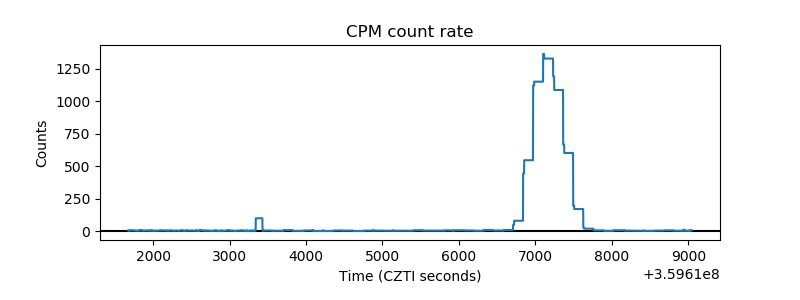 |
| CZT Counter | 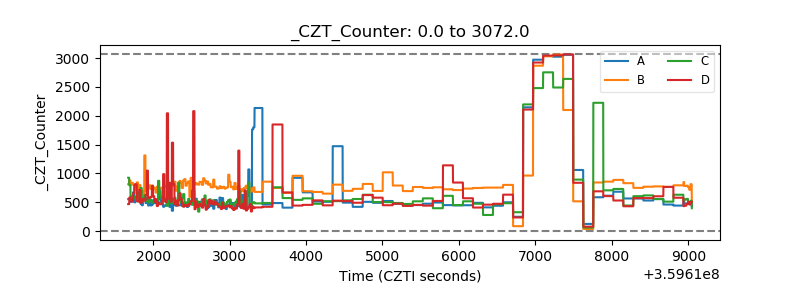 |
| +2.5 Volts monitor |  |
| +5 Volts monitor | 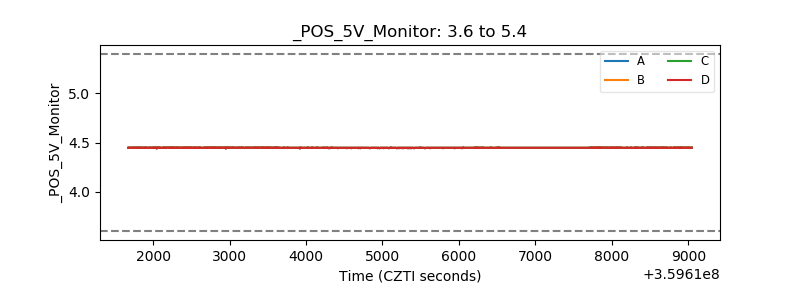 |
| _ROLL_ROT | 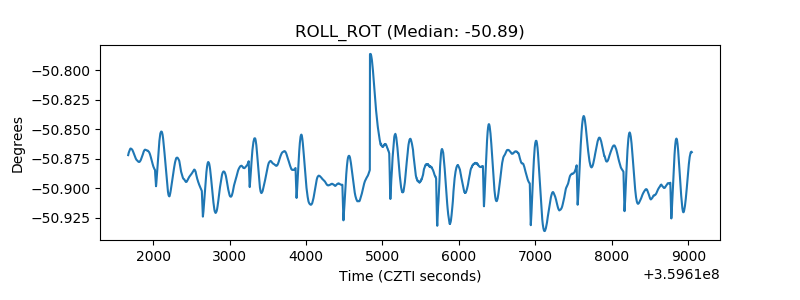 |
| _Roll_DEC | 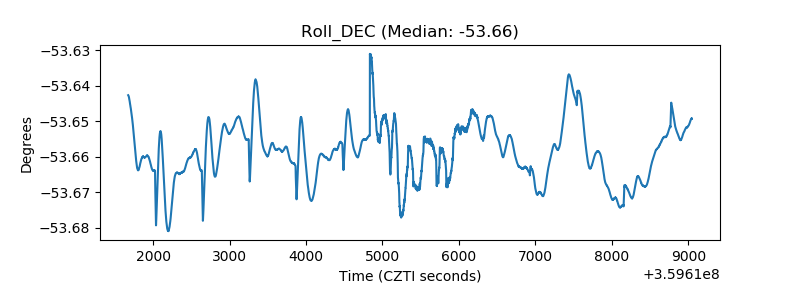 |
| _Roll_RA | 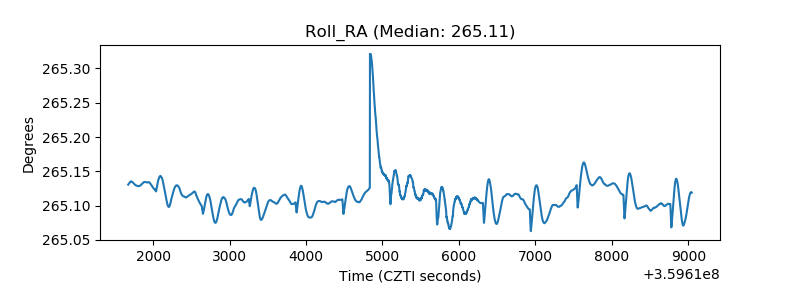 |
| Veto Counter | 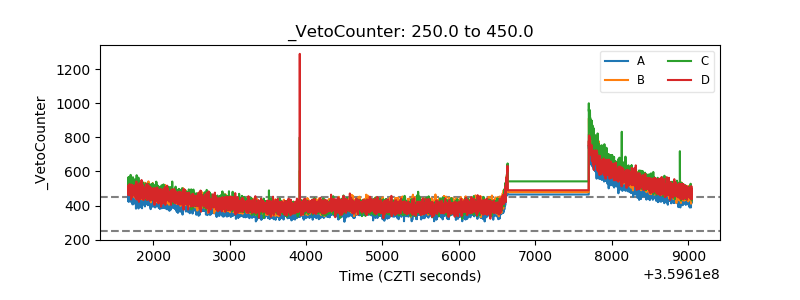 |