| Param | Original file | Final file |
|---|---|---|
| Filename | modeM0/AS1A10_103T02_9000004406_30584cztM0_level2.evt | modeM0/AS1A10_103T02_9000004406_30584cztM0_level2_quad_clean.evt |
| Size (bytes) | 570,735,360 | 90,518,400 |
| Size | 544.3 MB | 86.3 MB |
| Events in quadrant A | 3,745,060 | 599,516 |
| Events in quadrant B | 5,377,716 | 595,604 |
| Events in quadrant C | 3,963,232 | 542,603 |
| Events in quadrant D | 3,777,238 | 568,570 |
| Mode M9 | |||
|---|---|---|---|
| Quadrant | BADHDUFLAG | Total packets | Discarded packets |
| A | 0 | 14 | 0 |
| B | 0 | 15 | 0 |
| C | 0 | 15 | 0 |
| D | 0 | 15 | 0 |
| Mode SS | |||
|---|---|---|---|
| Quadrant | BADHDUFLAG | Total packets | Discarded packets |
| A | 0 | 128 | 0 |
| B | 0 | 128 | 0 |
| C | 0 | 128 | 0 |
| D | 0 | 128 | 0 |
| Mode M0 | |||
|---|---|---|---|
| Quadrant | BADHDUFLAG | Total packets | Discarded packets |
| A | 0 | 15109 | 2 |
| B | 0 | 20262 | 2 |
| C | 0 | 15811 | 2 |
| D | 0 | 15293 | 2 |
| Quadrant | Total seconds | Saturated seconds | Saturation percentage |
|---|---|---|---|
| A | 6221 | 218 | 3.504260% |
| B | 6221 | 250 | 4.018647% |
| C | 6221 | 456 | 7.330011% |
| D | 6221 | 131 | 2.105771% |
Noise dominated data is calculated using 1-second bins in cleaned event files. If a bin has >2000 counts, and if more than 50% of those come from <1% of pixels, then it is considered to be noise-dominated and hence unusable.
| Quadrant | # 1 sec bins | Bins with >0 counts | Bins with >2000 counts | High rate bins dominated by noise | Noise dominated (total time) | Noise dominated (detector-on time) | Marked lightcurve |
|---|---|---|---|---|---|---|---|
| A | 7446 | 6222 | 53 | 53 | 0.71% | 0.85% | 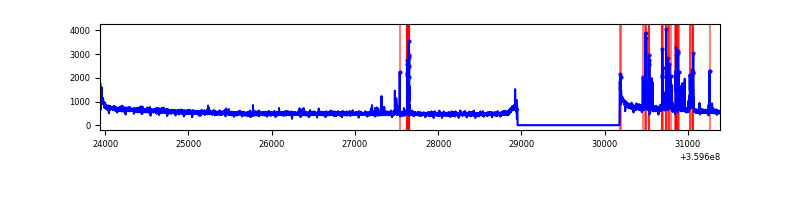 |
| B | 7446 | 6222 | 46 | 46 | 0.62% | 0.74% | 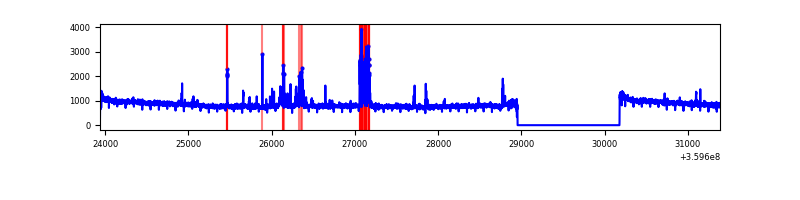 |
| C | 7446 | 6221 | 115 | 115 | 1.54% | 1.85% | 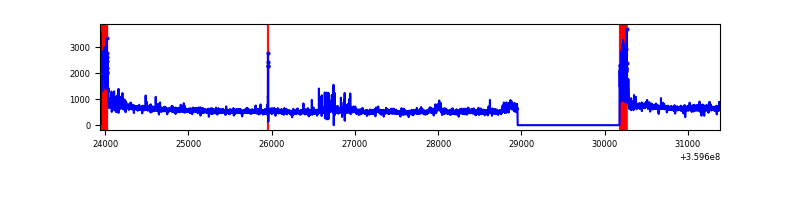 |
| D | 7446 | 6222 | 25 | 25 | 0.34% | 0.40% | 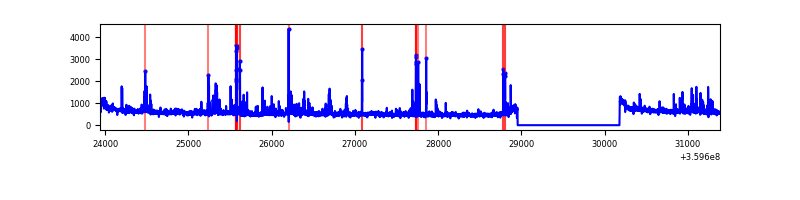 |
Top three noisy pixels from each quadrant. If the there are fewer than three noisy pixels in the level2.evt file, extra rows are filled as -1
| Pixel properties | Quadrant properties | ||||||
|---|---|---|---|---|---|---|---|
| Quadrant | DetID | PixID | Counts | Sigma | Mean | Median | Sigma |
| A | 0 | 13 | 310593 | 1781.05 | 886 | 873 | 173.9 |
| A | 8 | 192 | 18057 | 98.82 | 886 | 873 | 173.9 |
| A | 13 | 254 | 10622 | 56.06 | 886 | 873 | 173.9 |
| B | 6 | 159 | 1707401 | 10730.99 | 867 | 848 | 159.0 |
| B | 5 | 255 | 145339 | 908.58 | 867 | 848 | 159.0 |
| B | 0 | 229 | 86666 | 539.63 | 867 | 848 | 159.0 |
| C | 0 | 10 | 337896 | 1816.76 | 816 | 825 | 185.5 |
| C | 14 | 238 | 190812 | 1024.0 | 816 | 825 | 185.5 |
| C | 3 | 233 | 143175 | 767.25 | 816 | 825 | 185.5 |
| D | 1 | 52 | 197894 | 985.96 | 864 | 841 | 199.9 |
| D | 8 | 195 | 128443 | 638.46 | 864 | 841 | 199.9 |
| D | 13 | 249 | 47227 | 232.09 | 864 | 841 | 199.9 |
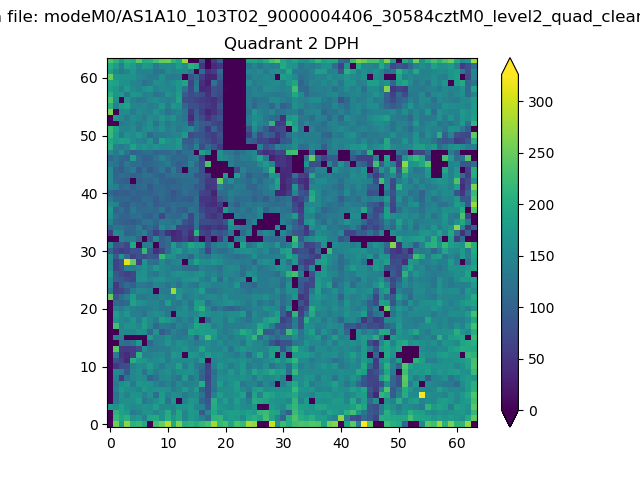
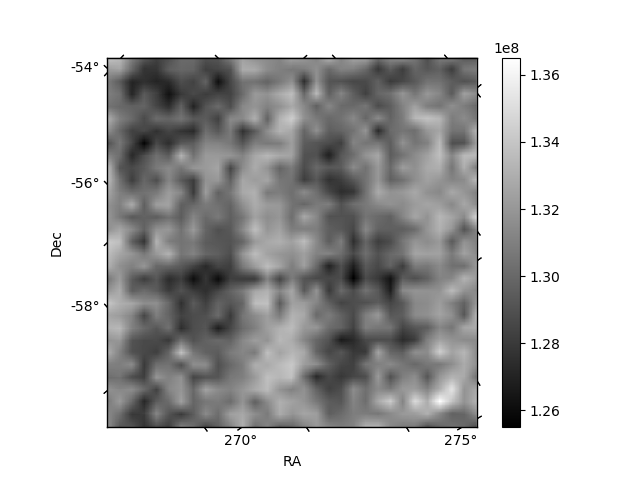
Histogram calculated using DETX and DETY for each event in the final _common_clean file
| Quadrant A | 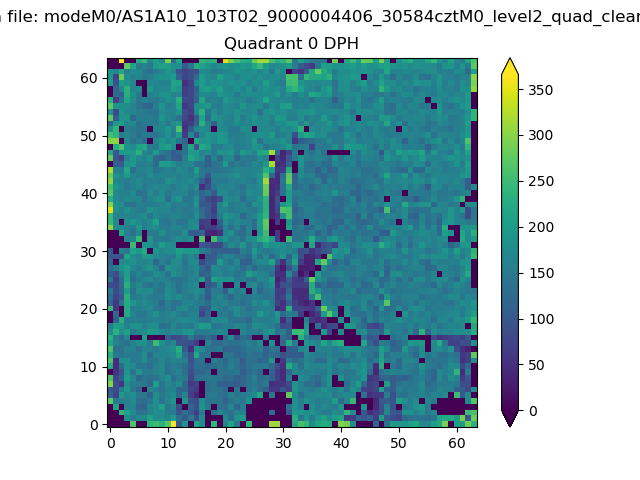 |
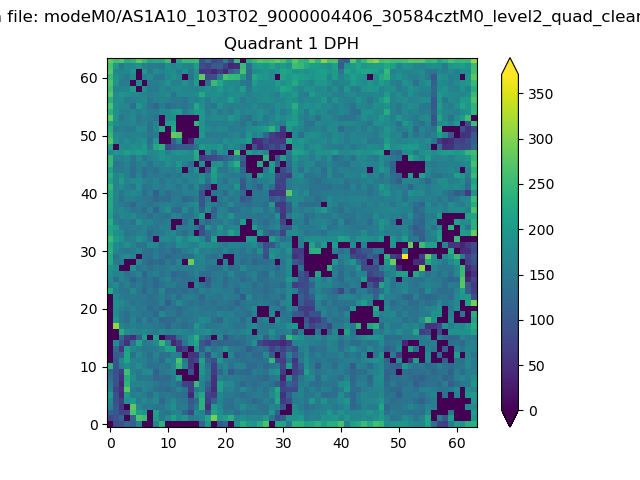 |
Quadrant B |
|---|---|---|---|
| Quadrant D | 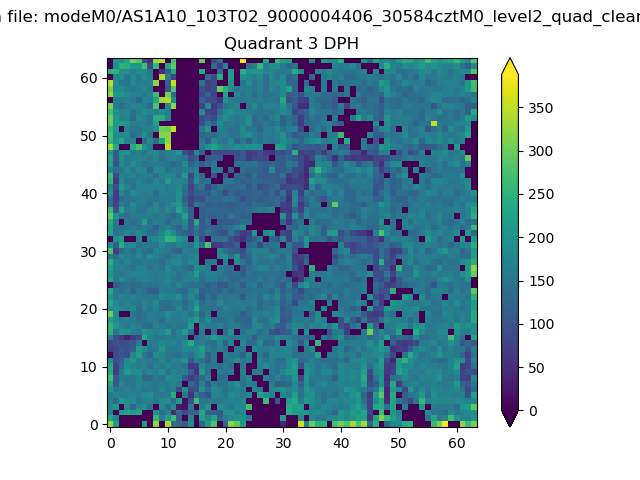 |
 |
Quadrant C |
| Plot type | Count rate plots | Images |
|---|---|---|
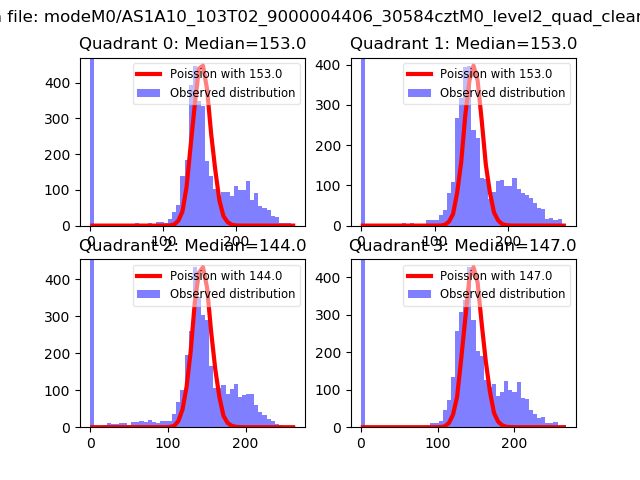
| Comparison with Poisson distribution Blue bars denote a histogram of data divided into 1 sec bins. Red curve is a Poisson curve with rate = median count rate of data. |
 |
 |
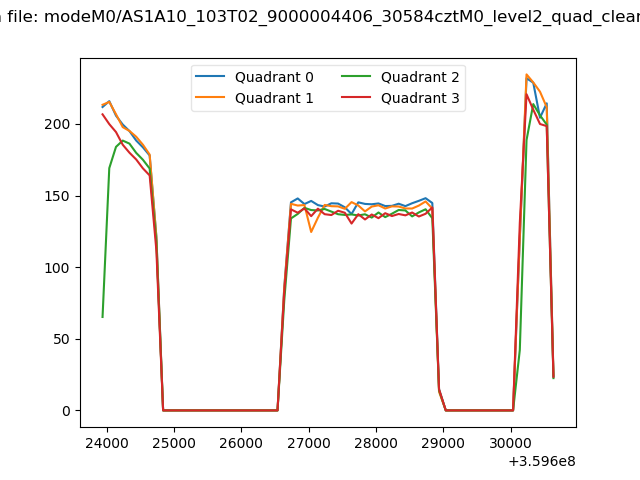
| Quadrant-wise count rates Data is divided into 100 sec bins |
 |
|
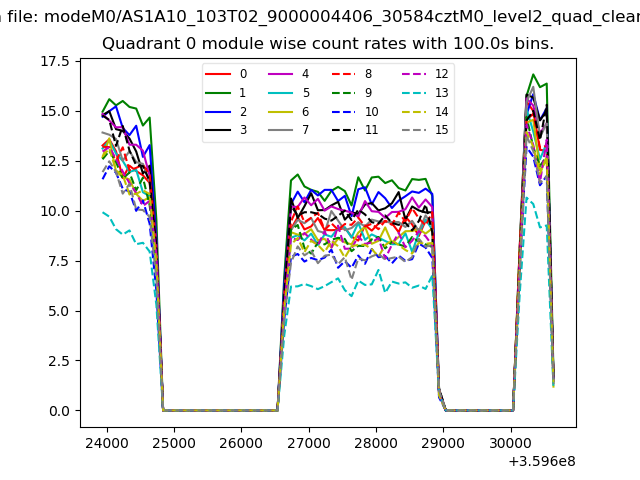
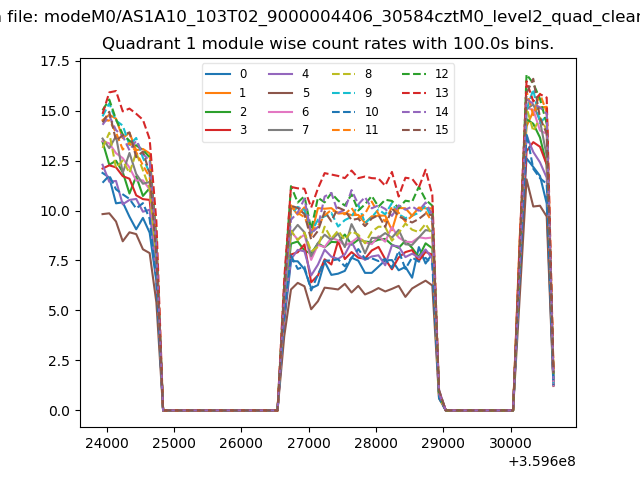
| Module-wise count rates for Quadrant A Data is divided into 100 sec bins |
 |
 |
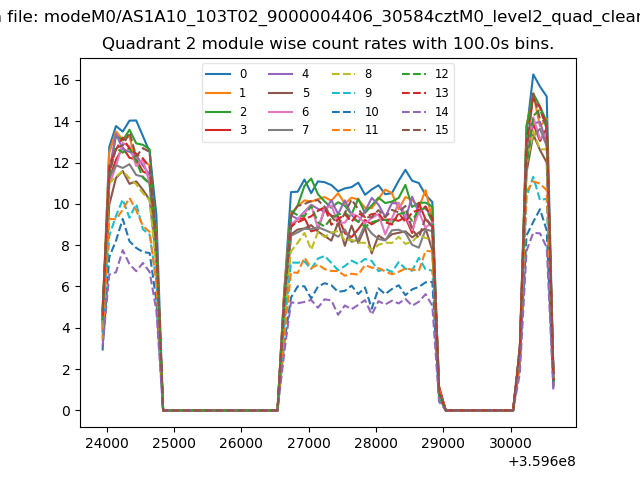
| Module-wise count rates for Quadrant B Data is divided into 100 sec bins |
 |
 |
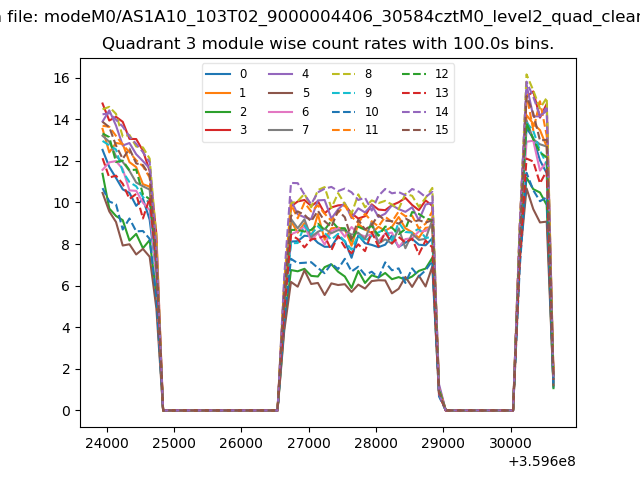
| Module-wise count rates for Quadrant C Data is divided into 100 sec bins |
 |
 |
| Module-wise count rates for Quadrant D Data is divided into 100 sec bins |
 |
 |
| Parameter | Plot |
|---|---|
| CZT HV Monitor | 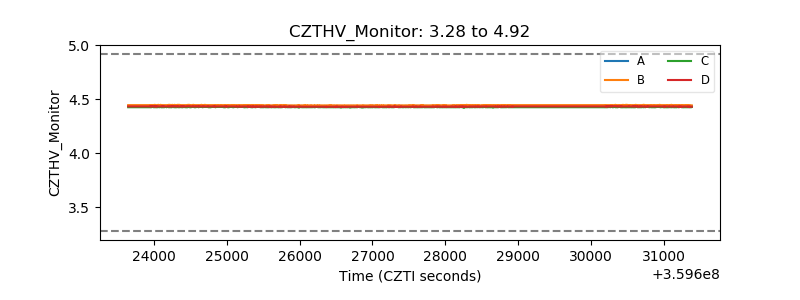 |
| D_VDD |  |
| Temperature 1 |  |
| Veto HV Monitor |  |
| Veto LLD |  |
| Alpha Counter | 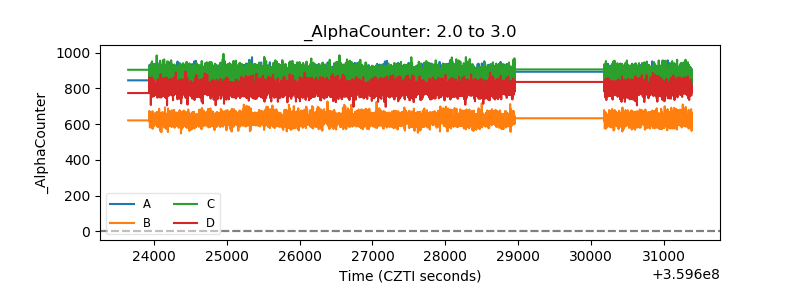 |
| _CPM_Rate | 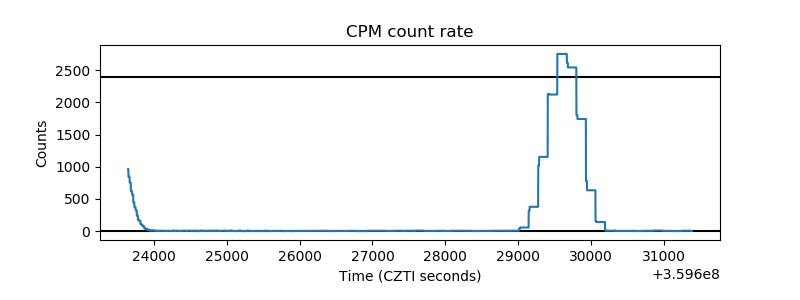 |
| CZT Counter | 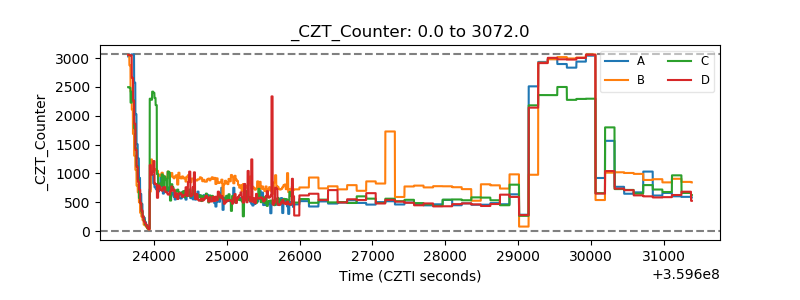 |
| +2.5 Volts monitor |  |
| +5 Volts monitor |  |
| _ROLL_ROT | 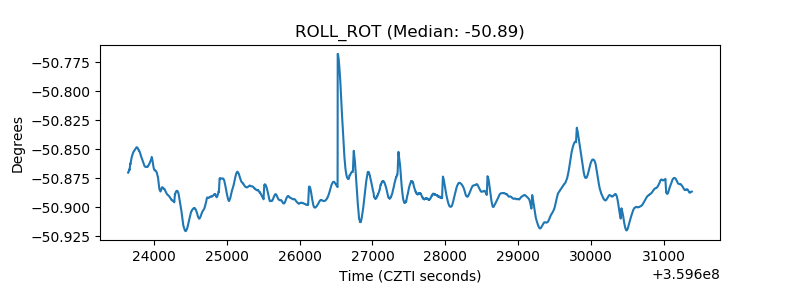 |
| _Roll_DEC | 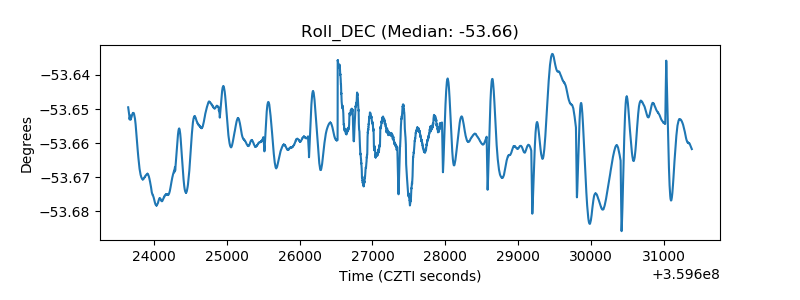 |
| _Roll_RA | 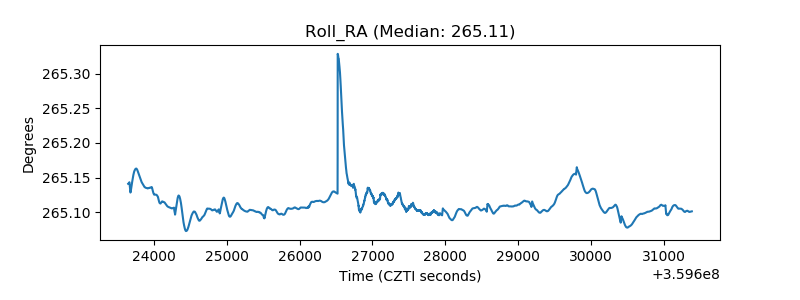 |
| Veto Counter | 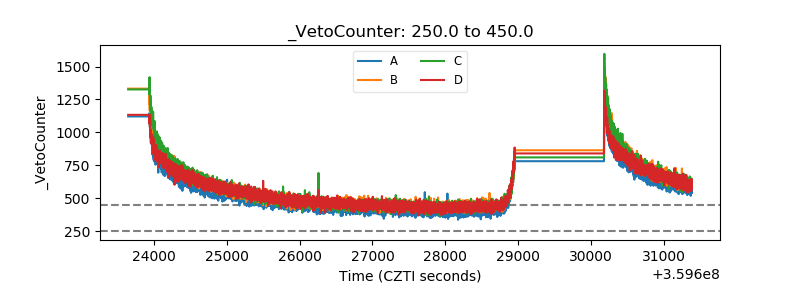 |