| Param | Original file | Final file |
|---|---|---|
| Filename | modeM0/AS1A10_103T02_9000004406_30585cztM0_level2.evt | modeM0/AS1A10_103T02_9000004406_30585cztM0_level2_quad_clean.evt |
| Size (bytes) | 629,501,760 | 79,554,240 |
| Size | 600.3 MB | 75.9 MB |
| Events in quadrant A | 4,191,657 | 504,882 |
| Events in quadrant B | 5,753,722 | 502,159 |
| Events in quadrant C | 4,145,615 | 466,534 |
| Events in quadrant D | 4,529,372 | 476,988 |
| Mode M9 | |||
|---|---|---|---|
| Quadrant | BADHDUFLAG | Total packets | Discarded packets |
| A | 0 | 20 | 0 |
| B | 0 | 21 | 0 |
| C | 0 | 21 | 0 |
| D | 0 | 21 | 0 |
| Mode SS | |||
|---|---|---|---|
| Quadrant | BADHDUFLAG | Total packets | Discarded packets |
| A | 0 | 132 | 0 |
| B | 0 | 132 | 0 |
| C | 0 | 132 | 0 |
| D | 0 | 132 | 0 |
| Mode M0 | |||
|---|---|---|---|
| Quadrant | BADHDUFLAG | Total packets | Discarded packets |
| A | 0 | 16733 | 2 |
| B | 0 | 21372 | 2 |
| C | 0 | 16746 | 2 |
| D | 0 | 18072 | 2 |
| Quadrant | Total seconds | Saturated seconds | Saturation percentage |
|---|---|---|---|
| A | 6575 | 236 | 3.589354% |
| B | 6575 | 269 | 4.091255% |
| C | 6574 | 376 | 5.719501% |
| D | 6574 | 298 | 4.533009% |
Noise dominated data is calculated using 1-second bins in cleaned event files. If a bin has >2000 counts, and if more than 50% of those come from <1% of pixels, then it is considered to be noise-dominated and hence unusable.
| Quadrant | # 1 sec bins | Bins with >0 counts | Bins with >2000 counts | High rate bins dominated by noise | Noise dominated (total time) | Noise dominated (detector-on time) | Marked lightcurve |
|---|---|---|---|---|---|---|---|
| A | 7905 | 6576 | 56 | 56 | 0.71% | 0.85% | 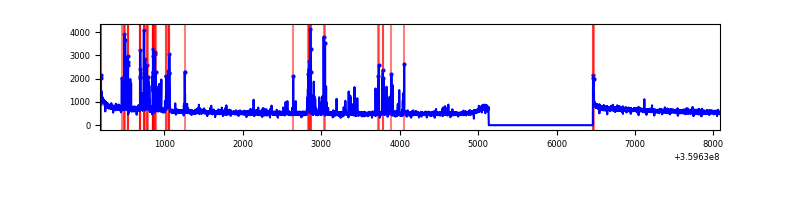 |
| B | 7905 | 6576 | 45 | 45 | 0.57% | 0.68% | 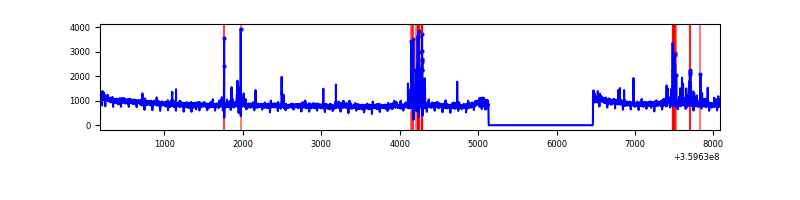 |
| C | 7904 | 6575 | 119 | 119 | 1.51% | 1.81% | 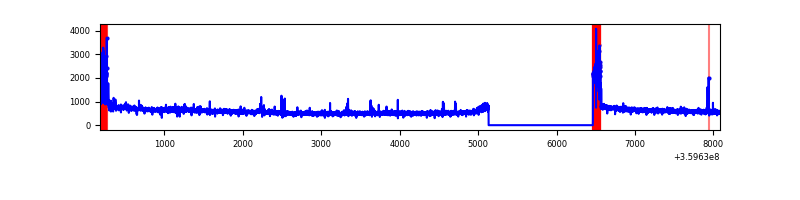 |
| D | 7904 | 6575 | 130 | 130 | 1.64% | 1.98% | 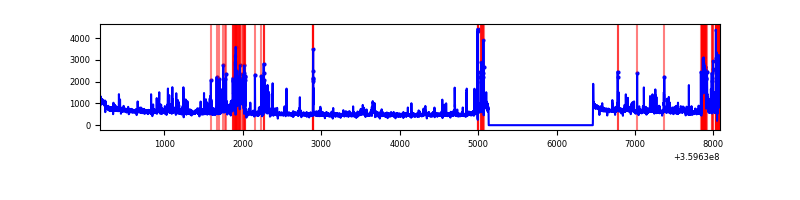 |
Top three noisy pixels from each quadrant. If the there are fewer than three noisy pixels in the level2.evt file, extra rows are filled as -1
| Pixel properties | Quadrant properties | ||||||
|---|---|---|---|---|---|---|---|
| Quadrant | DetID | PixID | Counts | Sigma | Mean | Median | Sigma |
| A | 0 | 13 | 420765 | 2232.38 | 970 | 956 | 188.1 |
| A | 8 | 192 | 25857 | 132.41 | 970 | 956 | 188.1 |
| A | 13 | 254 | 11800 | 57.66 | 970 | 956 | 188.1 |
| B | 6 | 159 | 1747675 | 10054.84 | 950 | 931 | 173.7 |
| B | 0 | 229 | 192986 | 1105.53 | 950 | 931 | 173.7 |
| B | 5 | 255 | 44431 | 250.4 | 950 | 931 | 173.7 |
| C | 0 | 10 | 342633 | 1692.57 | 893 | 902 | 201.9 |
| C | 14 | 238 | 165931 | 817.37 | 893 | 902 | 201.9 |
| C | 3 | 233 | 107599 | 528.46 | 893 | 902 | 201.9 |
| D | 13 | 249 | 376024 | 1761.92 | 927 | 907 | 212.9 |
| D | 1 | 52 | 307669 | 1440.86 | 927 | 907 | 212.9 |
| D | 8 | 195 | 115559 | 538.52 | 927 | 907 | 212.9 |
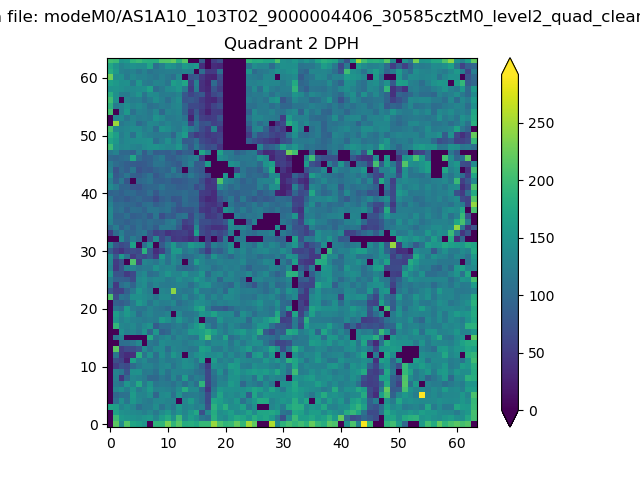
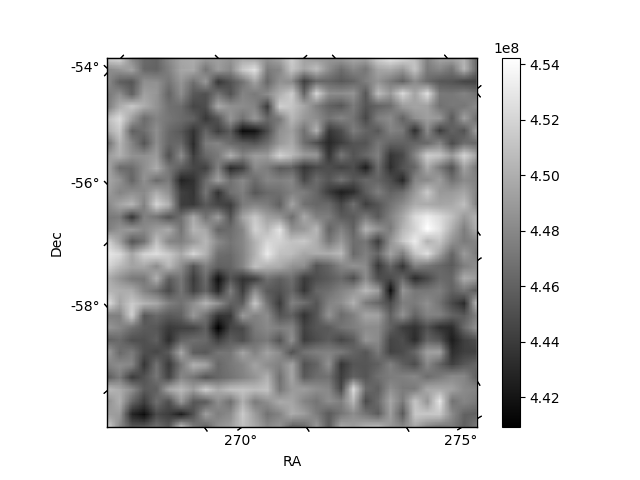
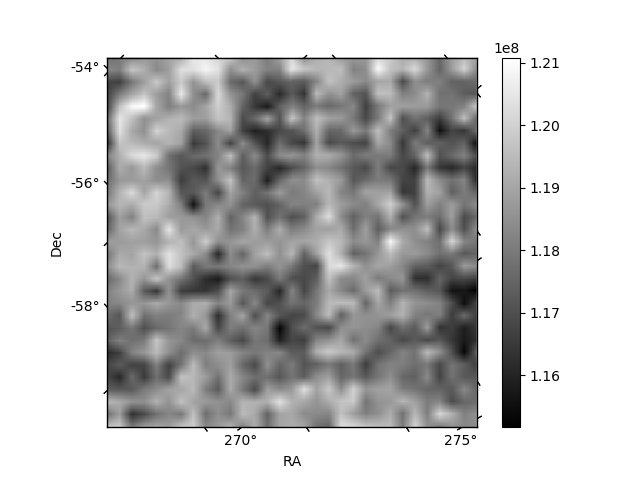
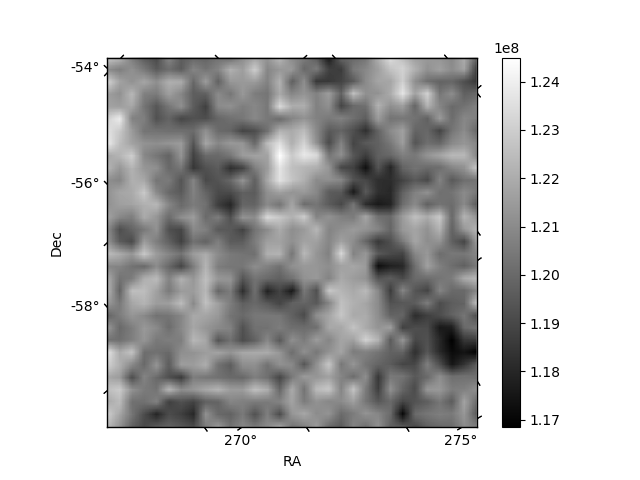
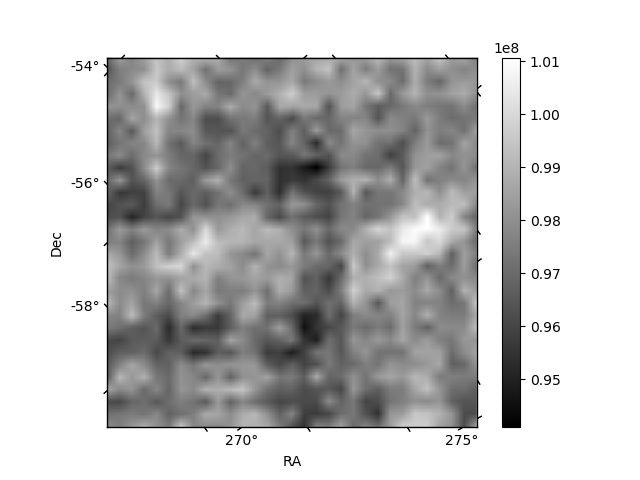
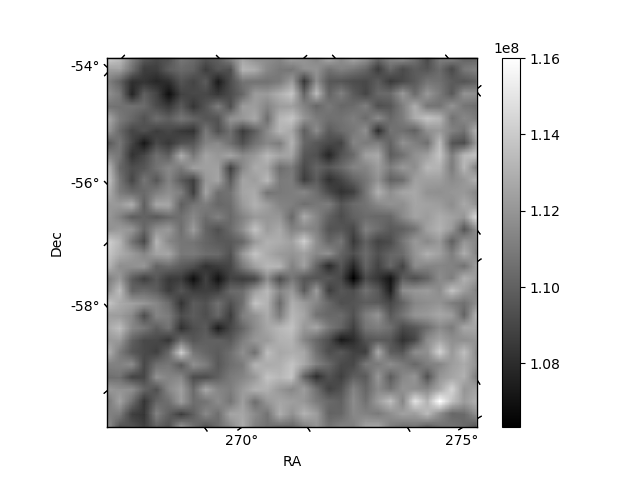
Histogram calculated using DETX and DETY for each event in the final _common_clean file
| Quadrant A | 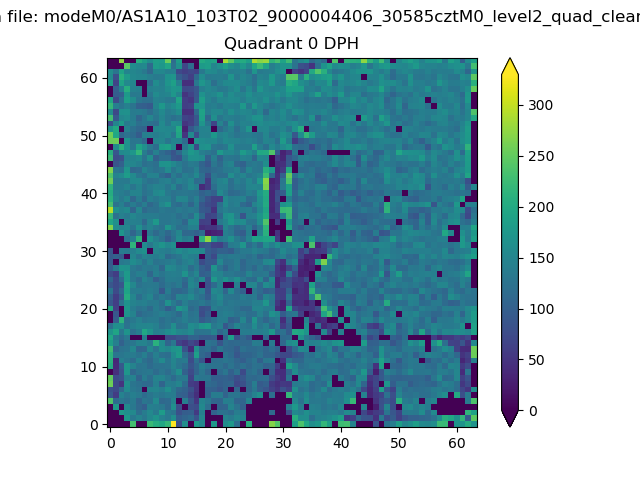 |
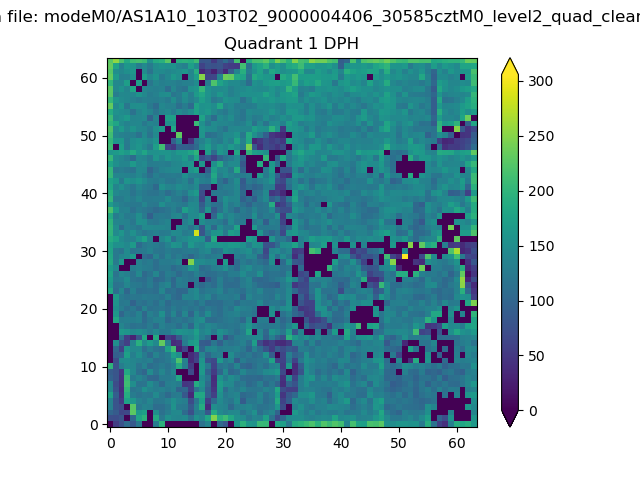 |
Quadrant B |
|---|---|---|---|
| Quadrant D | 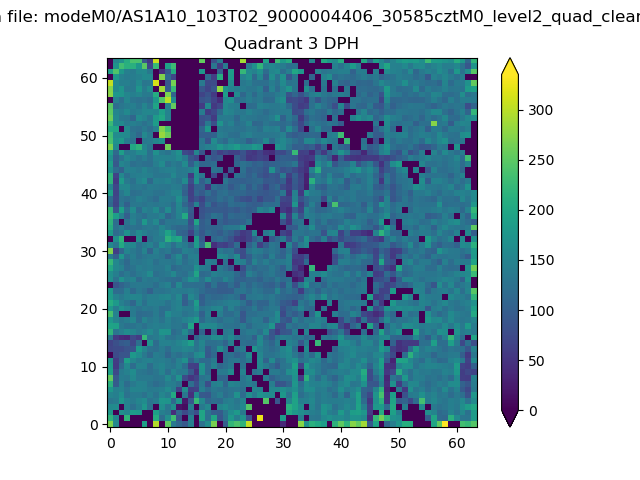 |
 |
Quadrant C |
| Plot type | Count rate plots | Images |
|---|---|---|
| Comparison with Poisson distribution Blue bars denote a histogram of data divided into 1 sec bins. Red curve is a Poisson curve with rate = median count rate of data. |
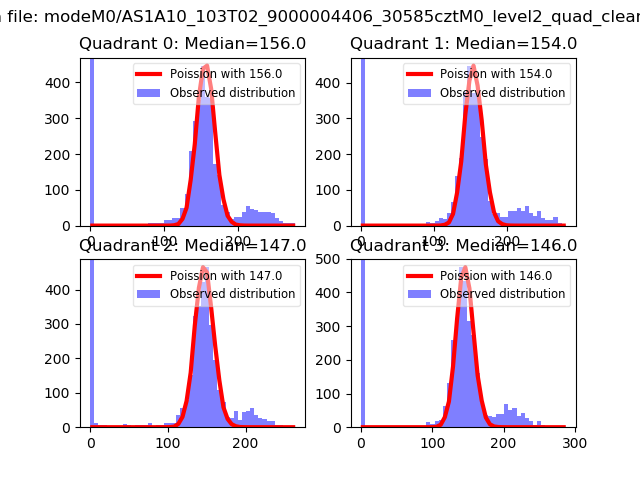 |
 |
| Quadrant-wise count rates Data is divided into 100 sec bins |
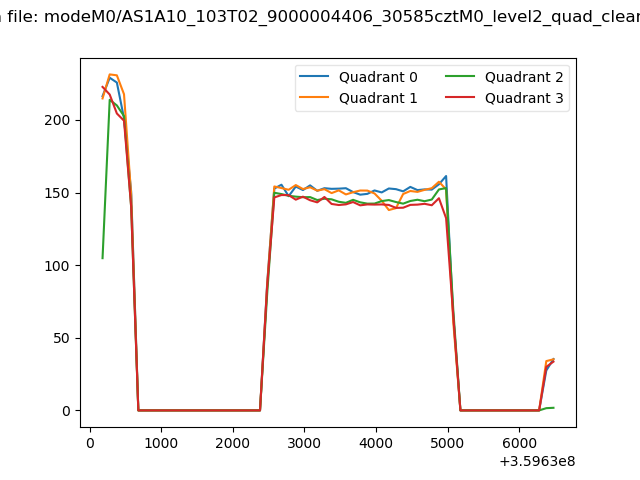 |
|
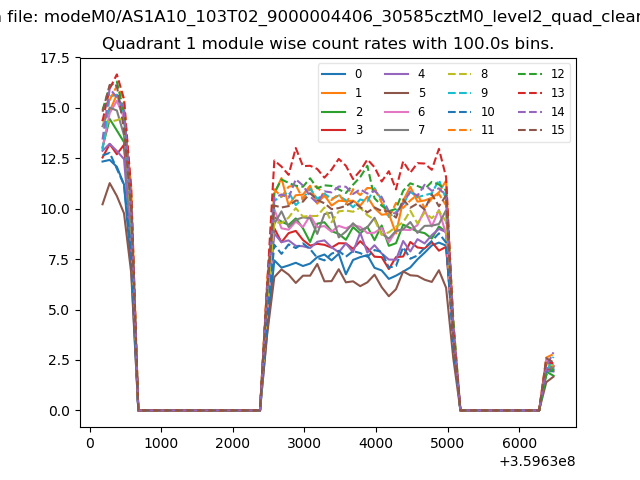
| Module-wise count rates for Quadrant A Data is divided into 100 sec bins |
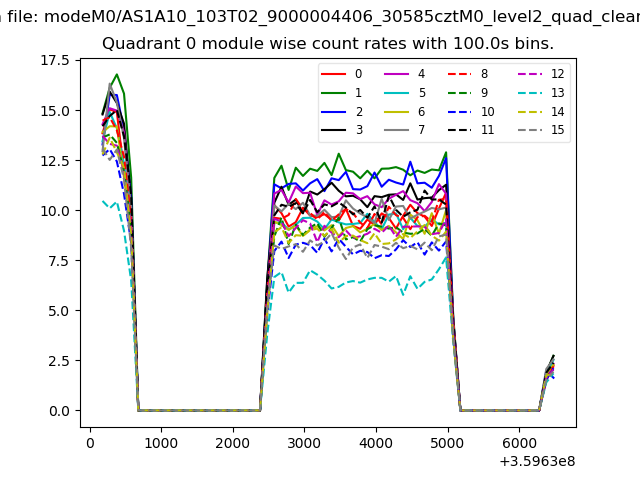 |
 |
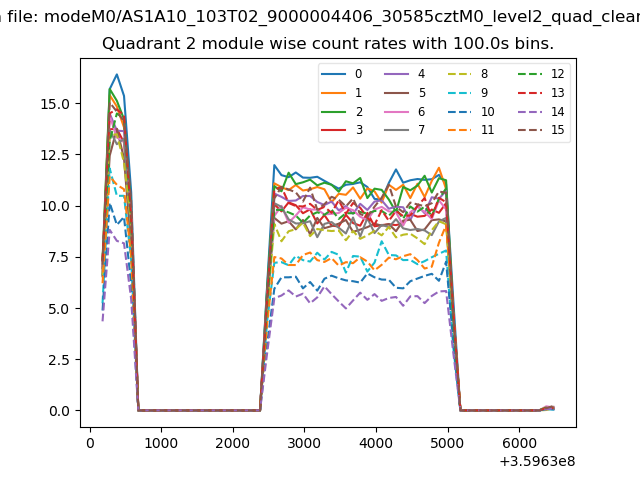
| Module-wise count rates for Quadrant B Data is divided into 100 sec bins |
 |
 |
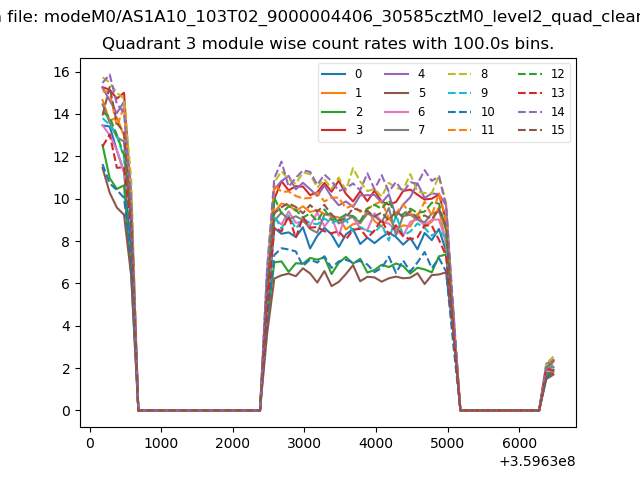
| Module-wise count rates for Quadrant C Data is divided into 100 sec bins |
 |
 |
| Module-wise count rates for Quadrant D Data is divided into 100 sec bins |
 |
 |
| Parameter | Plot |
|---|---|
| CZT HV Monitor | 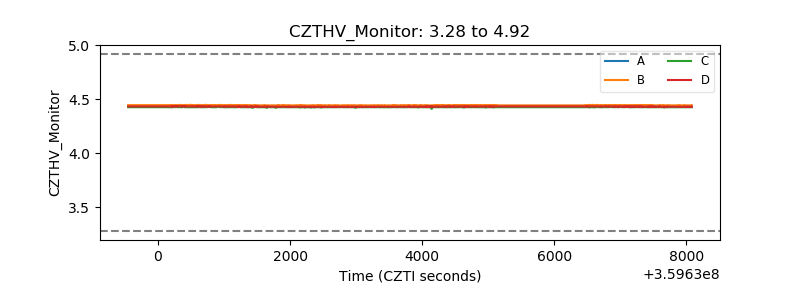 |
| D_VDD | 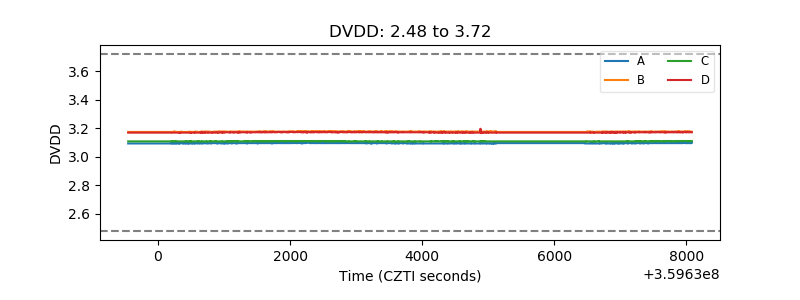 |
| Temperature 1 | 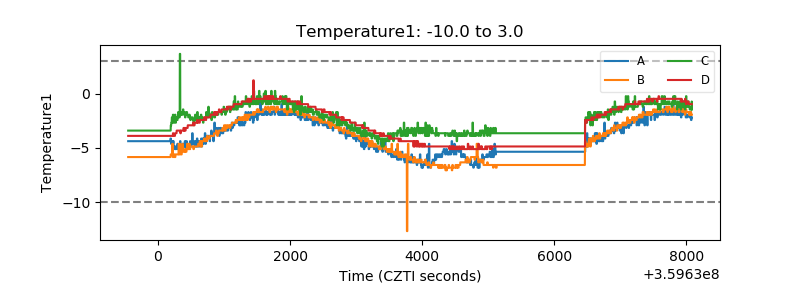 |
| Veto HV Monitor | 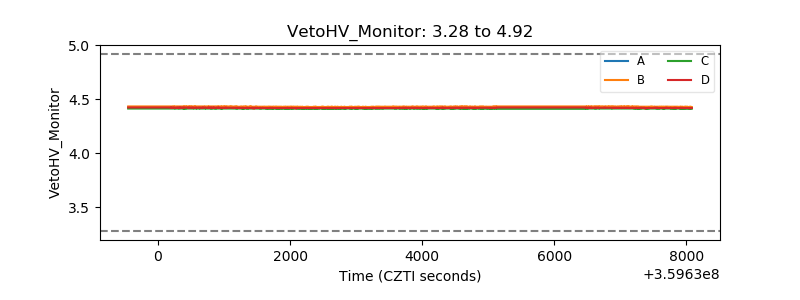 |
| Veto LLD |  |
| Alpha Counter | 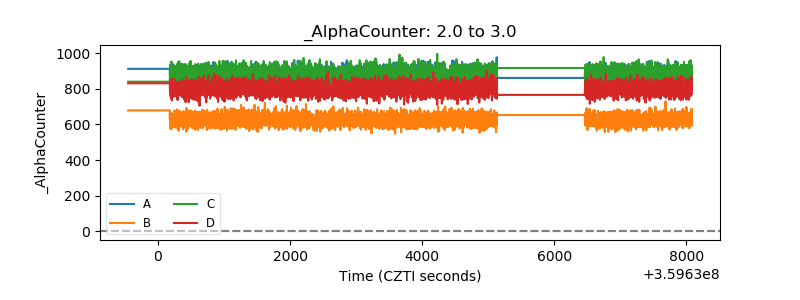 |
| _CPM_Rate | 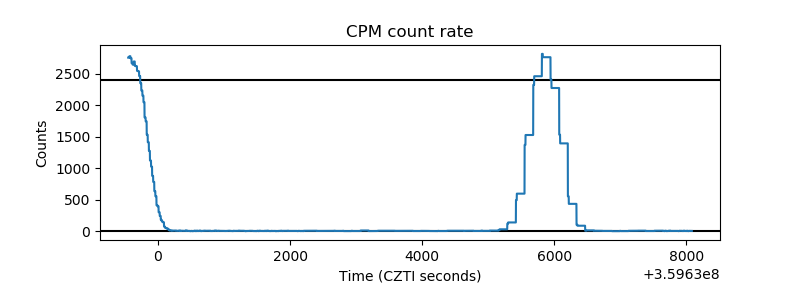 |
| CZT Counter | 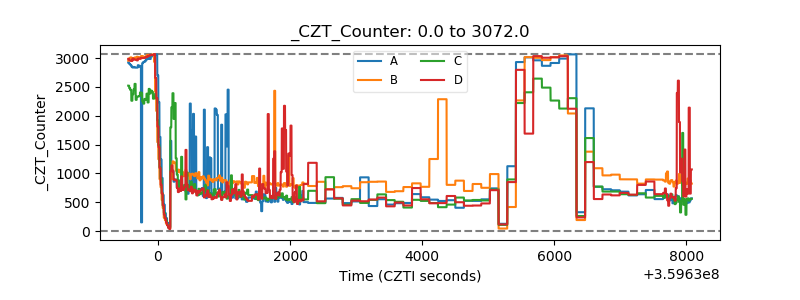 |
| +2.5 Volts monitor |  |
| +5 Volts monitor | 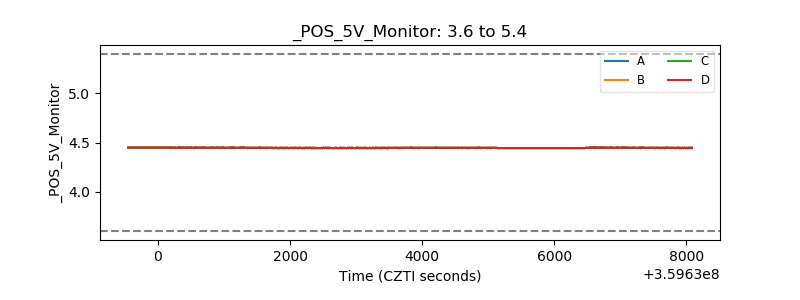 |
| _ROLL_ROT | 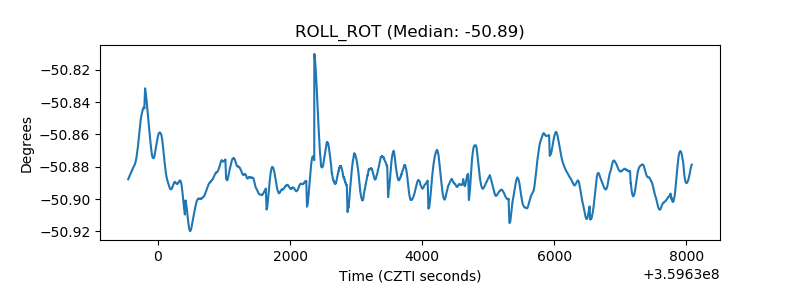 |
| _Roll_DEC | 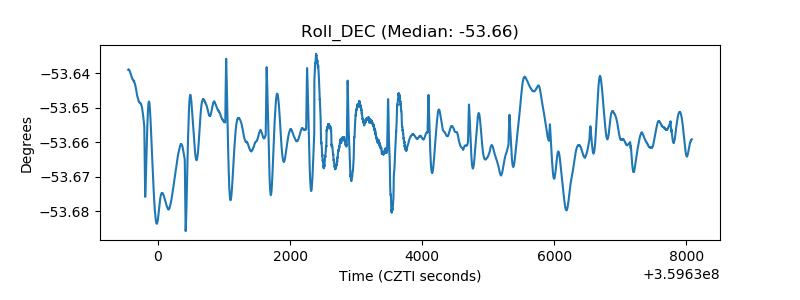 |
| _Roll_RA | 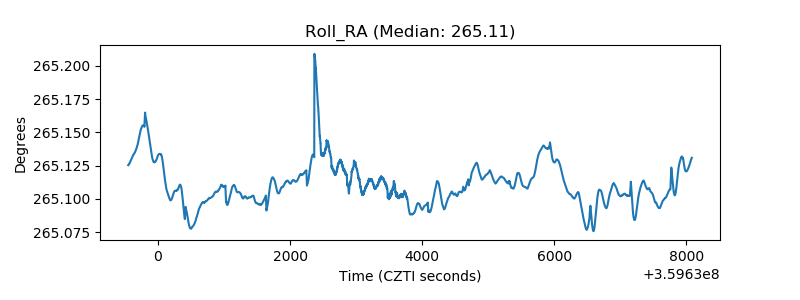 |
| Veto Counter | 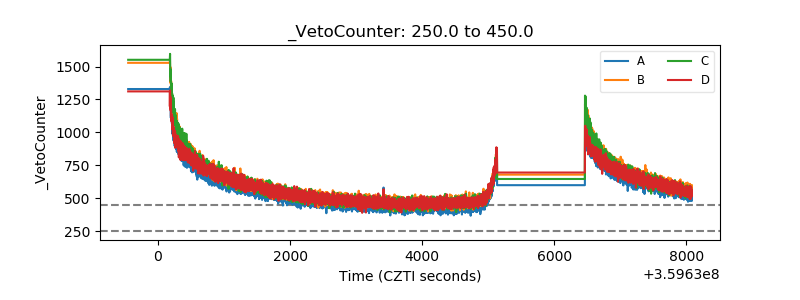 |