| Param | Original file | Final file |
|---|---|---|
| Filename | modeM0/AS1A10_103T02_9000004406_30586cztM0_level2.evt | modeM0/AS1A10_103T02_9000004406_30586cztM0_level2_quad_clean.evt |
| Size (bytes) | 594,840,960 | 78,166,080 |
| Size | 567.3 MB | 74.5 MB |
| Events in quadrant A | 3,671,614 | 496,549 |
| Events in quadrant B | 5,594,676 | 489,904 |
| Events in quadrant C | 3,907,840 | 467,625 |
| Events in quadrant D | 4,402,101 | 460,526 |
| Mode M9 | |||
|---|---|---|---|
| Quadrant | BADHDUFLAG | Total packets | Discarded packets |
| A | 0 | 13 | 0 |
| B | 0 | 13 | 0 |
| C | 0 | 13 | 0 |
| D | 0 | 13 | 0 |
| Mode SS | |||
|---|---|---|---|
| Quadrant | BADHDUFLAG | Total packets | Discarded packets |
| A | 0 | 132 | 0 |
| B | 0 | 132 | 0 |
| C | 0 | 132 | 0 |
| D | 0 | 132 | 0 |
| Mode M0 | |||
|---|---|---|---|
| Quadrant | BADHDUFLAG | Total packets | Discarded packets |
| A | 0 | 15075 | 1 |
| B | 0 | 20684 | 1 |
| C | 0 | 15842 | 1 |
| D | 0 | 17536 | 1 |
| Quadrant | Total seconds | Saturated seconds | Saturation percentage |
|---|---|---|---|
| A | 6482 | 151 | 2.329528% |
| B | 6483 | 279 | 4.303563% |
| C | 6483 | 372 | 5.738084% |
| D | 6482 | 261 | 4.026535% |
Noise dominated data is calculated using 1-second bins in cleaned event files. If a bin has >2000 counts, and if more than 50% of those come from <1% of pixels, then it is considered to be noise-dominated and hence unusable.
| Quadrant | # 1 sec bins | Bins with >0 counts | Bins with >2000 counts | High rate bins dominated by noise | Noise dominated (total time) | Noise dominated (detector-on time) | Marked lightcurve |
|---|---|---|---|---|---|---|---|
| A | 7767 | 6483 | 2 | 2 | 0.03% | 0.03% | 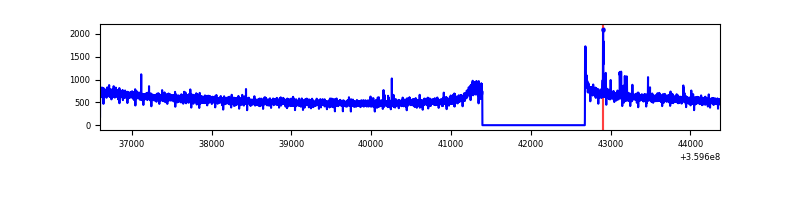 |
| B | 7768 | 6484 | 32 | 32 | 0.41% | 0.49% | 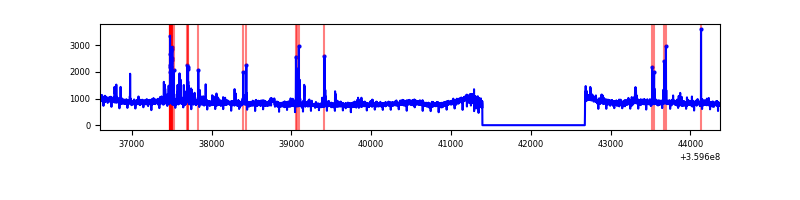 |
| C | 7768 | 6484 | 62 | 62 | 0.80% | 0.96% | 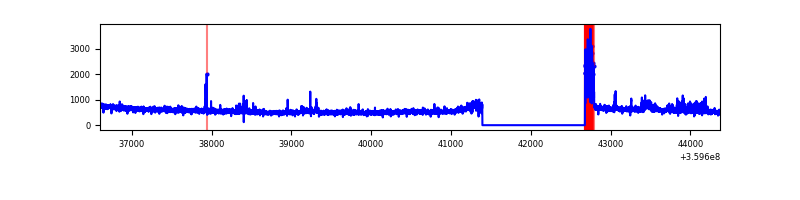 |
| D | 7767 | 6483 | 112 | 112 | 1.44% | 1.73% | 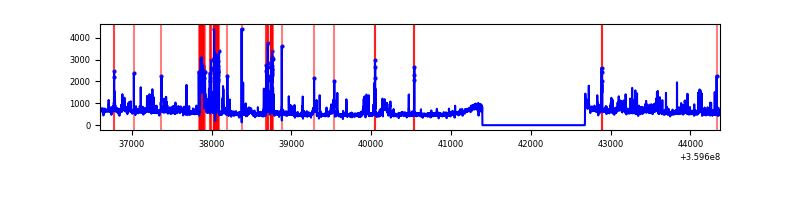 |
Top three noisy pixels from each quadrant. If the there are fewer than three noisy pixels in the level2.evt file, extra rows are filled as -1
| Pixel properties | Quadrant properties | ||||||
|---|---|---|---|---|---|---|---|
| Quadrant | DetID | PixID | Counts | Sigma | Mean | Median | Sigma |
| A | 12 | 96 | 27525 | 145.6 | 942 | 925 | 182.7 |
| A | 13 | 254 | 12074 | 61.03 | 942 | 925 | 182.7 |
| A | 8 | 192 | 10717 | 53.6 | 942 | 925 | 182.7 |
| B | 6 | 159 | 1744278 | 10353.92 | 921 | 900 | 168.4 |
| B | 0 | 229 | 140578 | 829.55 | 921 | 900 | 168.4 |
| B | 5 | 255 | 44174 | 257.0 | 921 | 900 | 168.4 |
| C | 14 | 238 | 185414 | 936.05 | 870 | 879 | 197.1 |
| C | 0 | 10 | 179618 | 906.65 | 870 | 879 | 197.1 |
| C | 14 | 254 | 53851 | 268.7 | 870 | 879 | 197.1 |
| D | 13 | 249 | 418836 | 2008.82 | 897 | 876 | 208.1 |
| D | 13 | 104 | 253443 | 1213.9 | 897 | 876 | 208.1 |
| D | 8 | 195 | 121032 | 577.5 | 897 | 876 | 208.1 |
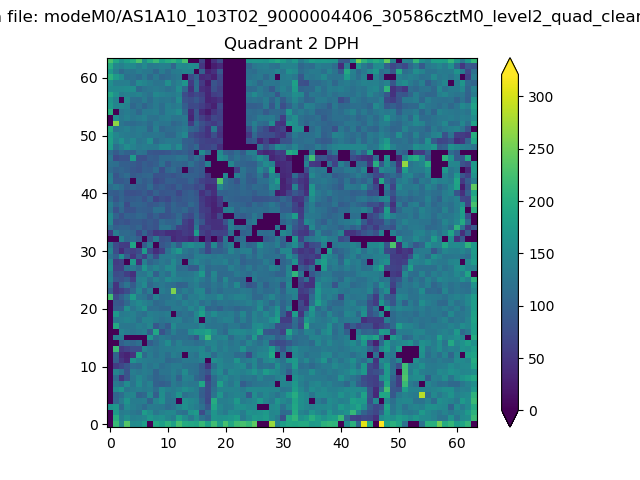
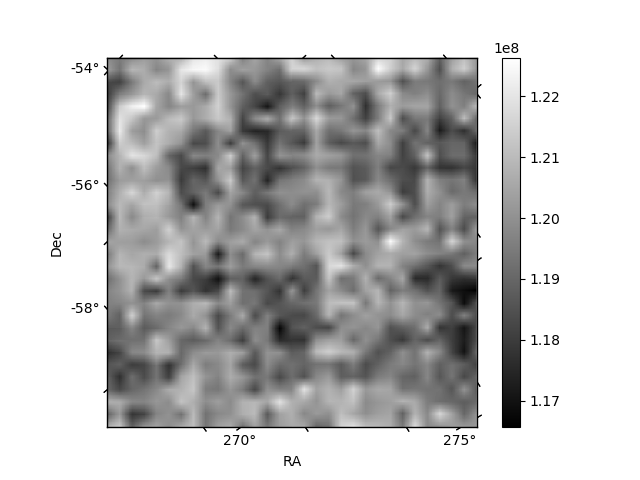
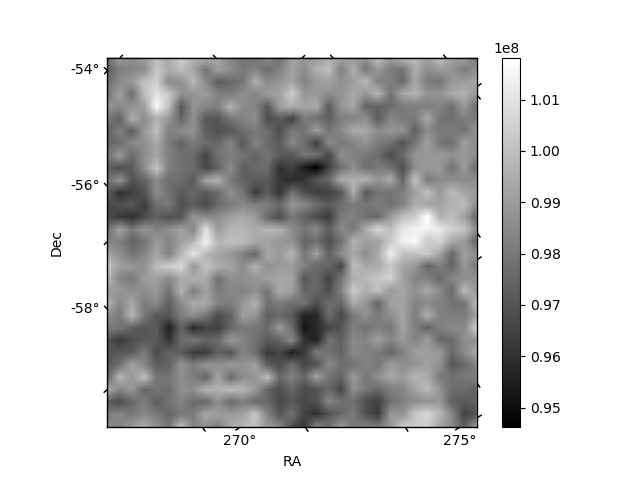
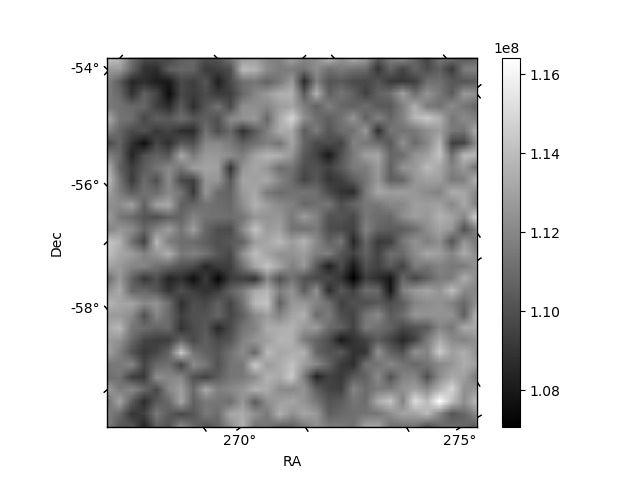
Histogram calculated using DETX and DETY for each event in the final _common_clean file
| Quadrant A | 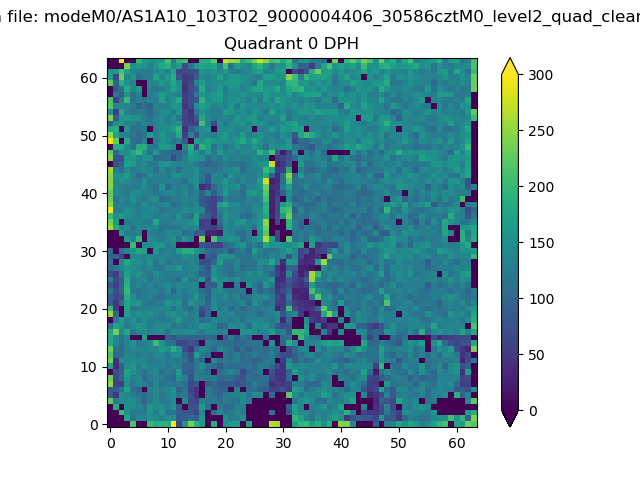 |
 |
Quadrant B |
|---|---|---|---|
| Quadrant D |  |
 |
Quadrant C |
| Plot type | Count rate plots | Images |
|---|---|---|
| Comparison with Poisson distribution Blue bars denote a histogram of data divided into 1 sec bins. Red curve is a Poisson curve with rate = median count rate of data. |
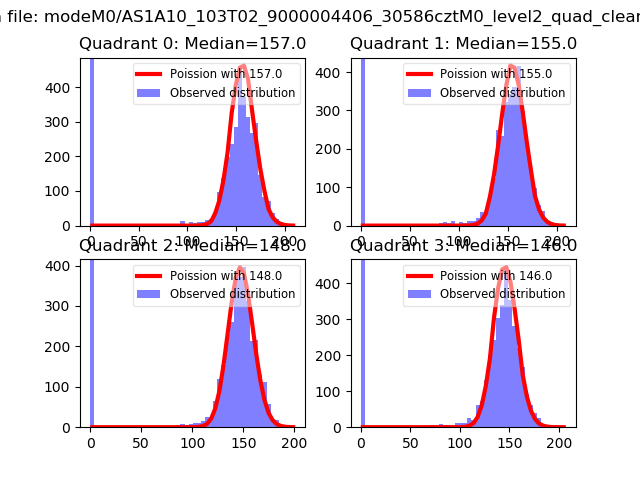 |
 |
| Quadrant-wise count rates Data is divided into 100 sec bins |
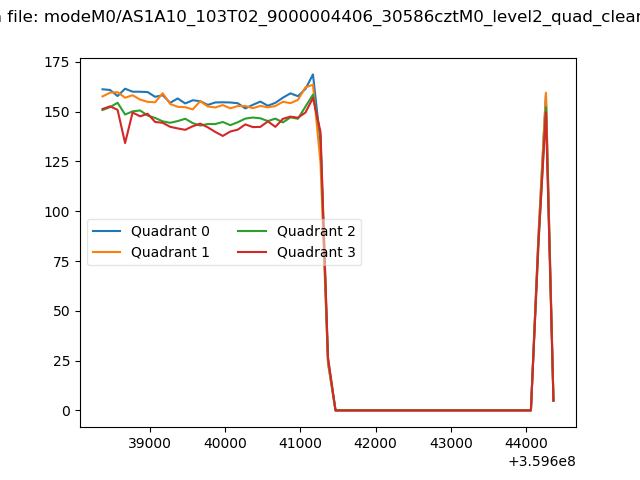 |
|
| Module-wise count rates for Quadrant A Data is divided into 100 sec bins |
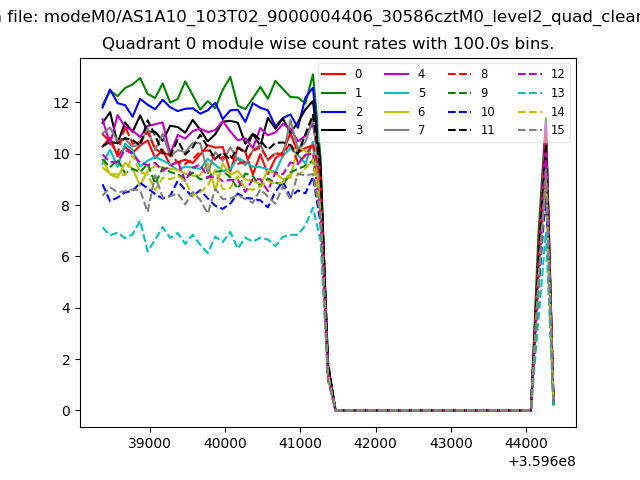 |
 |
| Module-wise count rates for Quadrant B Data is divided into 100 sec bins |
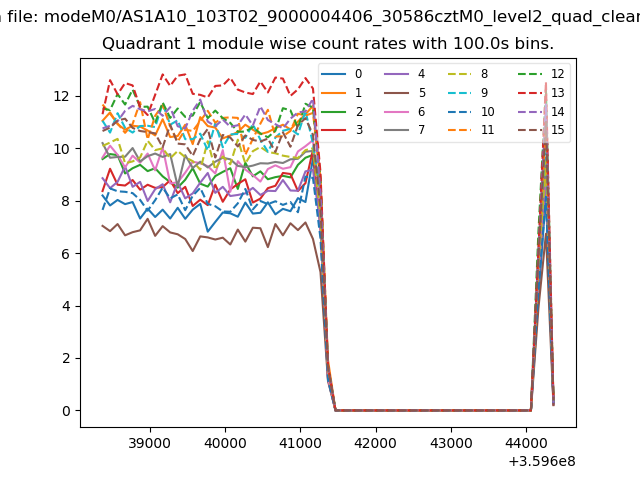 |
 |
| Module-wise count rates for Quadrant C Data is divided into 100 sec bins |
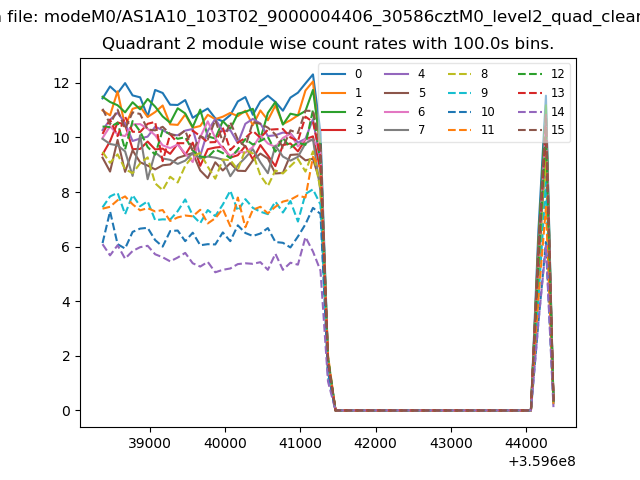 |
 |
| Module-wise count rates for Quadrant D Data is divided into 100 sec bins |
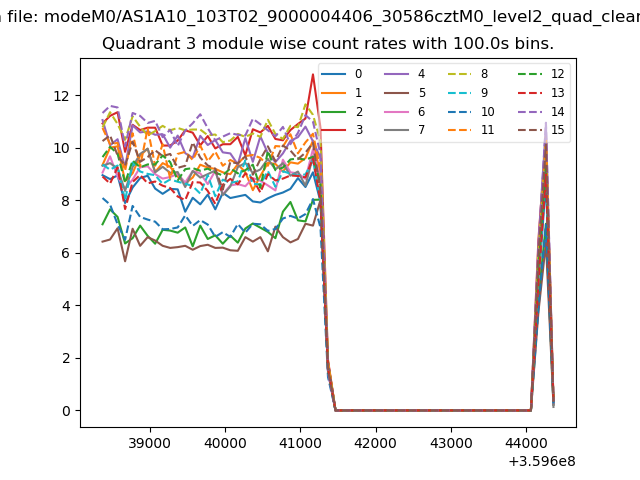 |
 |
| Parameter | Plot |
|---|---|
| CZT HV Monitor |  |
| D_VDD | 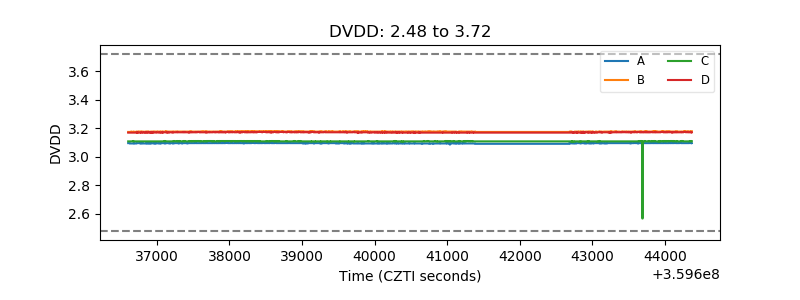 |
| Temperature 1 |  |
| Veto HV Monitor | 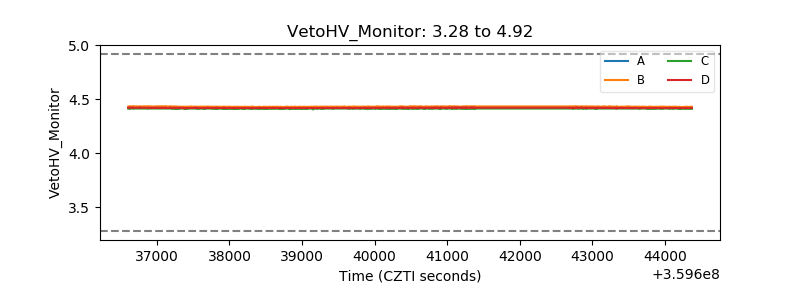 |
| Veto LLD | 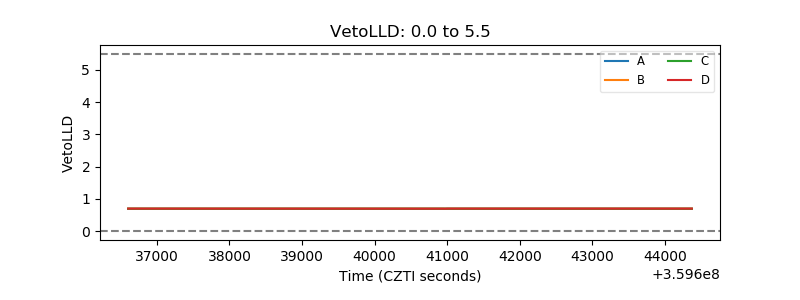 |
| Alpha Counter | 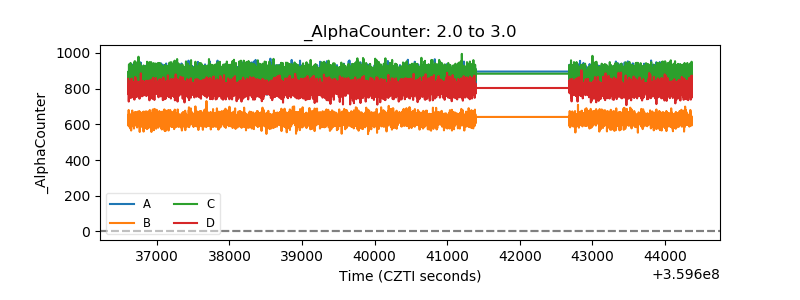 |
| _CPM_Rate | 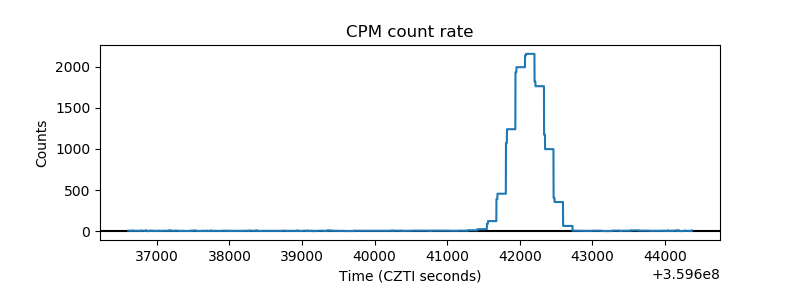 |
| CZT Counter | 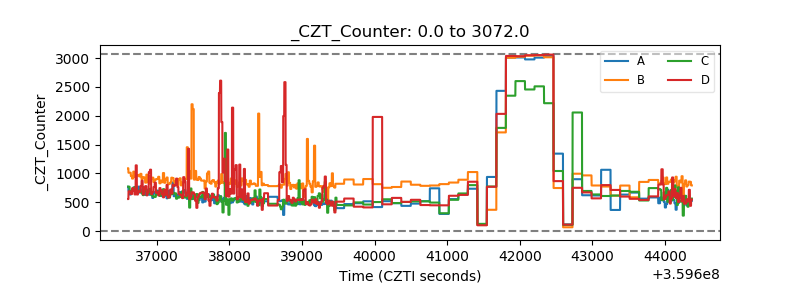 |
| +2.5 Volts monitor |  |
| +5 Volts monitor | 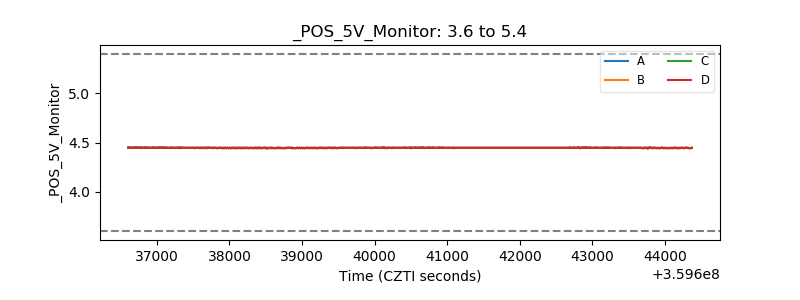 |
| _ROLL_ROT | 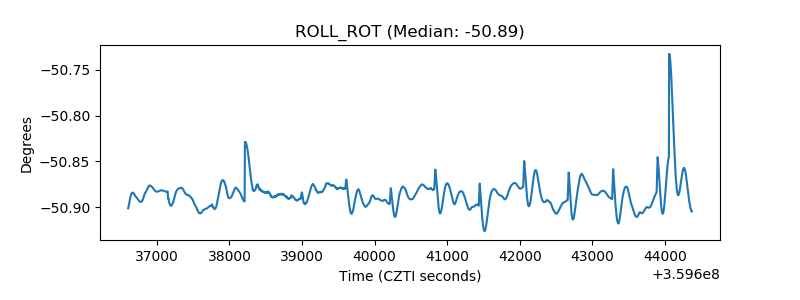 |
| _Roll_DEC | 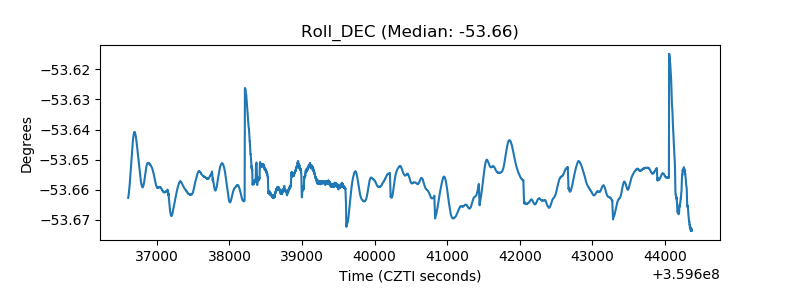 |
| _Roll_RA | 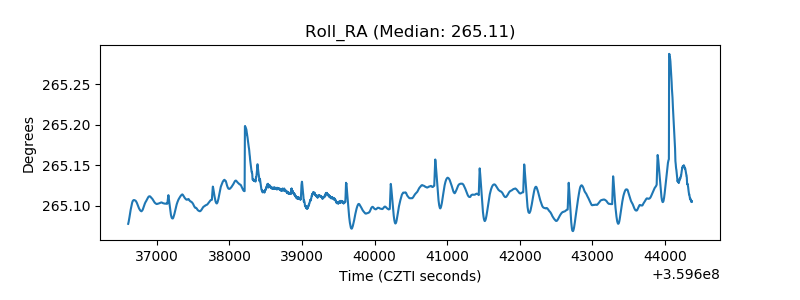 |
| Veto Counter | 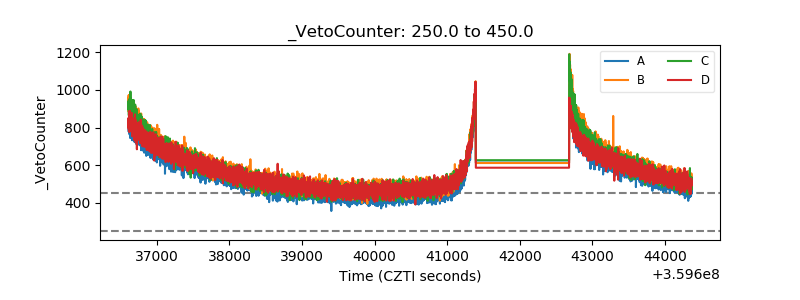 |