| Param | Original file | Final file |
|---|---|---|
| Filename | modeM0/AS1A10_103T02_9000004406_30587cztM0_level2.evt | modeM0/AS1A10_103T02_9000004406_30587cztM0_level2_quad_clean.evt |
| Size (bytes) | 556,058,880 | 90,120,960 |
| Size | 530.3 MB | 85.9 MB |
| Events in quadrant A | 3,252,075 | 598,874 |
| Events in quadrant B | 5,204,296 | 593,304 |
| Events in quadrant C | 3,524,762 | 560,072 |
| Events in quadrant D | 4,446,867 | 551,440 |
| Mode M9 | |||
|---|---|---|---|
| Quadrant | BADHDUFLAG | Total packets | Discarded packets |
| A | 0 | 12 | 0 |
| B | 0 | 12 | 0 |
| C | 0 | 12 | 0 |
| D | 0 | 12 | 0 |
| Mode SS | |||
|---|---|---|---|
| Quadrant | BADHDUFLAG | Total packets | Discarded packets |
| A | 0 | 124 | 0 |
| B | 0 | 124 | 0 |
| C | 0 | 124 | 0 |
| D | 0 | 124 | 0 |
| Mode M0 | |||
|---|---|---|---|
| Quadrant | BADHDUFLAG | Total packets | Discarded packets |
| A | 0 | 13294 | 1 |
| B | 0 | 19383 | 1 |
| C | 0 | 14194 | 1 |
| D | 0 | 17472 | 1 |
| Quadrant | Total seconds | Saturated seconds | Saturation percentage |
|---|---|---|---|
| A | 6091 | 117 | 1.920867% |
| B | 6092 | 287 | 4.711097% |
| C | 6092 | 359 | 5.892974% |
| D | 6092 | 132 | 2.166776% |
Noise dominated data is calculated using 1-second bins in cleaned event files. If a bin has >2000 counts, and if more than 50% of those come from <1% of pixels, then it is considered to be noise-dominated and hence unusable.
| Quadrant | # 1 sec bins | Bins with >0 counts | Bins with >2000 counts | High rate bins dominated by noise | Noise dominated (total time) | Noise dominated (detector-on time) | Marked lightcurve |
|---|---|---|---|---|---|---|---|
| A | 7326 | 6092 | 0 | 0 | 0.00% | 0.00% | 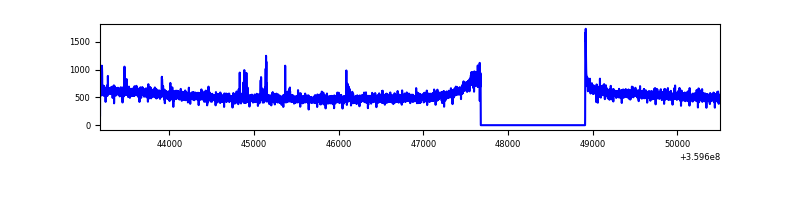 |
| B | 7327 | 6093 | 44 | 44 | 0.60% | 0.72% | 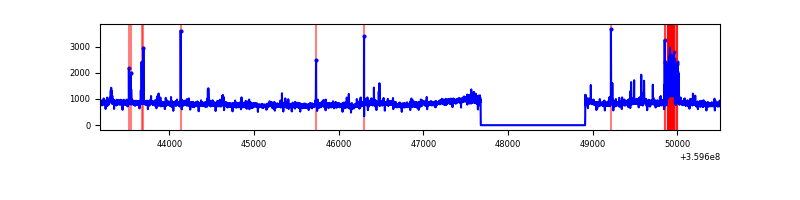 |
| C | 7327 | 6093 | 73 | 73 | 1.00% | 1.20% | 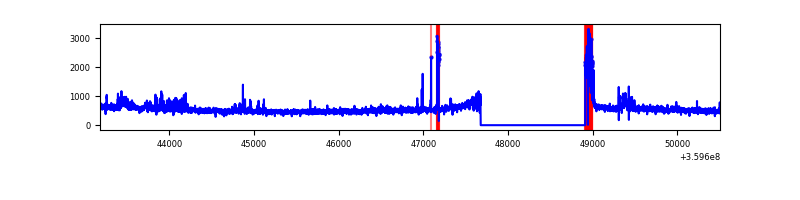 |
| D | 7327 | 6093 | 21 | 21 | 0.29% | 0.34% | 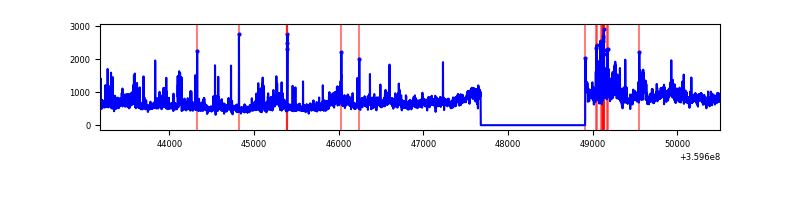 |
Top three noisy pixels from each quadrant. If the there are fewer than three noisy pixels in the level2.evt file, extra rows are filled as -1
| Pixel properties | Quadrant properties | ||||||
|---|---|---|---|---|---|---|---|
| Quadrant | DetID | PixID | Counts | Sigma | Mean | Median | Sigma |
| A | 12 | 96 | 24893 | 147.57 | 833 | 819 | 163.1 |
| A | 13 | 254 | 11503 | 65.49 | 833 | 819 | 163.1 |
| A | 8 | 192 | 11441 | 65.11 | 833 | 819 | 163.1 |
| B | 6 | 159 | 1682395 | 11259.27 | 813 | 796 | 149.4 |
| B | 5 | 255 | 172122 | 1147.13 | 813 | 796 | 149.4 |
| B | 0 | 229 | 116152 | 772.37 | 813 | 796 | 149.4 |
| C | 14 | 238 | 173903 | 984.94 | 768 | 774 | 175.8 |
| C | 0 | 10 | 173047 | 980.07 | 768 | 774 | 175.8 |
| C | 15 | 208 | 63795 | 358.53 | 768 | 774 | 175.8 |
| D | 8 | 195 | 906265 | 4938.69 | 791 | 773 | 183.3 |
| D | 5 | 222 | 202898 | 1102.42 | 791 | 773 | 183.3 |
| D | 13 | 104 | 176631 | 959.16 | 791 | 773 | 183.3 |
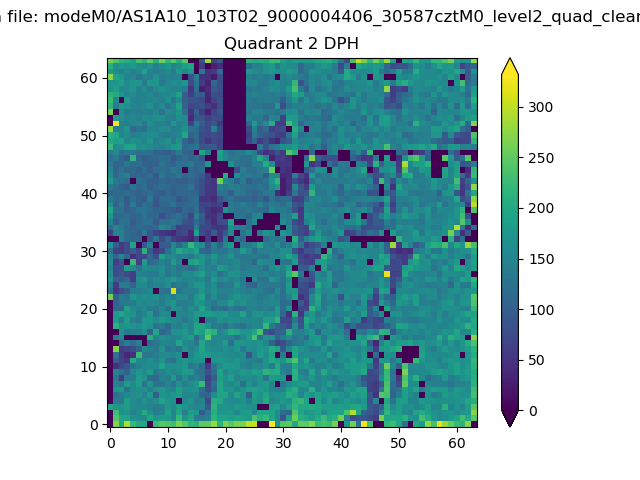
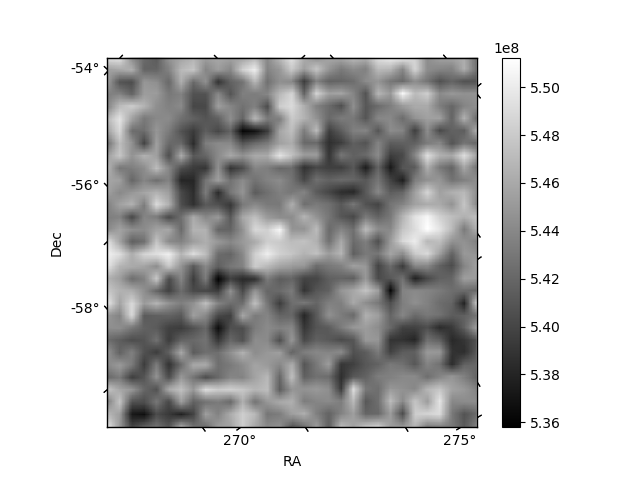
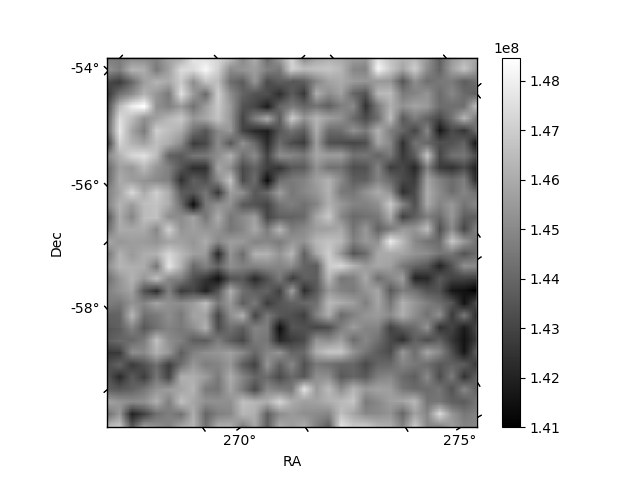
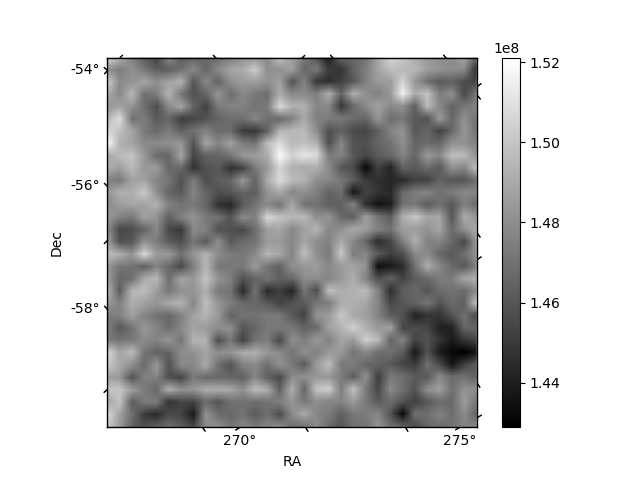
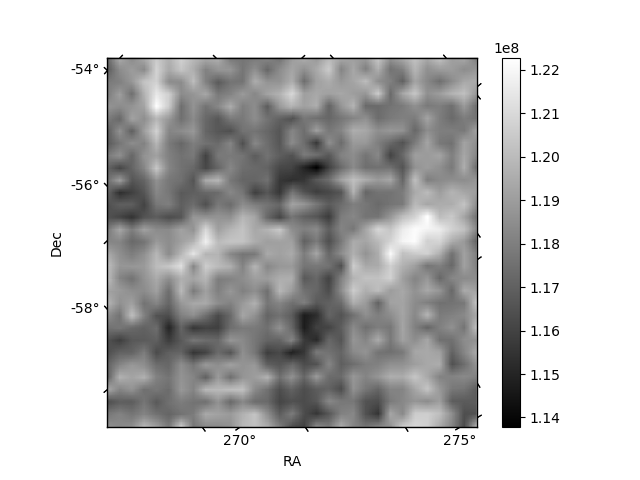
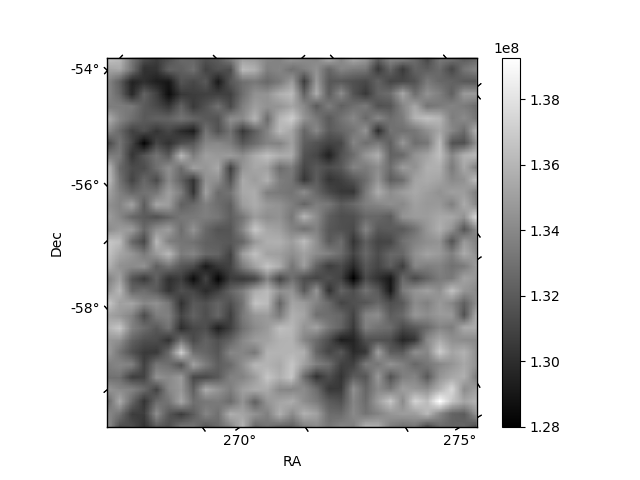
Histogram calculated using DETX and DETY for each event in the final _common_clean file
| Quadrant A | 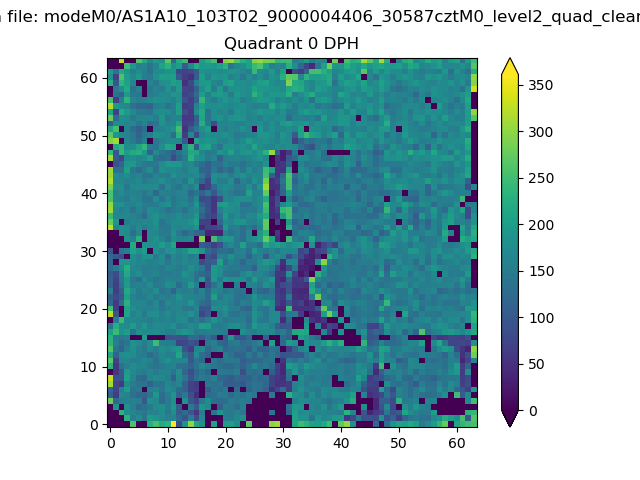 |
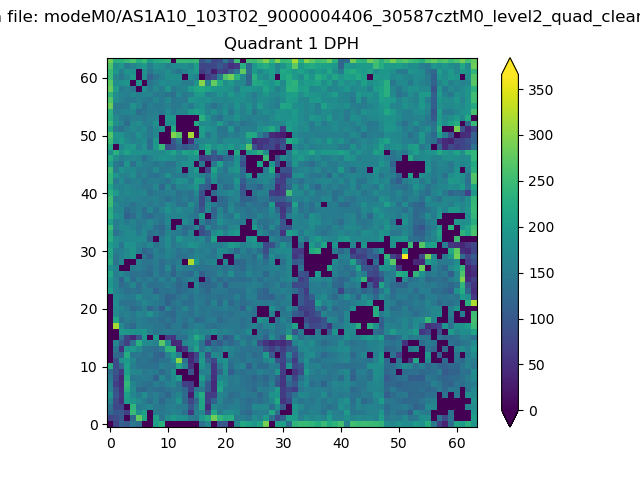 |
Quadrant B |
|---|---|---|---|
| Quadrant D | 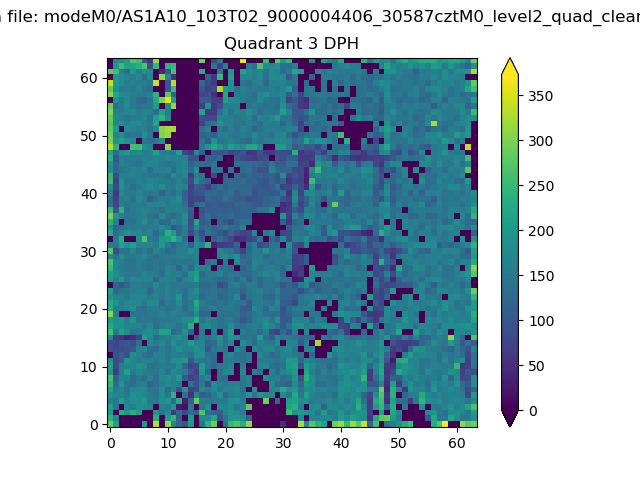 |
 |
Quadrant C |
| Plot type | Count rate plots | Images |
|---|---|---|
| Comparison with Poisson distribution Blue bars denote a histogram of data divided into 1 sec bins. Red curve is a Poisson curve with rate = median count rate of data. |
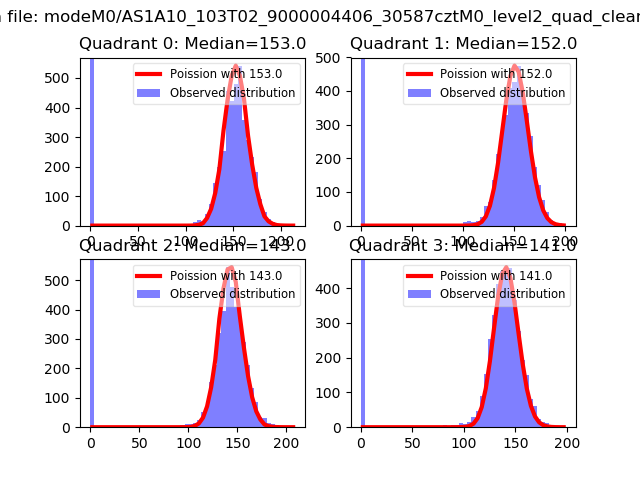 |
 |
| Quadrant-wise count rates Data is divided into 100 sec bins |
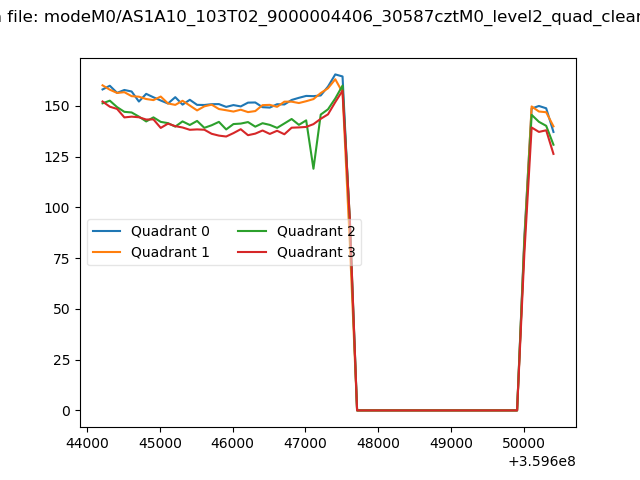 |
|
| Module-wise count rates for Quadrant A Data is divided into 100 sec bins |
 |
 |
| Module-wise count rates for Quadrant B Data is divided into 100 sec bins |
 |
 |
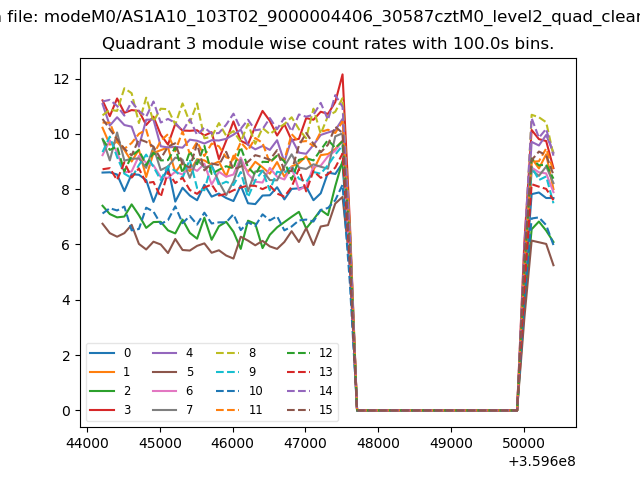
| Module-wise count rates for Quadrant C Data is divided into 100 sec bins |
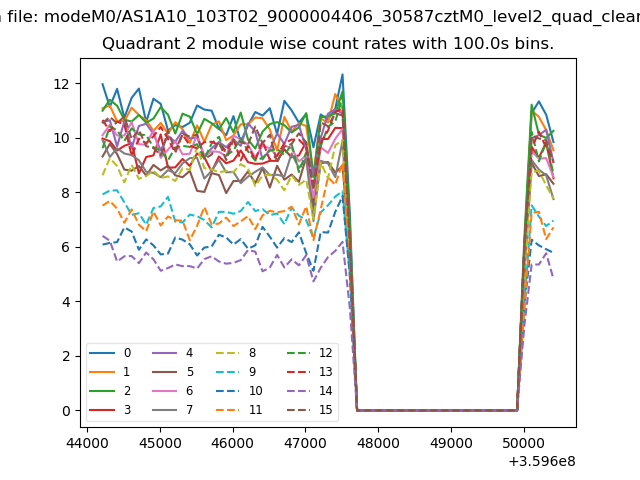 |
 |
| Module-wise count rates for Quadrant D Data is divided into 100 sec bins |
 |
 |
| Parameter | Plot |
|---|---|
| CZT HV Monitor | 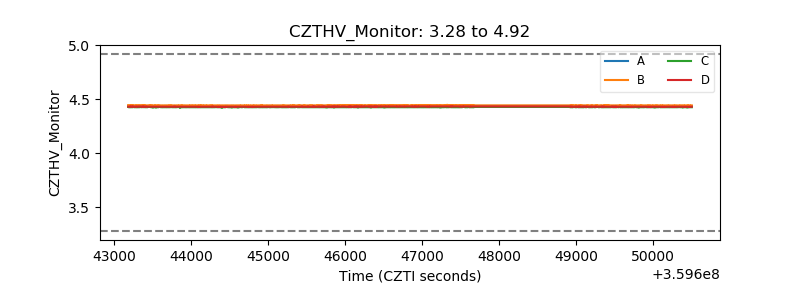 |
| D_VDD | 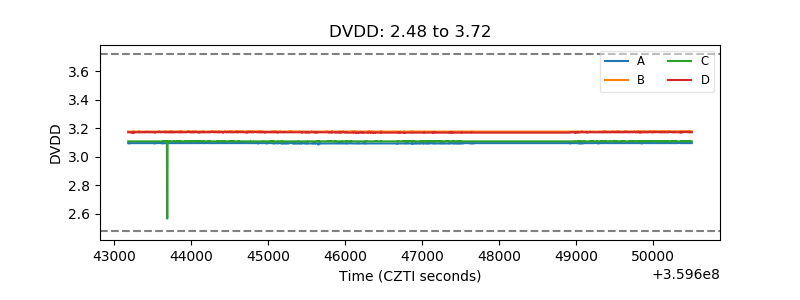 |
| Temperature 1 |  |
| Veto HV Monitor | 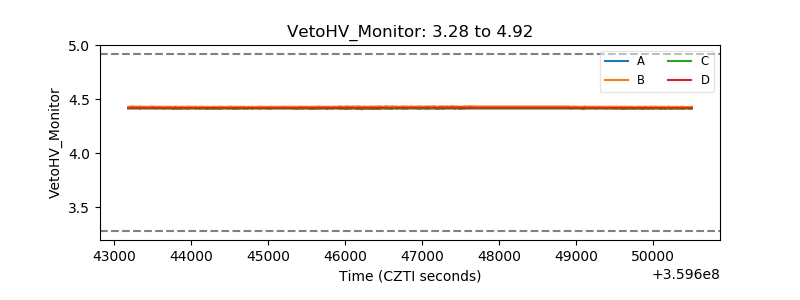 |
| Veto LLD |  |
| Alpha Counter | 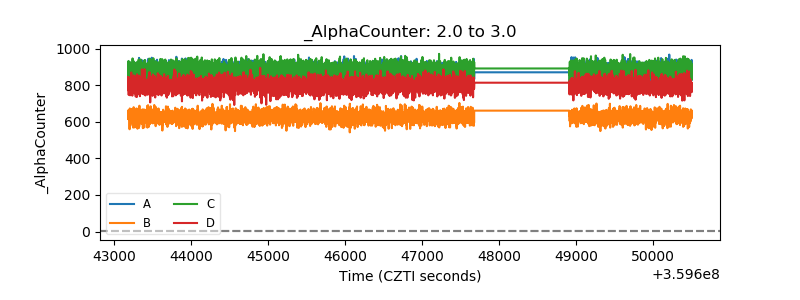 |
| _CPM_Rate | 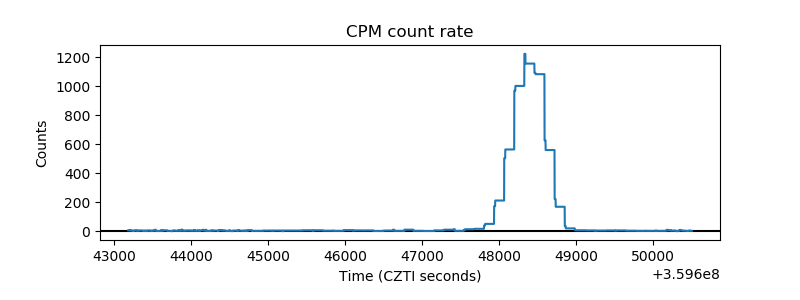 |
| CZT Counter | 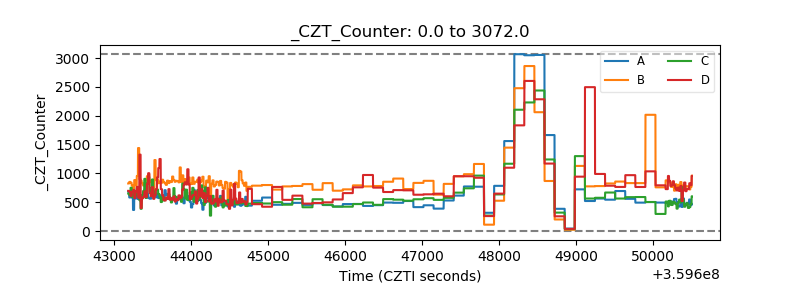 |
| +2.5 Volts monitor |  |
| +5 Volts monitor |  |
| _ROLL_ROT |  |
| _Roll_DEC |  |
| _Roll_RA | 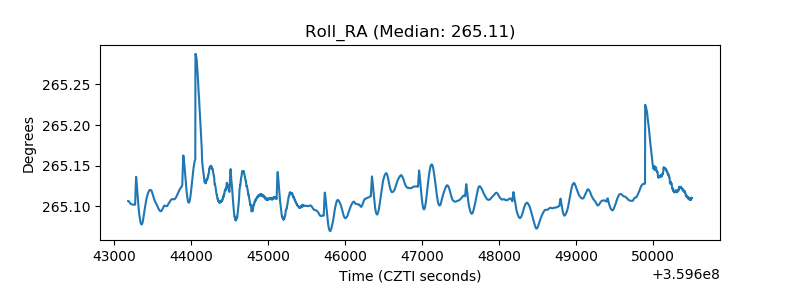 |
| Veto Counter | 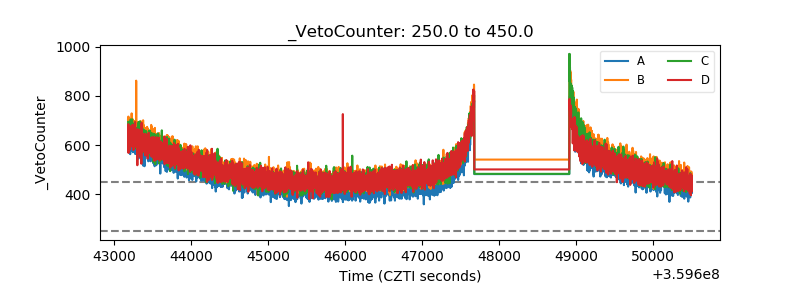 |