| Param | Original file | Final file |
|---|---|---|
| Filename | modeM0/AS1A10_103T02_9000004406_30588cztM0_level2.evt | modeM0/AS1A10_103T02_9000004406_30588cztM0_level2_quad_clean.evt |
| Size (bytes) | 668,747,520 | 101,597,760 |
| Size | 637.8 MB | 96.9 MB |
| Events in quadrant A | 3,443,009 | 680,469 |
| Events in quadrant B | 5,654,592 | 674,108 |
| Events in quadrant C | 3,784,265 | 639,290 |
| Events in quadrant D | 6,912,779 | 609,638 |
| Mode M9 | |||
|---|---|---|---|
| Quadrant | BADHDUFLAG | Total packets | Discarded packets |
| A | 0 | 17 | 0 |
| B | 0 | 18 | 0 |
| C | 0 | 18 | 0 |
| D | 0 | 18 | 0 |
| Mode SS | |||
|---|---|---|---|
| Quadrant | BADHDUFLAG | Total packets | Discarded packets |
| A | 0 | 140 | 0 |
| B | 0 | 140 | 0 |
| C | 0 | 140 | 0 |
| D | 0 | 140 | 0 |
| Mode M0 | |||
|---|---|---|---|
| Quadrant | BADHDUFLAG | Total packets | Discarded packets |
| A | 0 | 14373 | 2 |
| B | 0 | 21376 | 2 |
| C | 0 | 15357 | 2 |
| D | 0 | 25473 | 2 |
| Quadrant | Total seconds | Saturated seconds | Saturation percentage |
|---|---|---|---|
| A | 6783 | 92 | 1.356332% |
| B | 6783 | 257 | 3.788884% |
| C | 6783 | 360 | 5.307386% |
| D | 6783 | 325 | 4.791390% |
Noise dominated data is calculated using 1-second bins in cleaned event files. If a bin has >2000 counts, and if more than 50% of those come from <1% of pixels, then it is considered to be noise-dominated and hence unusable.
| Quadrant | # 1 sec bins | Bins with >0 counts | Bins with >2000 counts | High rate bins dominated by noise | Noise dominated (total time) | Noise dominated (detector-on time) | Marked lightcurve |
|---|---|---|---|---|---|---|---|
| A | 7743 | 6784 | 0 | 0 | 0.00% | 0.00% | 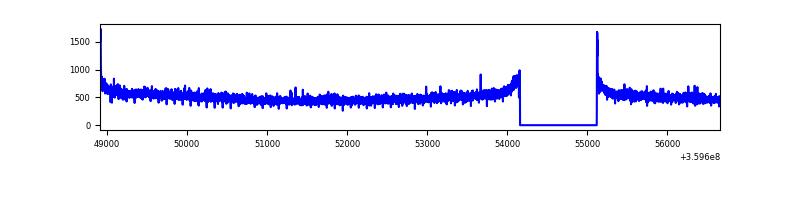 |
| B | 7743 | 6784 | 47 | 47 | 0.61% | 0.69% | 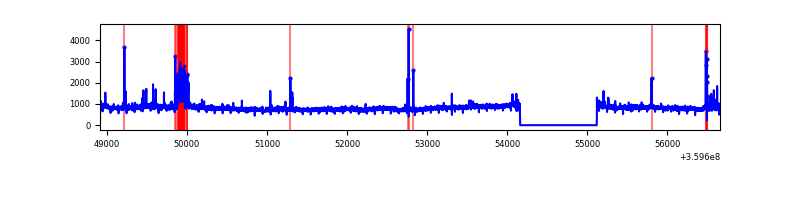 |
| C | 7743 | 6784 | 82 | 82 | 1.06% | 1.21% |  |
| D | 7743 | 6784 | 211 | 211 | 2.73% | 3.11% | 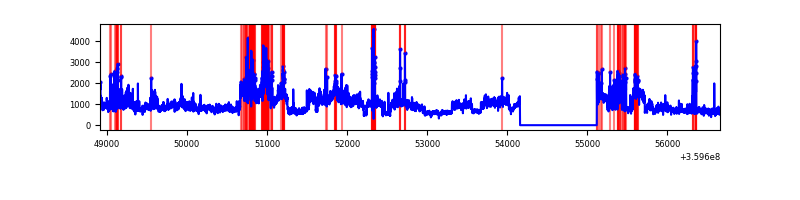 |
Top three noisy pixels from each quadrant. If the there are fewer than three noisy pixels in the level2.evt file, extra rows are filled as -1
| Pixel properties | Quadrant properties | ||||||
|---|---|---|---|---|---|---|---|
| Quadrant | DetID | PixID | Counts | Sigma | Mean | Median | Sigma |
| A | 8 | 192 | 20865 | 114.63 | 887 | 869 | 174.4 |
| A | 13 | 254 | 12184 | 64.86 | 887 | 869 | 174.4 |
| A | 3 | 137 | 8542 | 43.99 | 887 | 869 | 174.4 |
| B | 6 | 159 | 1922981 | 11893.89 | 870 | 848 | 161.6 |
| B | 5 | 255 | 188791 | 1162.96 | 870 | 848 | 161.6 |
| B | 0 | 229 | 49006 | 297.99 | 870 | 848 | 161.6 |
| C | 0 | 10 | 297982 | 1563.69 | 818 | 822 | 190.0 |
| C | 14 | 238 | 180079 | 943.27 | 818 | 822 | 190.0 |
| C | 14 | 254 | 60189 | 312.4 | 818 | 822 | 190.0 |
| D | 8 | 195 | 2881044 | 14681.46 | 837 | 815 | 196.2 |
| D | 5 | 222 | 334417 | 1700.48 | 837 | 815 | 196.2 |
| D | 13 | 104 | 184997 | 938.84 | 837 | 815 | 196.2 |
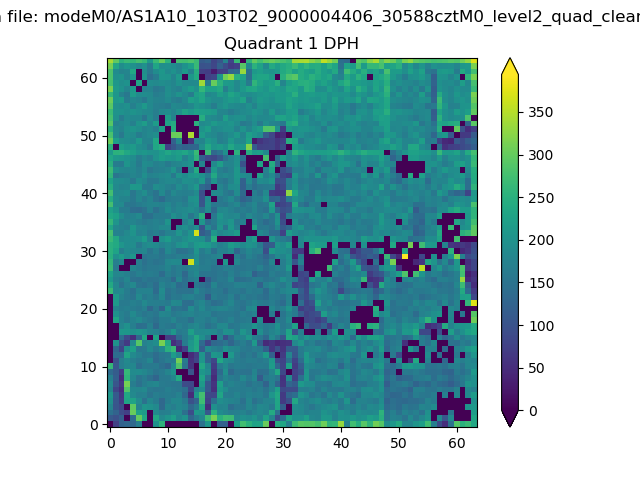
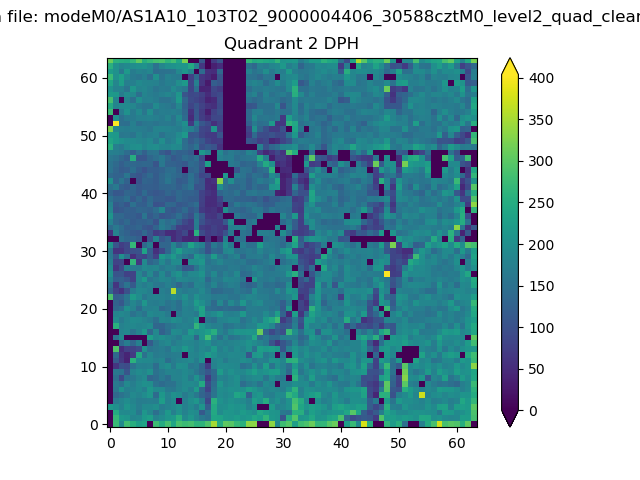
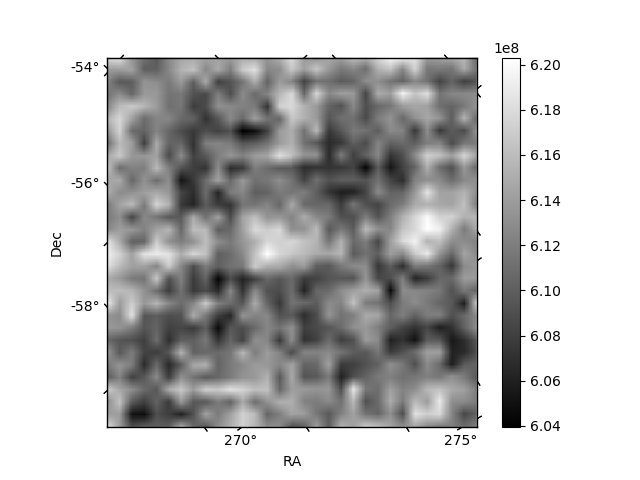
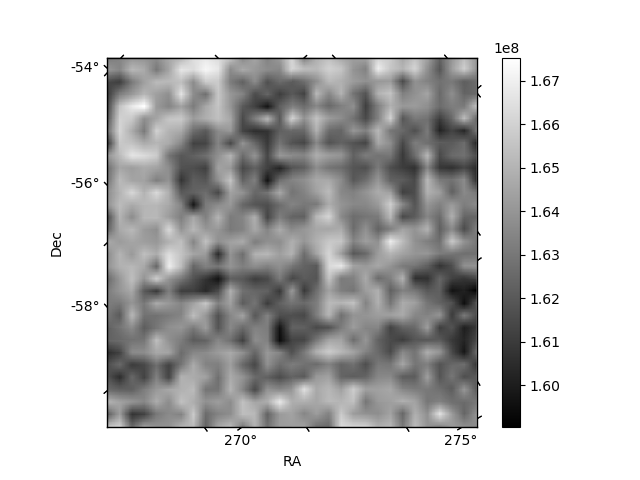
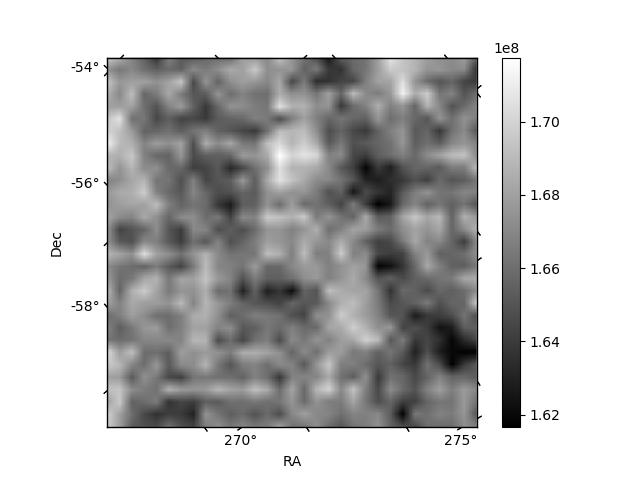
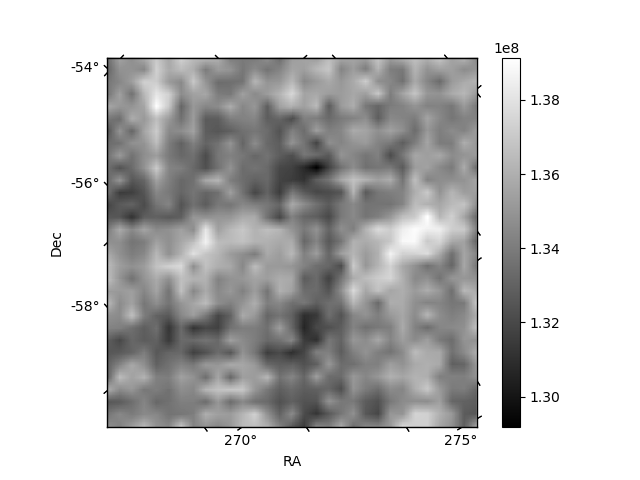
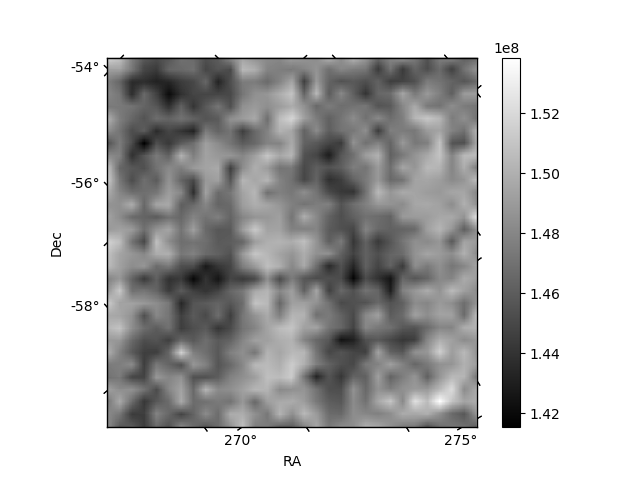
Histogram calculated using DETX and DETY for each event in the final _common_clean file
| Quadrant A | 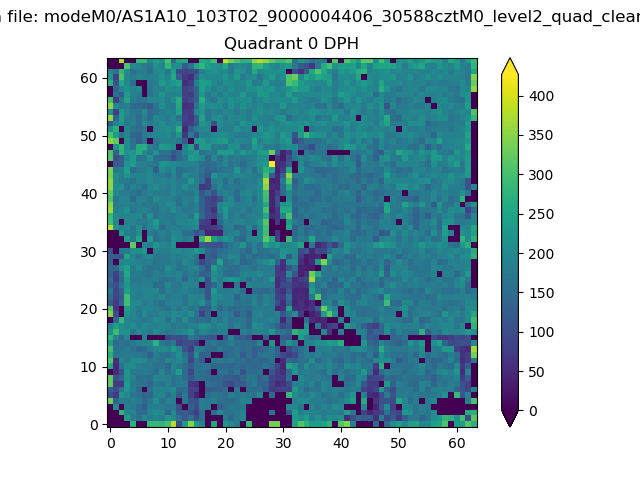 |
 |
Quadrant B |
|---|---|---|---|
| Quadrant D | 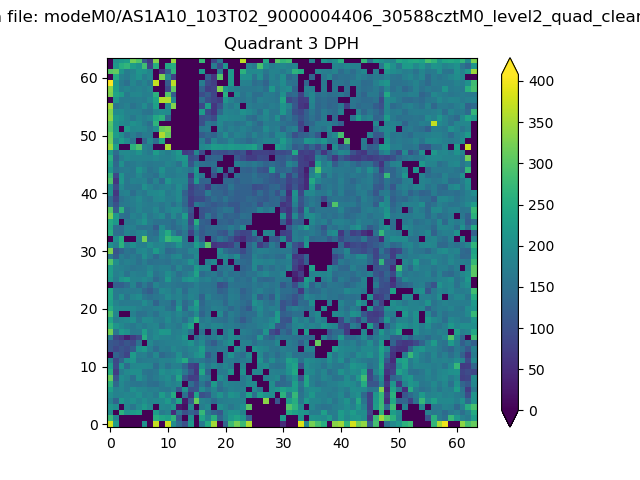 |
 |
Quadrant C |
| Plot type | Count rate plots | Images |
|---|---|---|
| Comparison with Poisson distribution Blue bars denote a histogram of data divided into 1 sec bins. Red curve is a Poisson curve with rate = median count rate of data. |
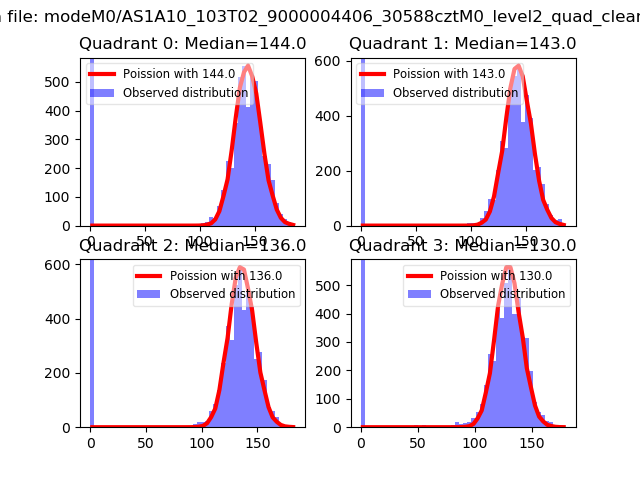 |
 |
| Quadrant-wise count rates Data is divided into 100 sec bins |
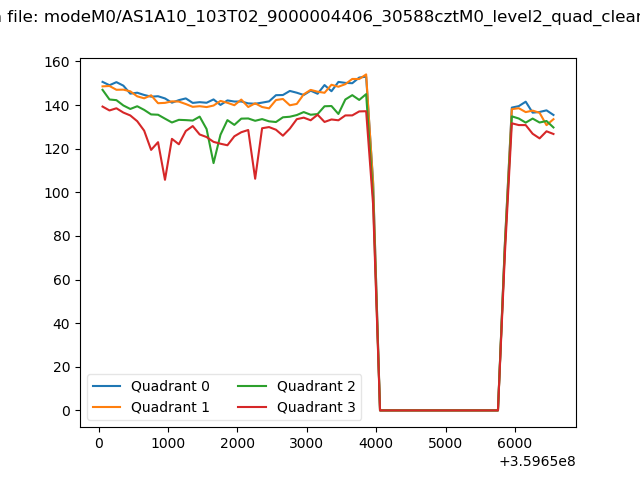 |
|
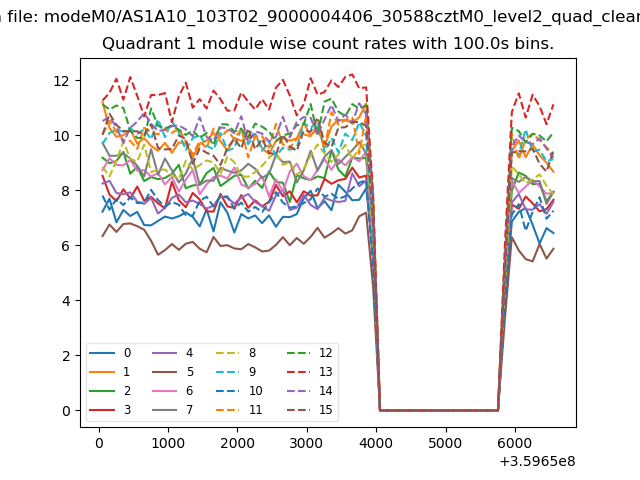
| Module-wise count rates for Quadrant A Data is divided into 100 sec bins |
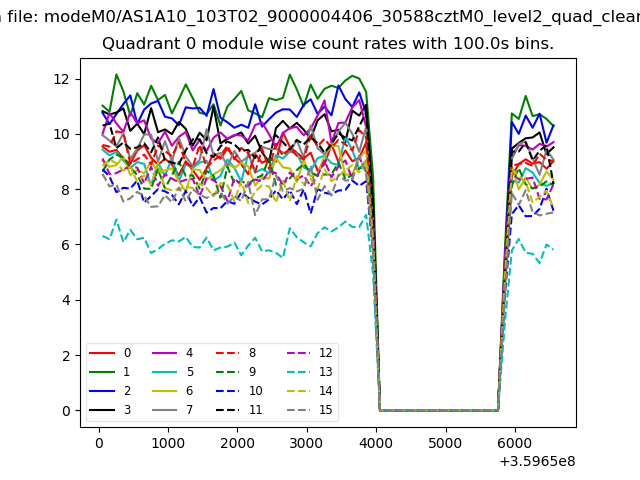 |
 |
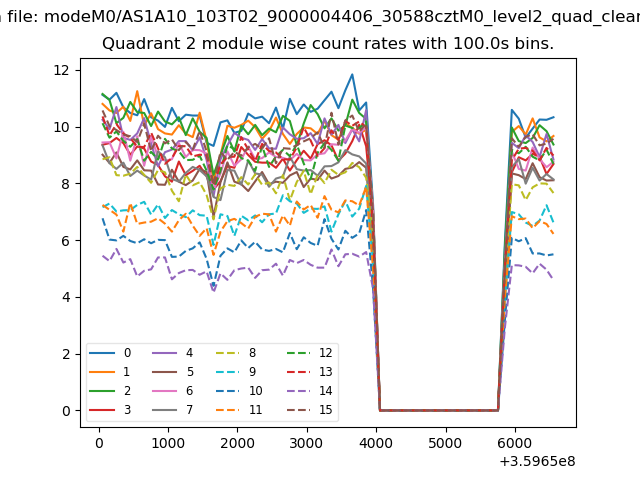
| Module-wise count rates for Quadrant B Data is divided into 100 sec bins |
 |
 |
| Module-wise count rates for Quadrant C Data is divided into 100 sec bins |
 |
 |
| Module-wise count rates for Quadrant D Data is divided into 100 sec bins |
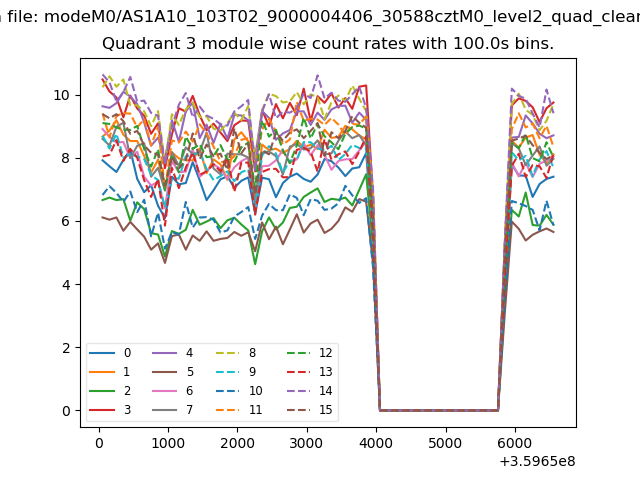 |
 |
| Parameter | Plot |
|---|---|
| CZT HV Monitor | 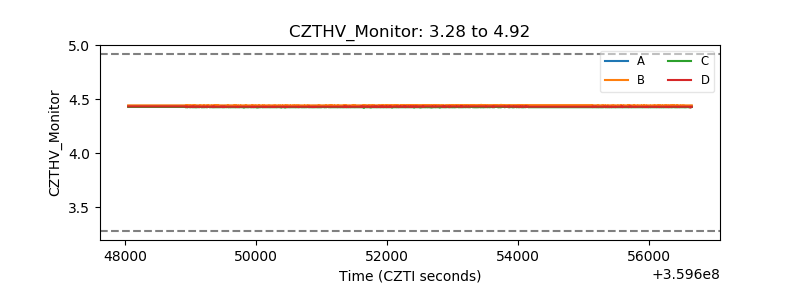 |
| D_VDD | 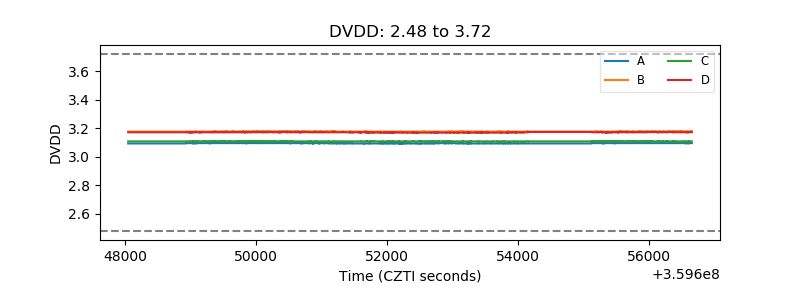 |
| Temperature 1 | 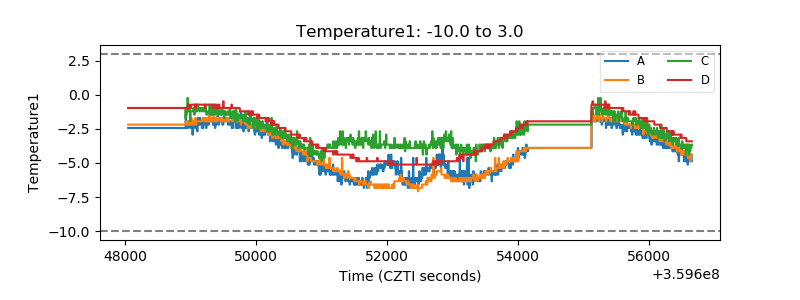 |
| Veto HV Monitor |  |
| Veto LLD | 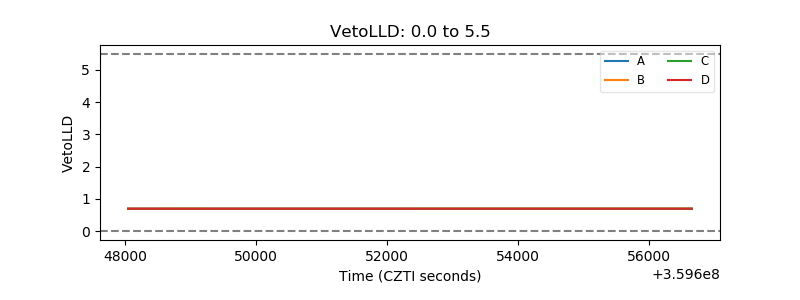 |
| Alpha Counter | 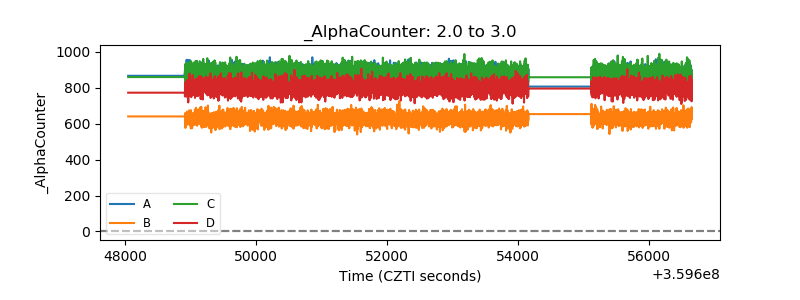 |
| _CPM_Rate | 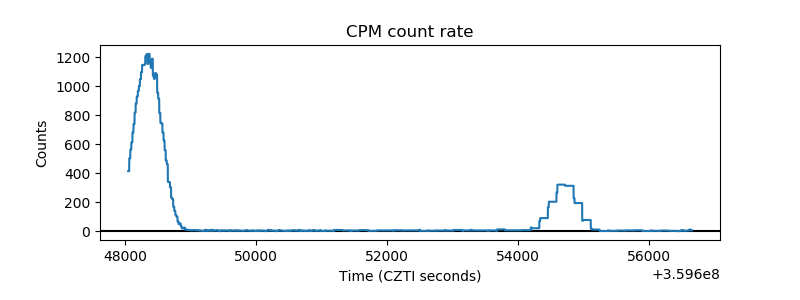 |
| CZT Counter | 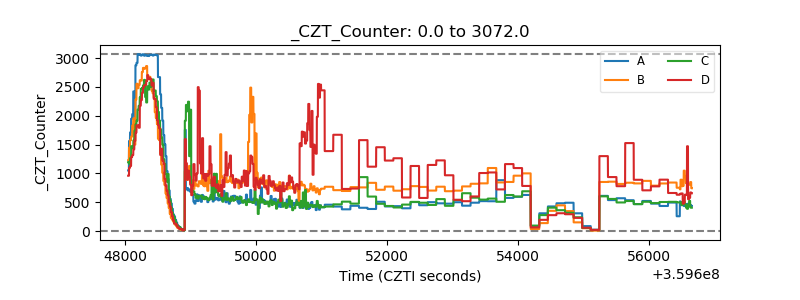 |
| +2.5 Volts monitor | 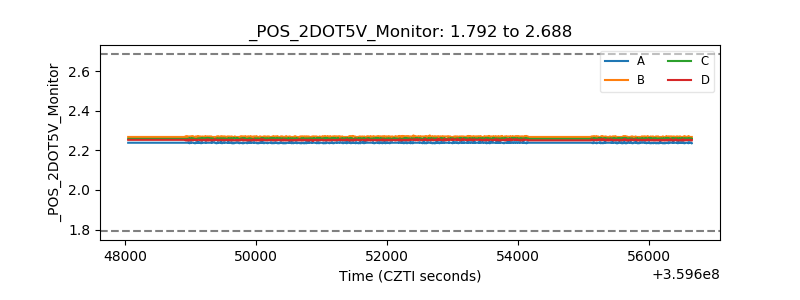 |
| +5 Volts monitor |  |
| _ROLL_ROT | 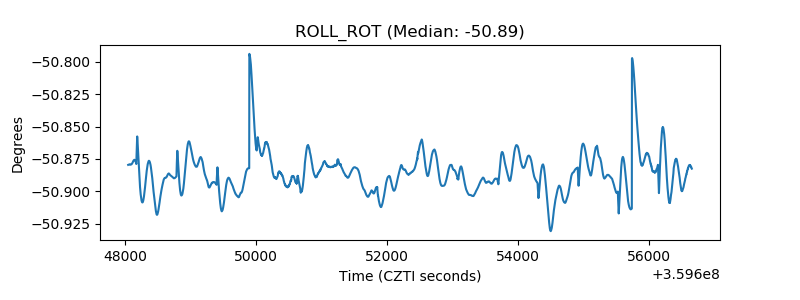 |
| _Roll_DEC | 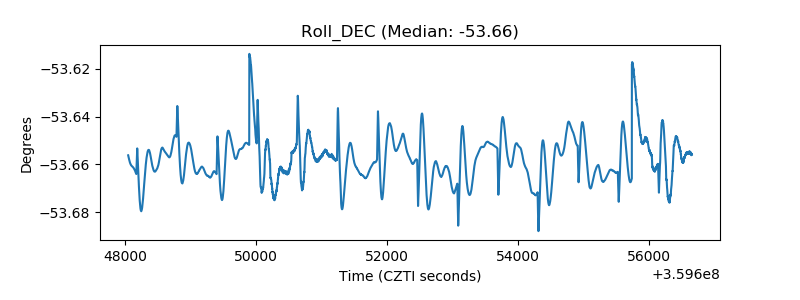 |
| _Roll_RA | 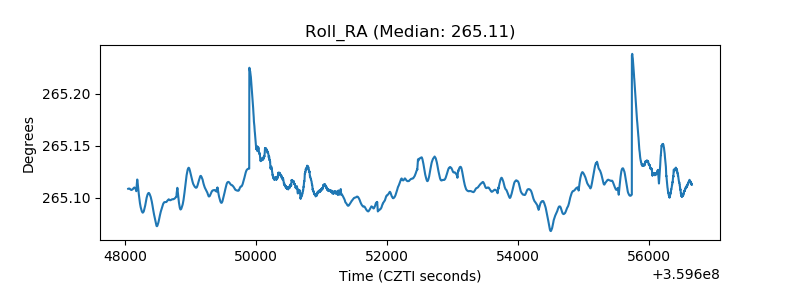 |
| Veto Counter | 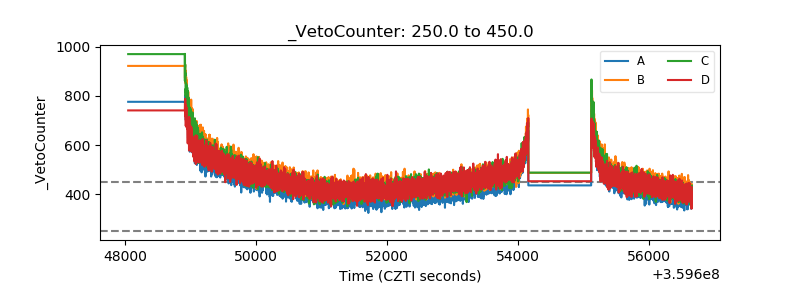 |