| Param | Original file | Final file |
|---|---|---|
| Filename | modeM0/AS1A10_058T03_9000004408_30590cztM0_level2.evt | modeM0/AS1A10_058T03_9000004408_30590cztM0_level2_quad_clean.evt |
| Size (bytes) | 486,650,880 | 66,772,800 |
| Size | 464.1 MB | 63.7 MB |
| Events in quadrant A | 2,634,020 | 430,551 |
| Events in quadrant B | 4,268,546 | 427,953 |
| Events in quadrant C | 2,751,157 | 405,010 |
| Events in quadrant D | 4,726,716 | 388,236 |
| Mode M0 | |||
|---|---|---|---|
| Quadrant | BADHDUFLAG | Total packets | Discarded packets |
| A | 0 | 11125 | 1 |
| B | 0 | 16440 | 1 |
| C | 0 | 11489 | 2 |
| D | 0 | 17787 | 1 |
| Mode SS | |||
|---|---|---|---|
| Quadrant | BADHDUFLAG | Total packets | Discarded packets |
| A | 0 | 110 | 0 |
| B | 0 | 110 | 0 |
| C | 0 | 108 | 0 |
| D | 0 | 108 | 0 |
| Mode M9 | |||
|---|---|---|---|
| Quadrant | BADHDUFLAG | Total packets | Discarded packets |
| A | 0 | 1 | 0 |
| B | 0 | 1 | 0 |
| C | 0 | 1 | 0 |
| D | 0 | 1 | 0 |
| Quadrant | Total seconds | Saturated seconds | Saturation percentage |
|---|---|---|---|
| A | 5277 | 56 | 1.061209% |
| B | 5277 | 199 | 3.771082% |
| C | 5276 | 177 | 3.354814% |
| D | 5276 | 238 | 4.510993% |
Noise dominated data is calculated using 1-second bins in cleaned event files. If a bin has >2000 counts, and if more than 50% of those come from <1% of pixels, then it is considered to be noise-dominated and hence unusable.
| Quadrant | # 1 sec bins | Bins with >0 counts | Bins with >2000 counts | High rate bins dominated by noise | Noise dominated (total time) | Noise dominated (detector-on time) | Marked lightcurve |
|---|---|---|---|---|---|---|---|
| A | 5402 | 5278 | 0 | 0 | 0.00% | 0.00% | 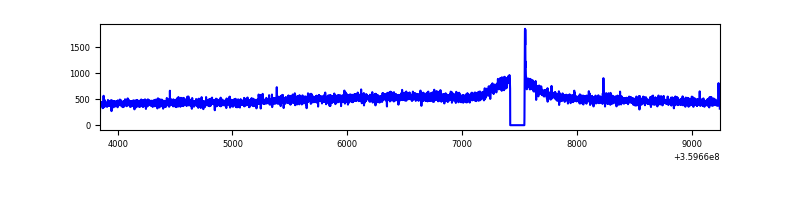 |
| B | 5402 | 5278 | 8 | 8 | 0.15% | 0.15% | 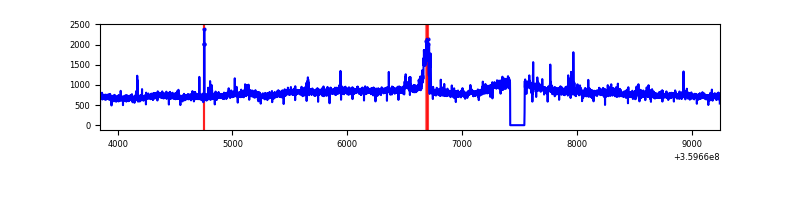 |
| C | 5401 | 5276 | 5 | 5 | 0.09% | 0.09% |  |
| D | 5401 | 5277 | 69 | 69 | 1.28% | 1.31% | 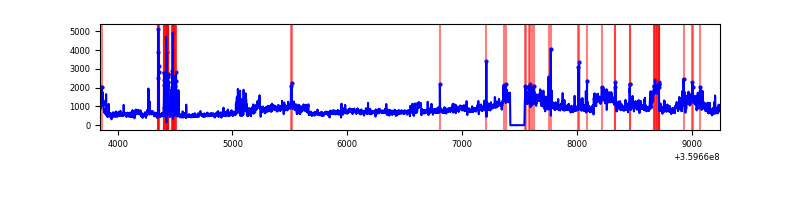 |
Top three noisy pixels from each quadrant. If the there are fewer than three noisy pixels in the level2.evt file, extra rows are filled as -1
| Pixel properties | Quadrant properties | ||||||
|---|---|---|---|---|---|---|---|
| Quadrant | DetID | PixID | Counts | Sigma | Mean | Median | Sigma |
| A | 8 | 192 | 10347 | 70.69 | 680 | 667 | 136.9 |
| A | 13 | 254 | 9339 | 63.32 | 680 | 667 | 136.9 |
| A | 3 | 137 | 6976 | 46.07 | 680 | 667 | 136.9 |
| B | 6 | 159 | 1492739 | 11452.74 | 669 | 650 | 130.3 |
| B | 5 | 255 | 92965 | 708.58 | 669 | 650 | 130.3 |
| B | 0 | 190 | 17649 | 130.48 | 669 | 650 | 130.3 |
| C | 14 | 238 | 119807 | 778.95 | 644 | 646 | 153.0 |
| C | 0 | 10 | 39359 | 253.07 | 644 | 646 | 153.0 |
| C | 3 | 233 | 32453 | 207.92 | 644 | 646 | 153.0 |
| D | 8 | 195 | 1563889 | 10056.65 | 646 | 628 | 155.4 |
| D | 13 | 249 | 196462 | 1259.82 | 646 | 628 | 155.4 |
| D | 5 | 222 | 180711 | 1158.5 | 646 | 628 | 155.4 |
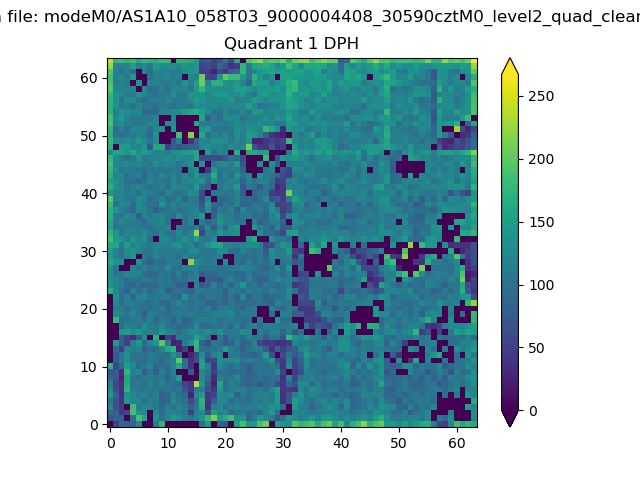
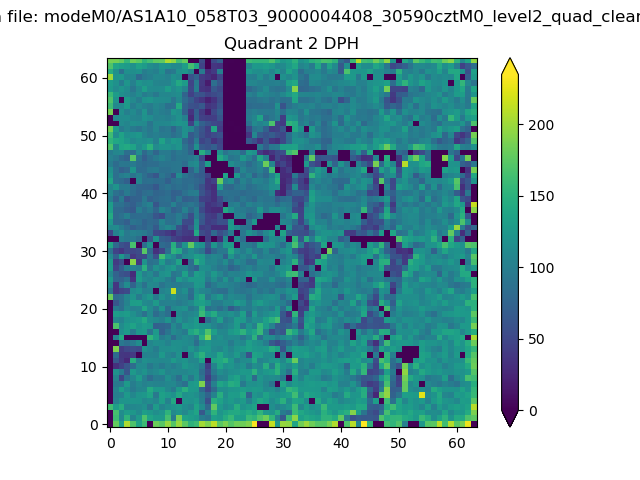
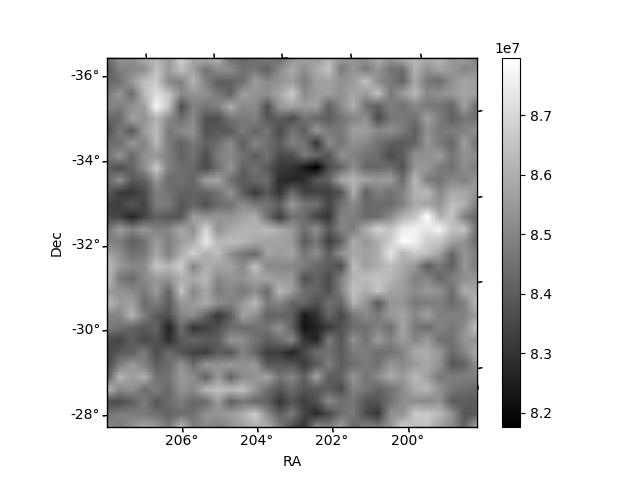
Histogram calculated using DETX and DETY for each event in the final _common_clean file
| Quadrant A | 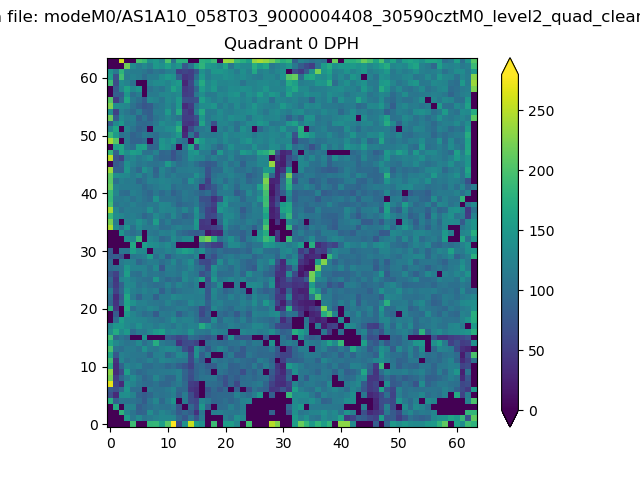 |
 |
Quadrant B |
|---|---|---|---|
| Quadrant D | 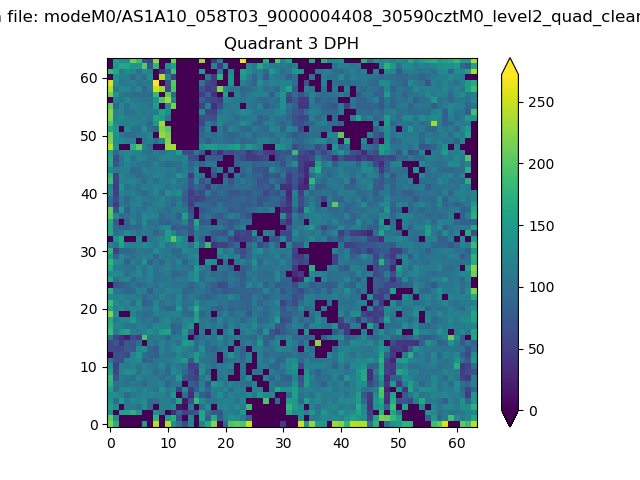 |
 |
Quadrant C |
| Plot type | Count rate plots | Images |
|---|---|---|
| Comparison with Poisson distribution Blue bars denote a histogram of data divided into 1 sec bins. Red curve is a Poisson curve with rate = median count rate of data. |
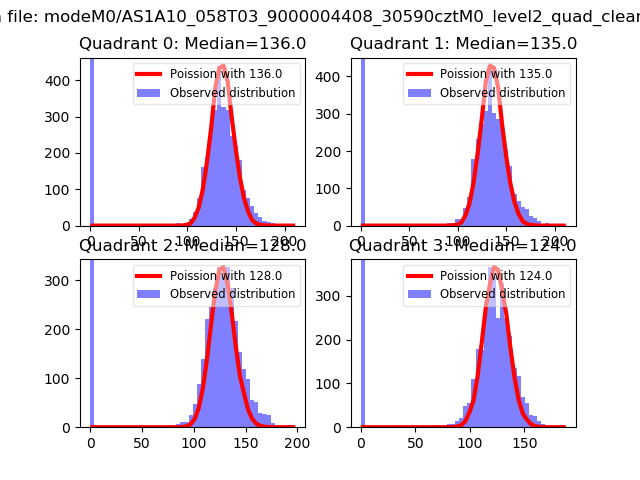 |
 |
| Quadrant-wise count rates Data is divided into 100 sec bins |
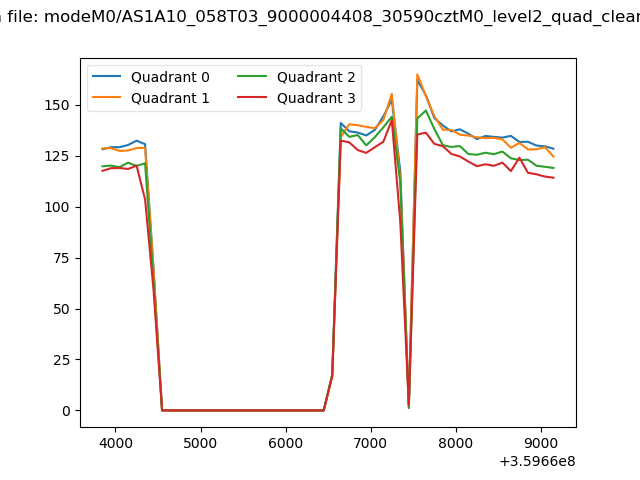 |
|
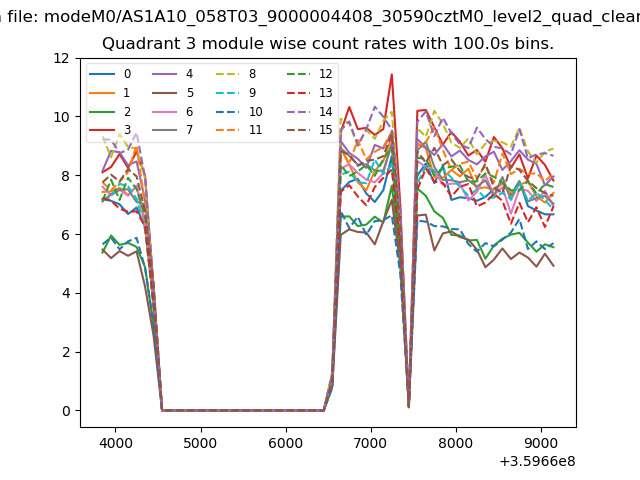
| Module-wise count rates for Quadrant A Data is divided into 100 sec bins |
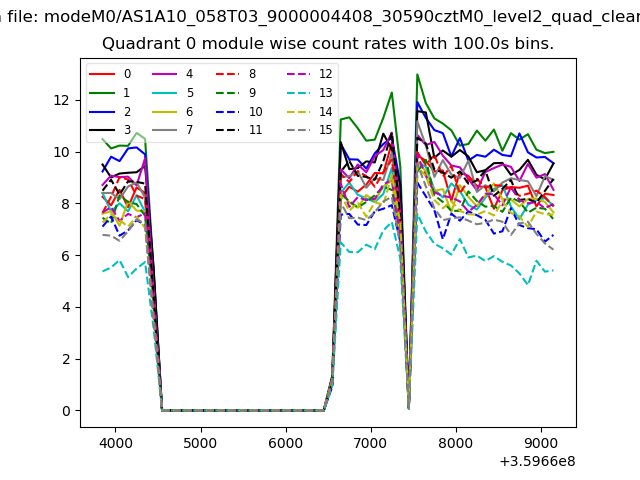 |
 |
| Module-wise count rates for Quadrant B Data is divided into 100 sec bins |
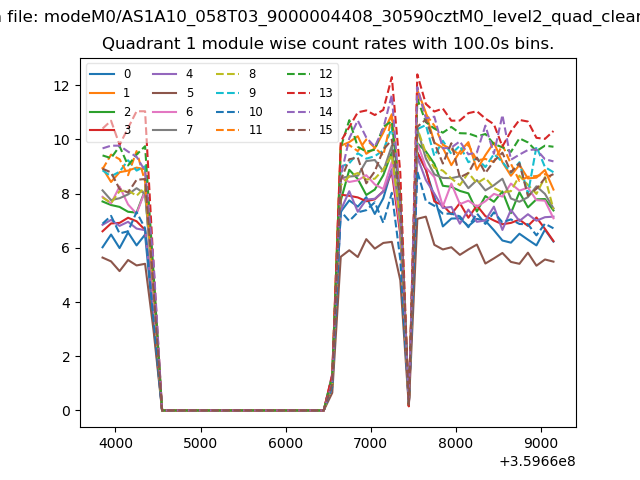 |
 |
| Module-wise count rates for Quadrant C Data is divided into 100 sec bins |
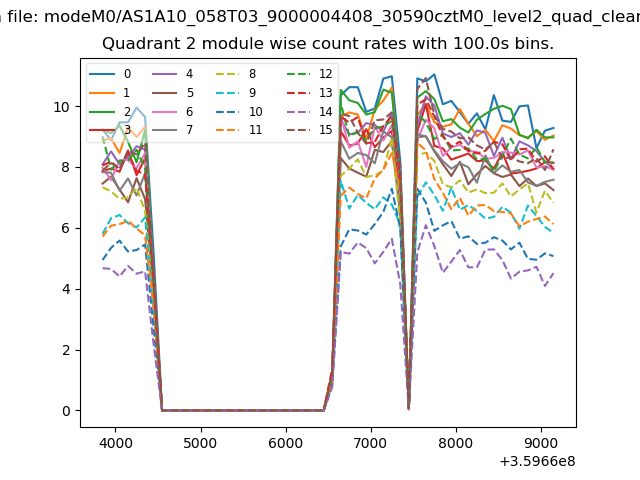 |
 |
| Module-wise count rates for Quadrant D Data is divided into 100 sec bins |
 |
 |
| Parameter | Plot |
|---|---|
| CZT HV Monitor | 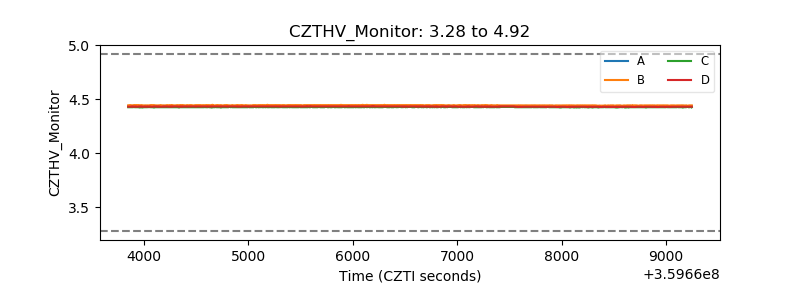 |
| D_VDD | 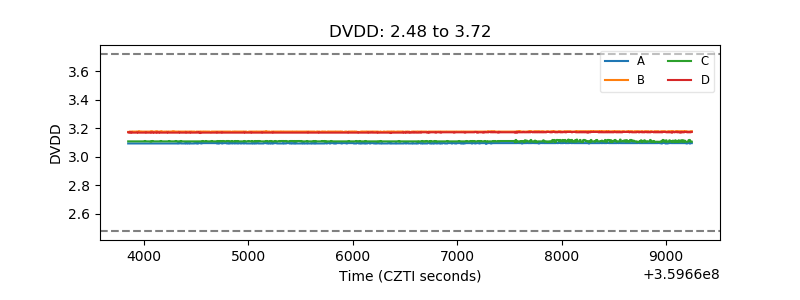 |
| Temperature 1 | 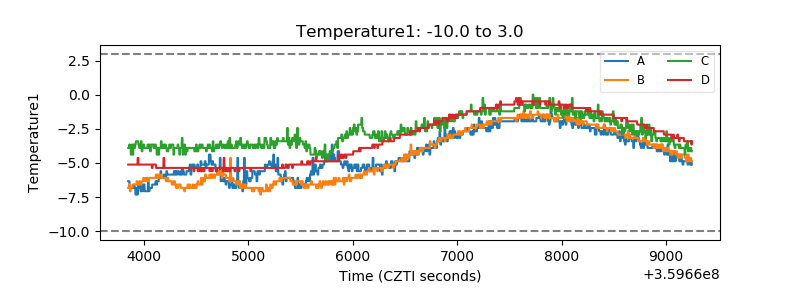 |
| Veto HV Monitor |  |
| Veto LLD | 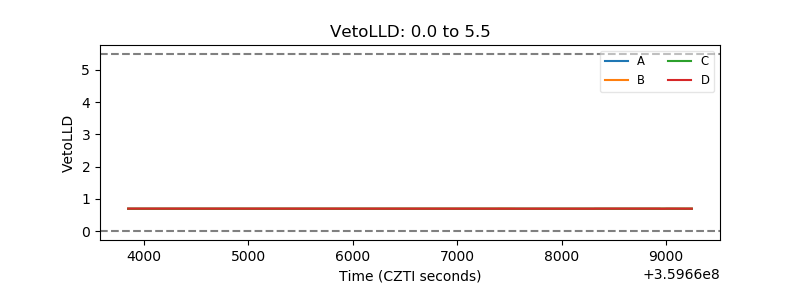 |
| Alpha Counter | 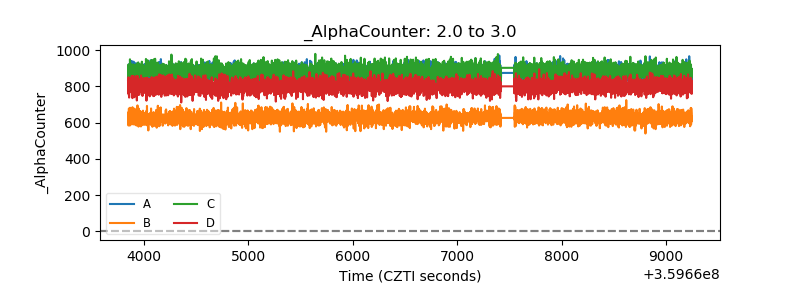 |
| _CPM_Rate | 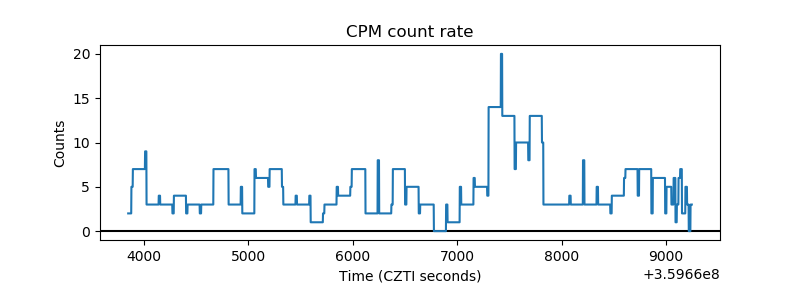 |
| CZT Counter |  |
| +2.5 Volts monitor | 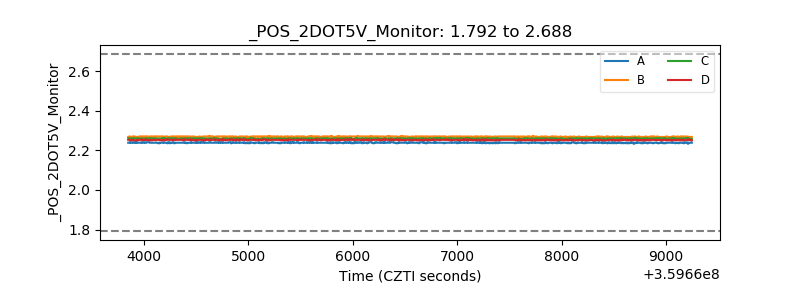 |
| +5 Volts monitor | 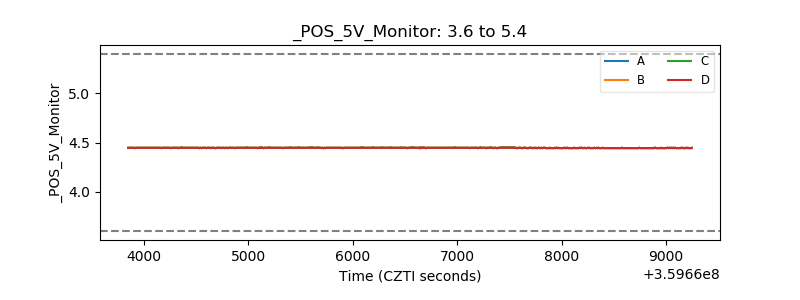 |
| _ROLL_ROT | 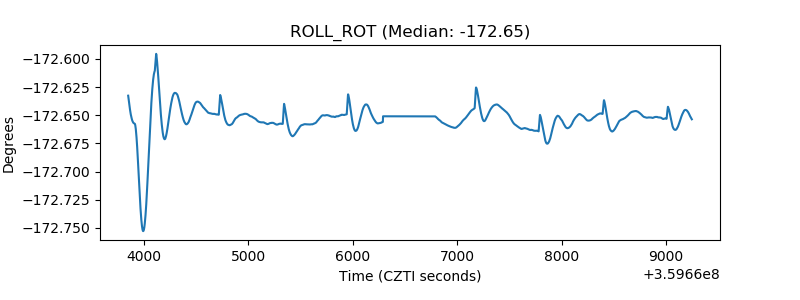 |
| _Roll_DEC |  |
| _Roll_RA |  |
| Veto Counter | 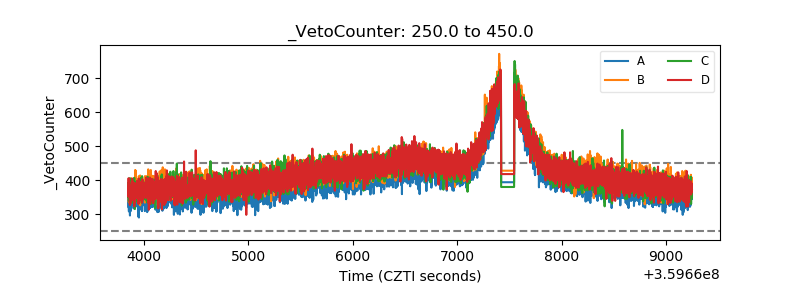 |