| Param | Original file | Final file |
|---|---|---|
| Filename | modeM0/AS1A10_058T03_9000004408_30594cztM0_level2.evt | modeM0/AS1A10_058T03_9000004408_30594cztM0_level2_quad_clean.evt |
| Size (bytes) | 1,655,202,240 | 241,142,400 |
| Size | 1.5 GB | 230.0 MB |
| Events in quadrant A | 8,981,552 | 1,589,369 |
| Events in quadrant B | 14,941,700 | 1,580,104 |
| Events in quadrant C | 10,680,739 | 1,370,488 |
| Events in quadrant D | 14,249,786 | 1,460,360 |
| Mode M0 | |||
|---|---|---|---|
| Quadrant | BADHDUFLAG | Total packets | Discarded packets |
| A | 0 | 38856 | 5 |
| B | 0 | 58003 | 5 |
| C | 0 | 44027 | 5 |
| D | 0 | 55633 | 5 |
| Mode SS | |||
|---|---|---|---|
| Quadrant | BADHDUFLAG | Total packets | Discarded packets |
| A | 0 | 388 | 0 |
| B | 0 | 388 | 0 |
| C | 0 | 388 | 0 |
| D | 0 | 388 | 0 |
| Mode M9 | |||
|---|---|---|---|
| Quadrant | BADHDUFLAG | Total packets | Discarded packets |
| A | 0 | 19 | 0 |
| B | 0 | 19 | 0 |
| C | 0 | 19 | 0 |
| D | 0 | 19 | 0 |
| Quadrant | Total seconds | Saturated seconds | Saturation percentage |
|---|---|---|---|
| A | 18891 | 156 | 0.825790% |
| B | 18891 | 372 | 1.969192% |
| C | 18892 | 3034 | 16.059708% |
| D | 18892 | 528 | 2.794834% |
Noise dominated data is calculated using 1-second bins in cleaned event files. If a bin has >2000 counts, and if more than 50% of those come from <1% of pixels, then it is considered to be noise-dominated and hence unusable.
| Quadrant | # 1 sec bins | Bins with >0 counts | Bins with >2000 counts | High rate bins dominated by noise | Noise dominated (total time) | Noise dominated (detector-on time) | Marked lightcurve |
|---|---|---|---|---|---|---|---|
| A | 20916 | 18896 | 2 | 2 | 0.01% | 0.01% | 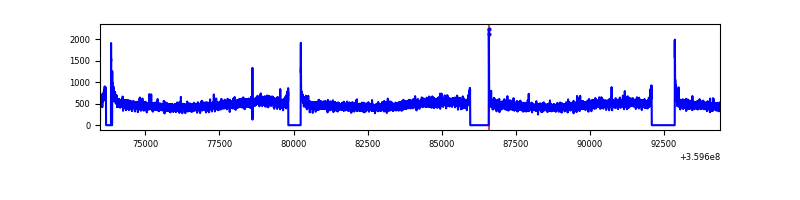 |
| B | 20916 | 18896 | 29 | 29 | 0.14% | 0.15% | 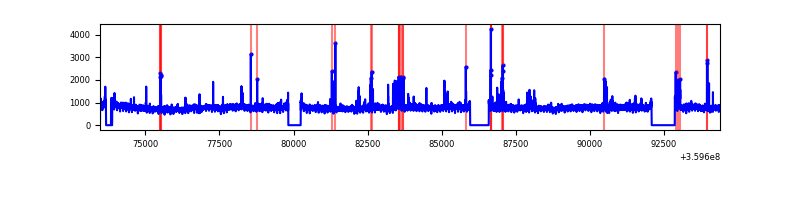 |
| C | 20917 | 18896 | 35 | 35 | 0.17% | 0.19% | 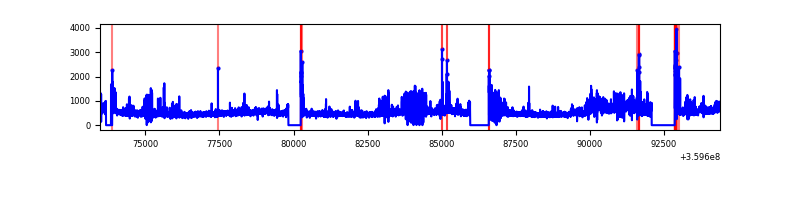 |
| D | 20917 | 18897 | 328 | 328 | 1.57% | 1.74% | 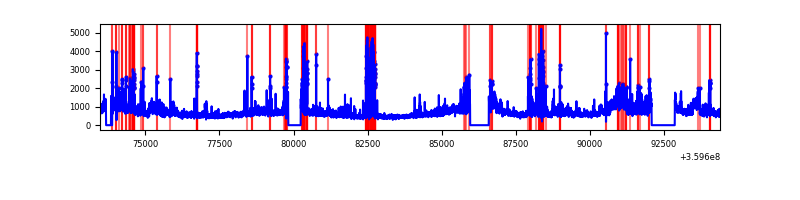 |
Top three noisy pixels from each quadrant. If the there are fewer than three noisy pixels in the level2.evt file, extra rows are filled as -1
| Pixel properties | Quadrant properties | ||||||
|---|---|---|---|---|---|---|---|
| Quadrant | DetID | PixID | Counts | Sigma | Mean | Median | Sigma |
| A | 8 | 192 | 47259 | 96.87 | 2316 | 2268 | 464.5 |
| A | 13 | 254 | 33710 | 67.69 | 2316 | 2268 | 464.5 |
| A | 3 | 137 | 24026 | 46.84 | 2316 | 2268 | 464.5 |
| B | 6 | 159 | 5415001 | 12388.96 | 2285 | 2226 | 436.9 |
| B | 0 | 229 | 292638 | 664.71 | 2285 | 2226 | 436.9 |
| B | 6 | 36 | 68042 | 150.64 | 2285 | 2226 | 436.9 |
| C | 14 | 238 | 1143407 | 2432.15 | 2017 | 2031 | 469.3 |
| C | 14 | 254 | 1033969 | 2198.95 | 2017 | 2031 | 469.3 |
| C | 0 | 10 | 289875 | 613.36 | 2017 | 2031 | 469.3 |
| D | 8 | 195 | 4015205 | 7647.88 | 2201 | 2140 | 524.7 |
| D | 13 | 249 | 939427 | 1786.23 | 2201 | 2140 | 524.7 |
| D | 5 | 222 | 212424 | 400.75 | 2201 | 2140 | 524.7 |
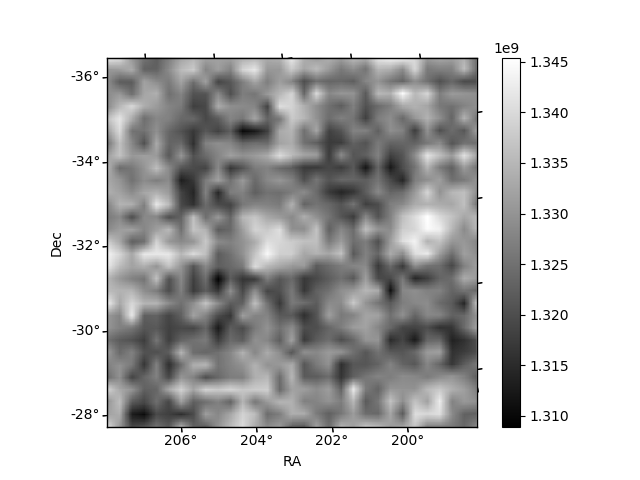
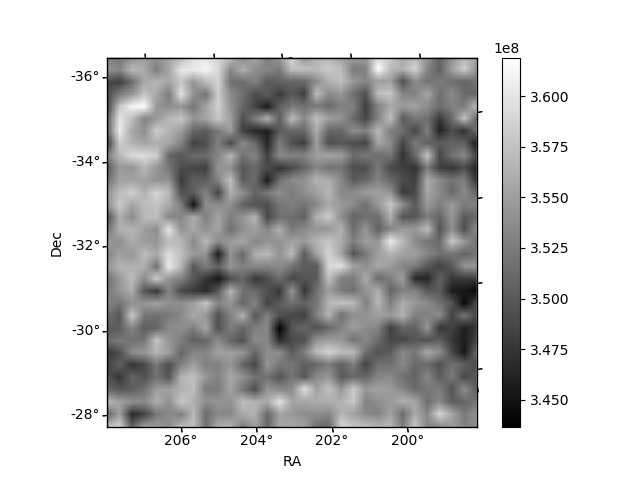
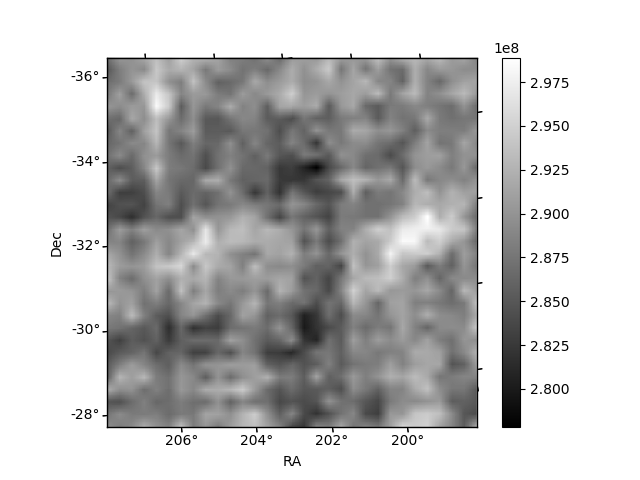
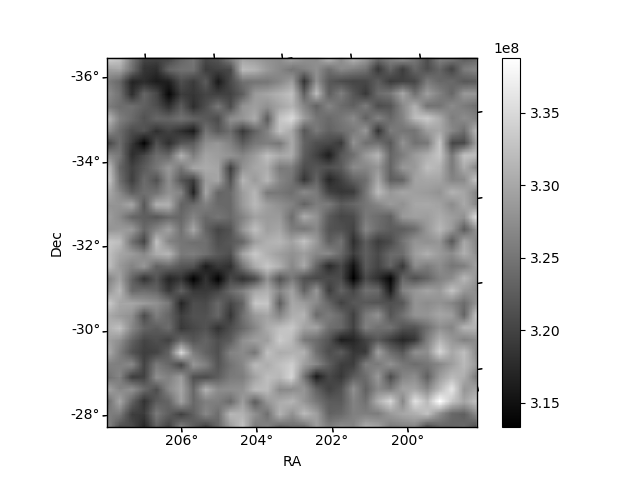
Histogram calculated using DETX and DETY for each event in the final _common_clean file
| Quadrant A | 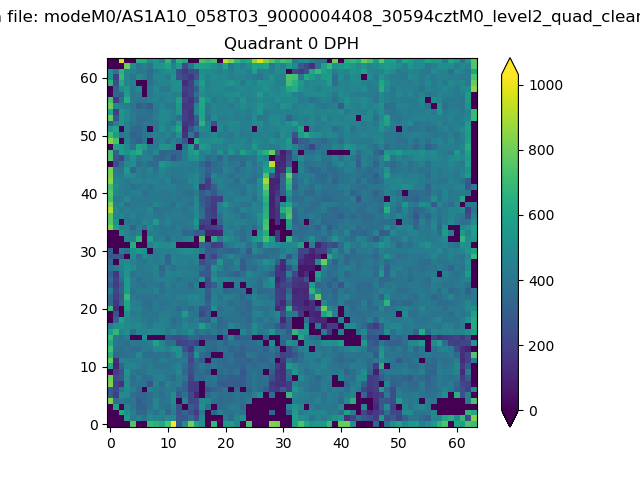 |
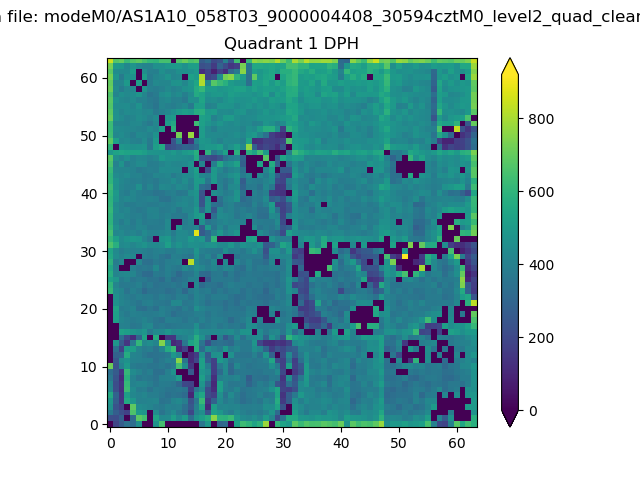 |
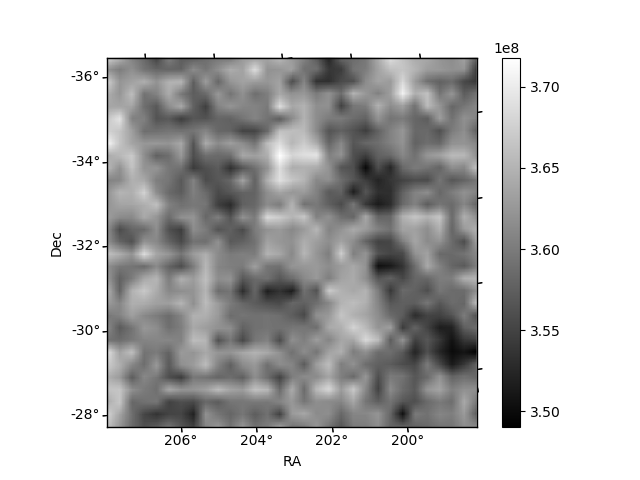
Quadrant B |
|---|---|---|---|
| Quadrant D | 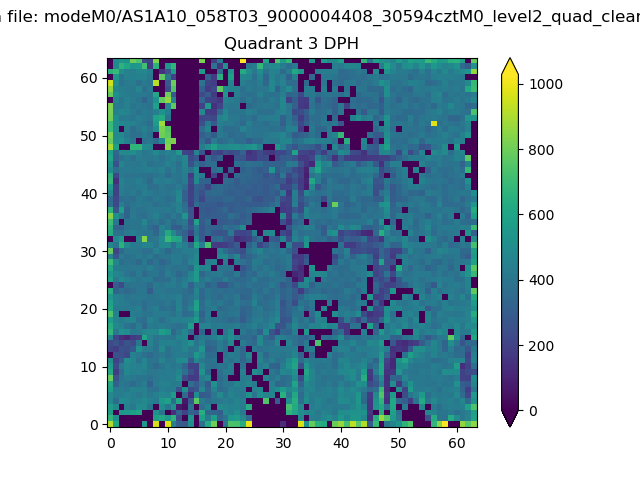 |
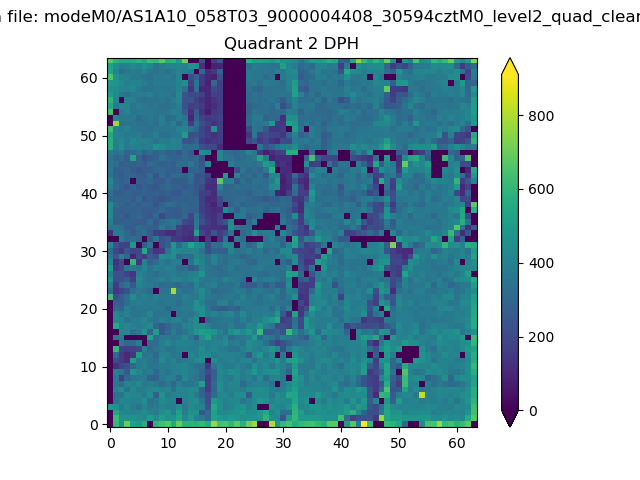 |
Quadrant C |
| Plot type | Count rate plots | Images |
|---|---|---|
| Comparison with Poisson distribution Blue bars denote a histogram of data divided into 1 sec bins. Red curve is a Poisson curve with rate = median count rate of data. |
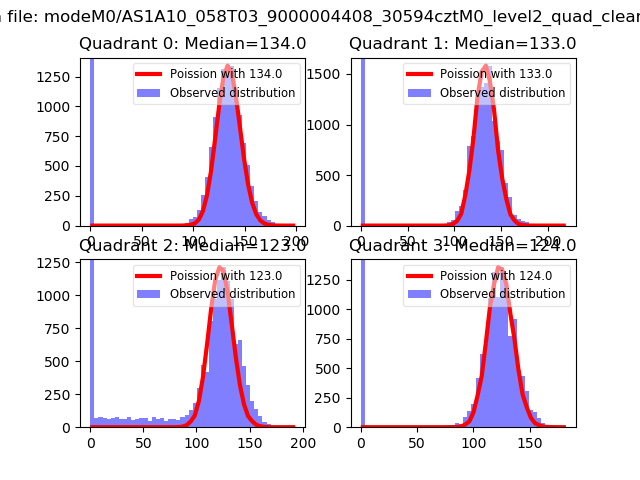 |
 |
| Quadrant-wise count rates Data is divided into 100 sec bins |
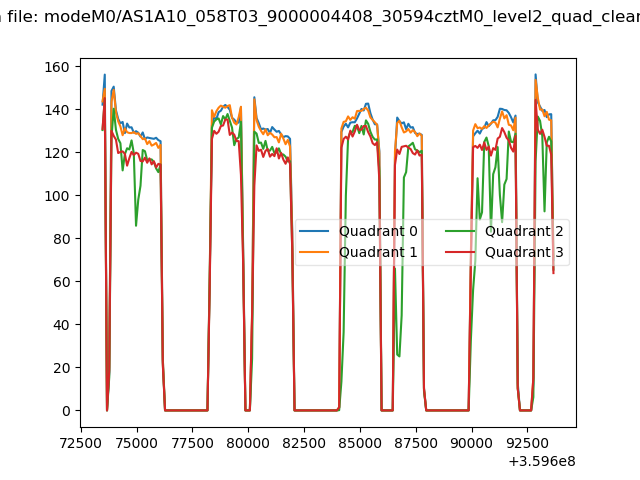 |
|
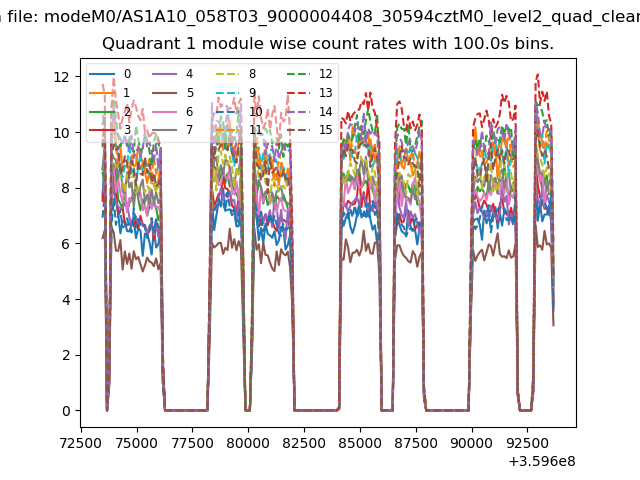
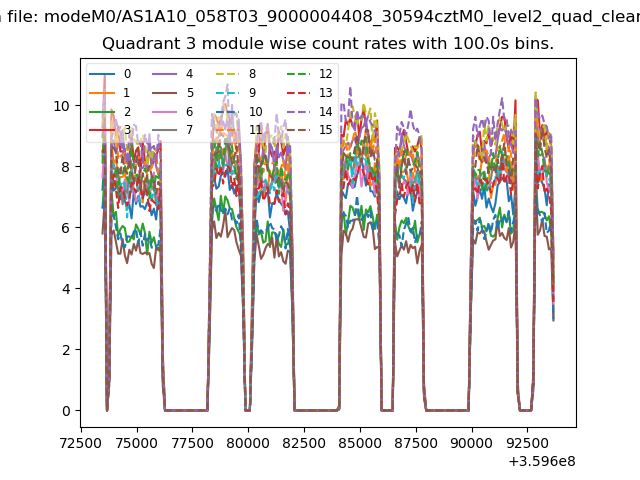
| Module-wise count rates for Quadrant A Data is divided into 100 sec bins |
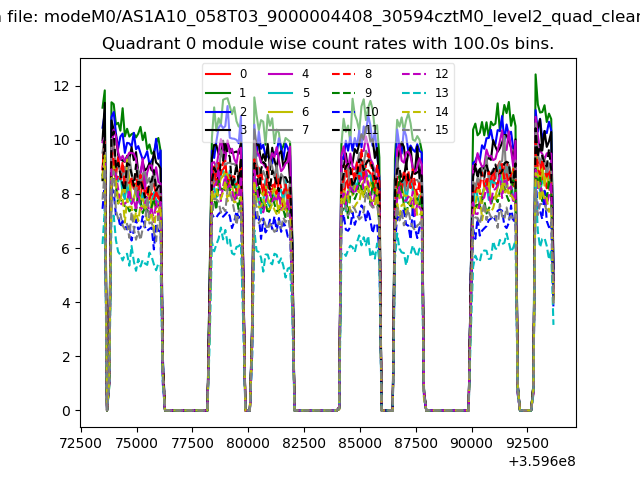 |
 |
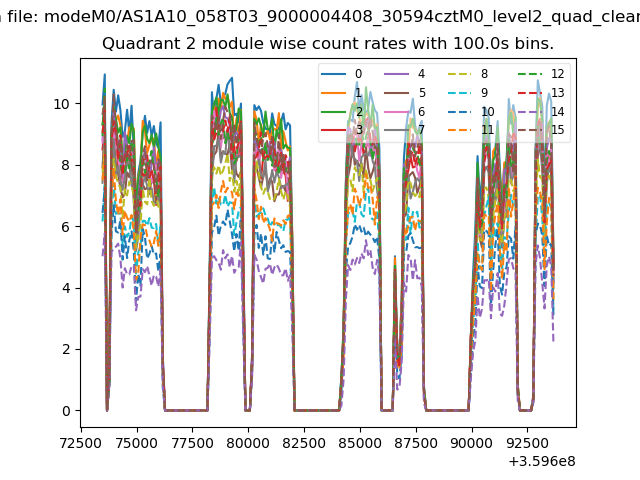
| Module-wise count rates for Quadrant B Data is divided into 100 sec bins |
 |
 |
| Module-wise count rates for Quadrant C Data is divided into 100 sec bins |
 |
 |
| Module-wise count rates for Quadrant D Data is divided into 100 sec bins |
 |
 |
| Parameter | Plot |
|---|---|
| CZT HV Monitor | 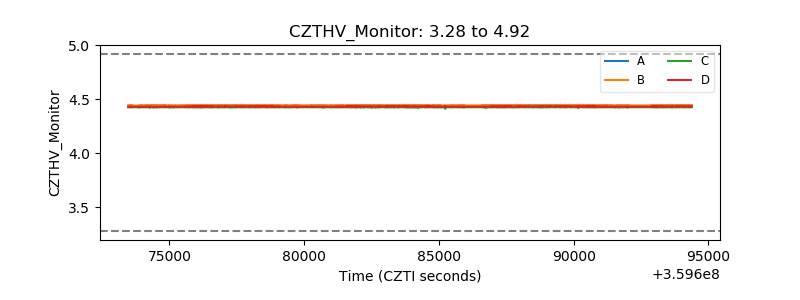 |
| D_VDD | 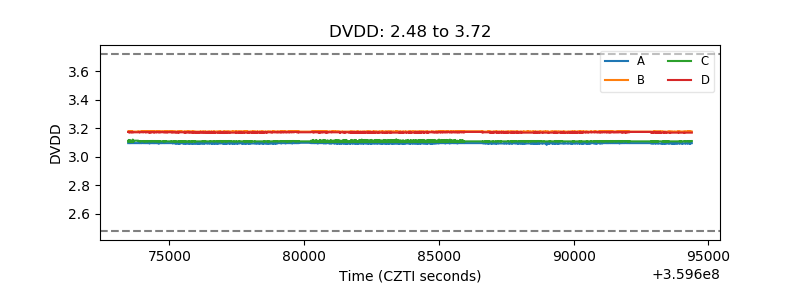 |
| Temperature 1 | 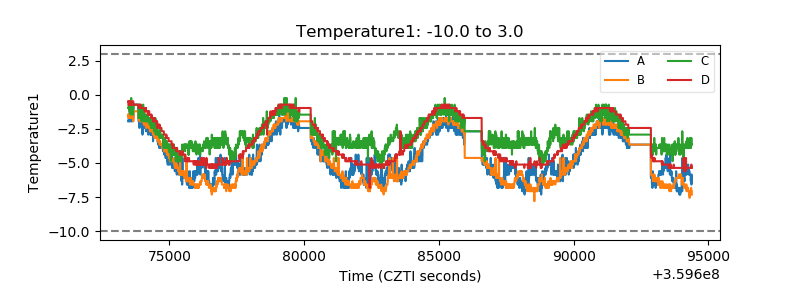 |
| Veto HV Monitor | 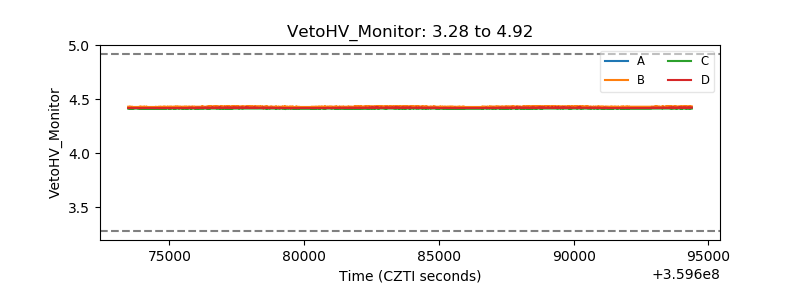 |
| Veto LLD | 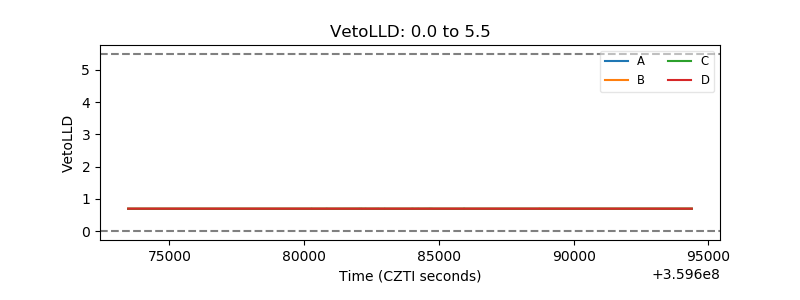 |
| Alpha Counter | 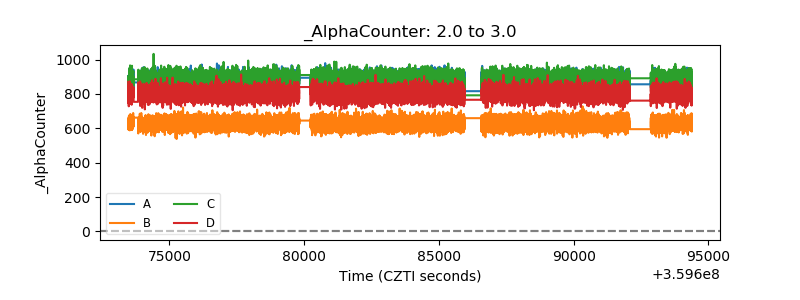 |
| _CPM_Rate | 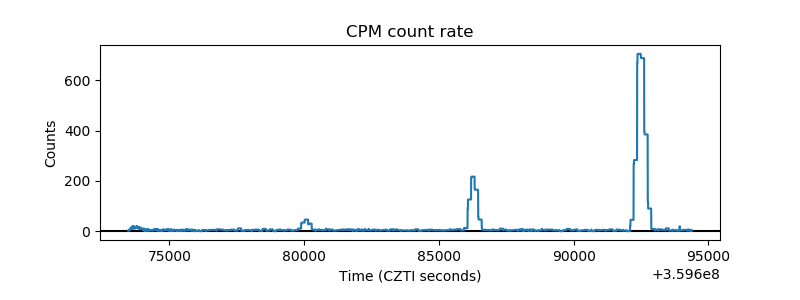 |
| CZT Counter | 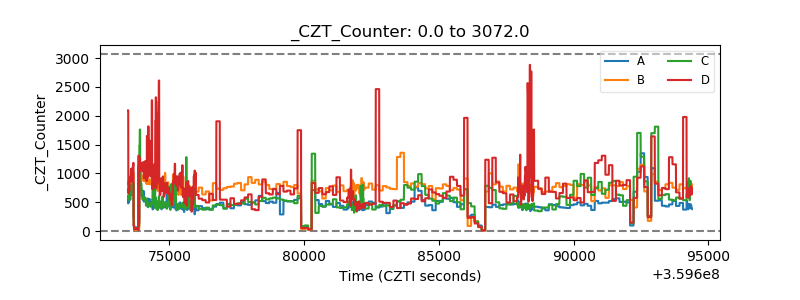 |
| +2.5 Volts monitor | 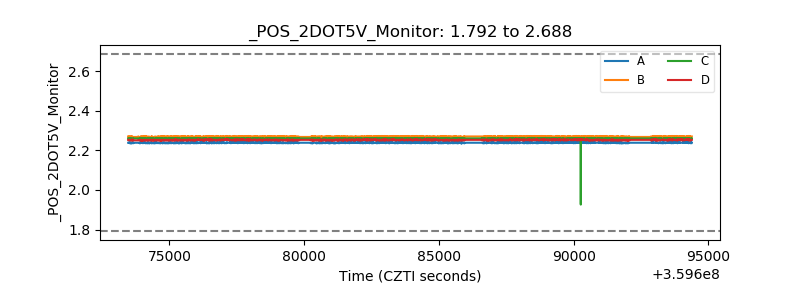 |
| +5 Volts monitor | 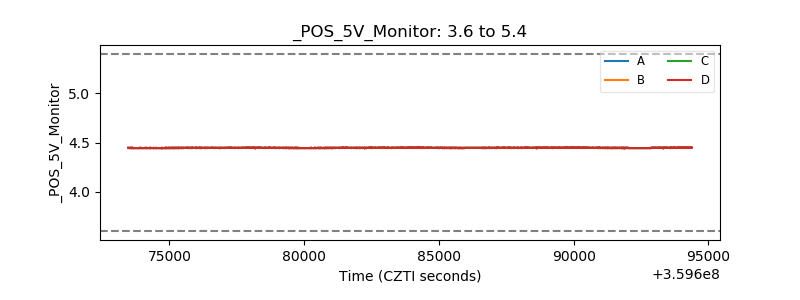 |
| _ROLL_ROT | 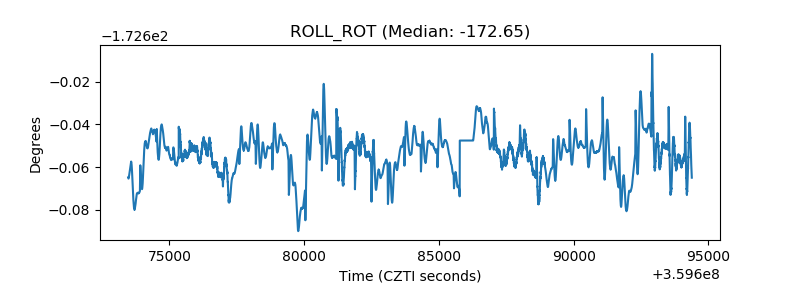 |
| _Roll_DEC | 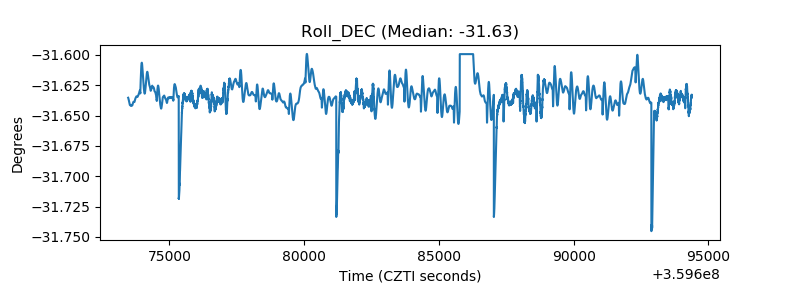 |
| _Roll_RA | 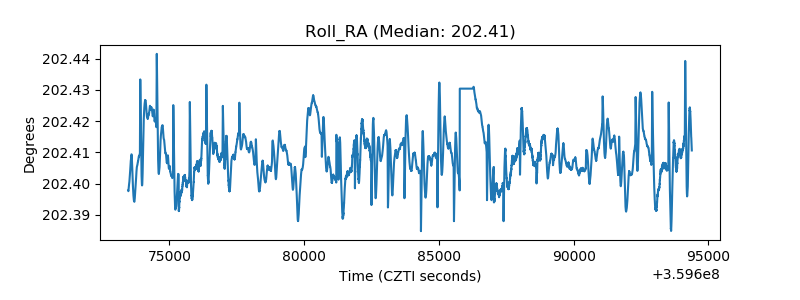 |
| Veto Counter | 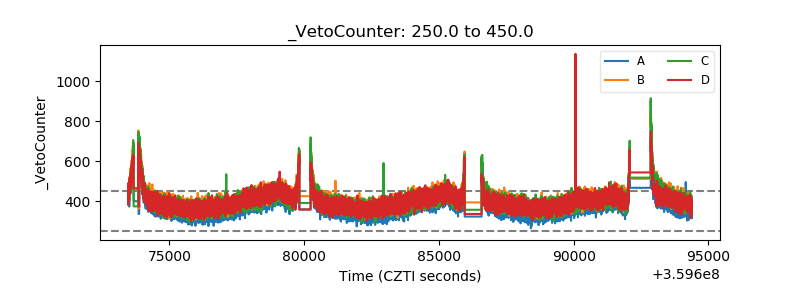 |