| Param | Original file | Final file |
|---|---|---|
| Filename | modeM0/AS1A10_058T03_9000004408_30595cztM0_level2.evt | modeM0/AS1A10_058T03_9000004408_30595cztM0_level2_quad_clean.evt |
| Size (bytes) | 694,134,720 | 77,466,240 |
| Size | 662.0 MB | 73.9 MB |
| Events in quadrant A | 3,381,778 | 522,834 |
| Events in quadrant B | 5,461,825 | 522,224 |
| Events in quadrant C | 5,310,140 | 335,874 |
| Events in quadrant D | 6,394,176 | 477,337 |
| Mode M0 | |||
|---|---|---|---|
| Quadrant | BADHDUFLAG | Total packets | Discarded packets |
| A | 0 | 14387 | 3 |
| B | 0 | 21324 | 2 |
| C | 0 | 20290 | 2 |
| D | 0 | 24121 | 2 |
| Mode SS | |||
|---|---|---|---|
| Quadrant | BADHDUFLAG | Total packets | Discarded packets |
| A | 0 | 142 | 0 |
| B | 0 | 142 | 0 |
| C | 0 | 142 | 0 |
| D | 0 | 142 | 0 |
| Mode M9 | |||
|---|---|---|---|
| Quadrant | BADHDUFLAG | Total packets | Discarded packets |
| A | 0 | 18 | 0 |
| B | 0 | 18 | 0 |
| C | 0 | 18 | 0 |
| D | 0 | 18 | 0 |
| Quadrant | Total seconds | Saturated seconds | Saturation percentage |
|---|---|---|---|
| A | 6985 | 66 | 0.944882% |
| B | 6985 | 132 | 1.889764% |
| C | 6985 | 3828 | 54.803150% |
| D | 6985 | 218 | 3.120974% |
Noise dominated data is calculated using 1-second bins in cleaned event files. If a bin has >2000 counts, and if more than 50% of those come from <1% of pixels, then it is considered to be noise-dominated and hence unusable.
| Quadrant | # 1 sec bins | Bins with >0 counts | Bins with >2000 counts | High rate bins dominated by noise | Noise dominated (total time) | Noise dominated (detector-on time) | Marked lightcurve |
|---|---|---|---|---|---|---|---|
| A | 8740 | 6987 | 0 | 0 | 0.00% | 0.00% | 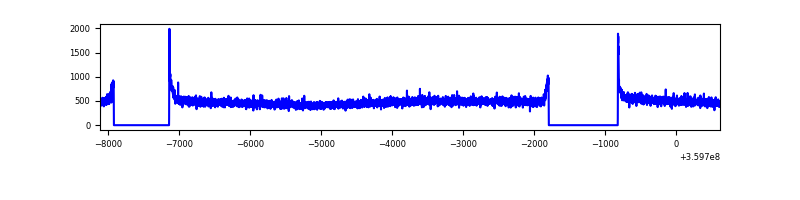 |
| B | 8740 | 6987 | 6 | 6 | 0.07% | 0.09% | 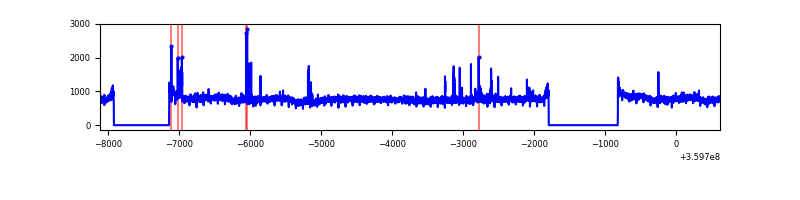 |
| C | 8740 | 6987 | 25 | 25 | 0.29% | 0.36% | 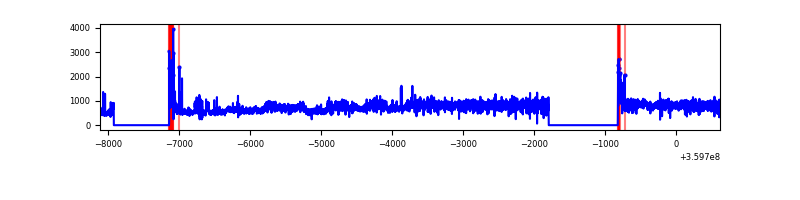 |
| D | 8740 | 6987 | 90 | 90 | 1.03% | 1.29% | 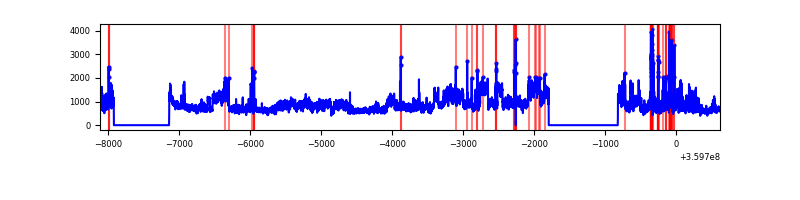 |
Top three noisy pixels from each quadrant. If the there are fewer than three noisy pixels in the level2.evt file, extra rows are filled as -1
| Pixel properties | Quadrant properties | ||||||
|---|---|---|---|---|---|---|---|
| Quadrant | DetID | PixID | Counts | Sigma | Mean | Median | Sigma |
| A | 8 | 192 | 21129 | 116.56 | 870 | 853 | 174.0 |
| A | 13 | 254 | 12219 | 65.34 | 870 | 853 | 174.0 |
| A | 3 | 137 | 8891 | 46.21 | 870 | 853 | 174.0 |
| B | 6 | 159 | 1960669 | 11847.18 | 863 | 842 | 165.4 |
| B | 0 | 229 | 44043 | 261.15 | 863 | 842 | 165.4 |
| B | 4 | 171 | 21534 | 125.08 | 863 | 842 | 165.4 |
| C | 14 | 254 | 1339786 | 8864.38 | 645 | 649 | 151.1 |
| C | 14 | 238 | 1160110 | 7675.02 | 645 | 649 | 151.1 |
| C | 0 | 10 | 181343 | 1196.1 | 645 | 649 | 151.1 |
| D | 8 | 195 | 2748913 | 13773.11 | 831 | 809 | 199.5 |
| D | 13 | 249 | 199896 | 997.8 | 831 | 809 | 199.5 |
| D | 1 | 52 | 149639 | 745.91 | 831 | 809 | 199.5 |
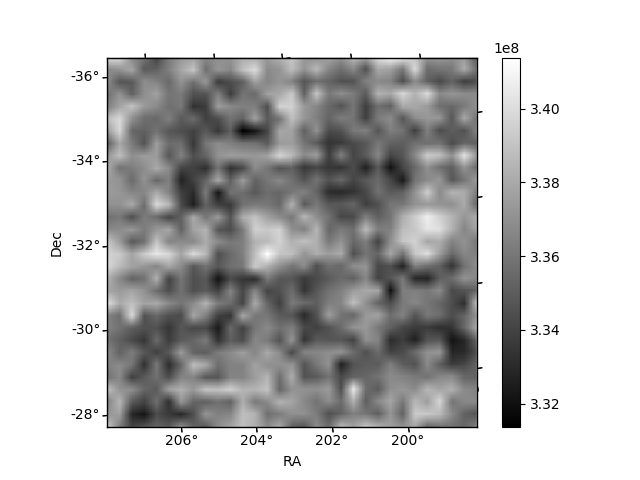
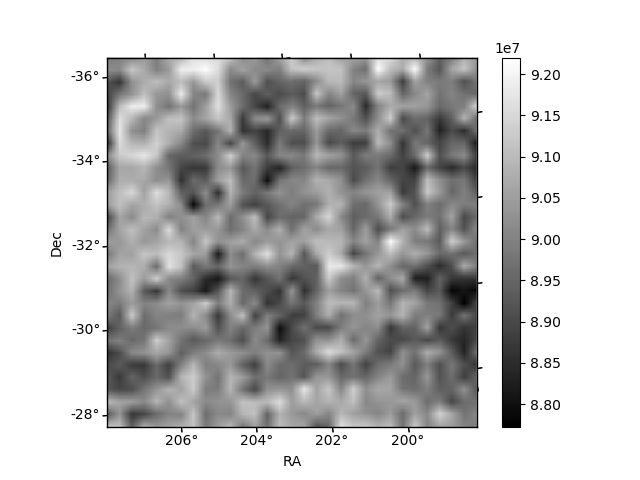
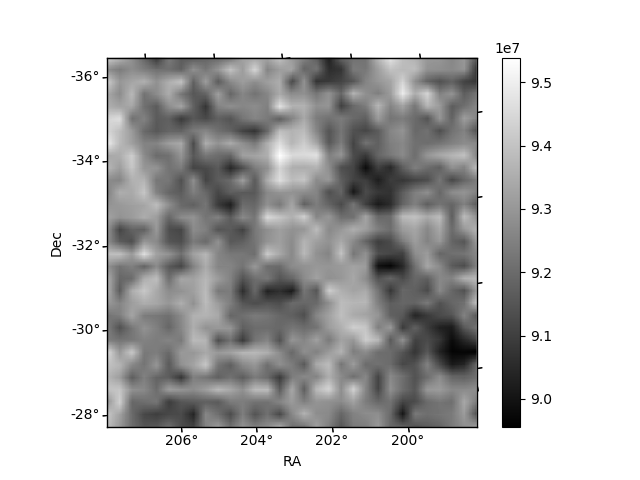
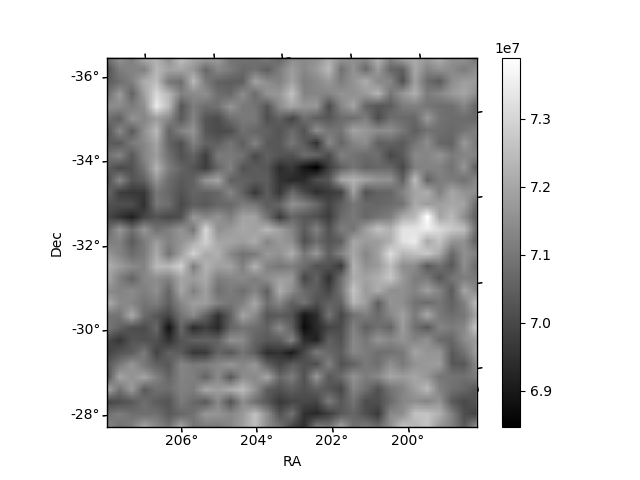
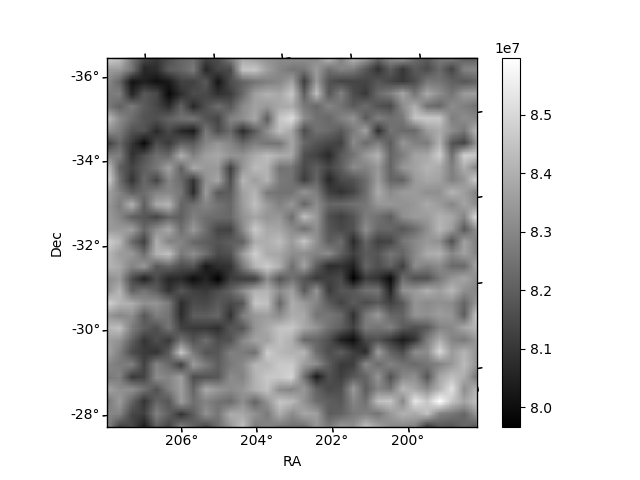
Histogram calculated using DETX and DETY for each event in the final _common_clean file
| Quadrant A | 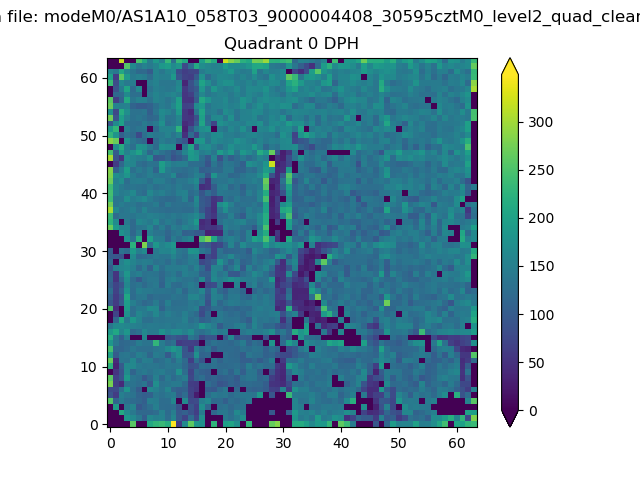 |
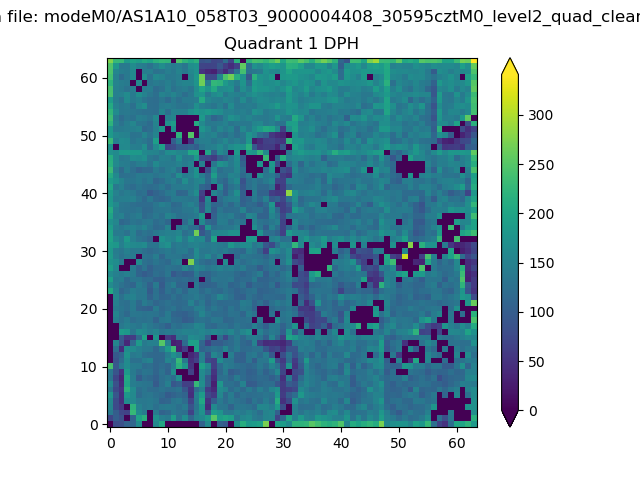 |
Quadrant B |
|---|---|---|---|
| Quadrant D | 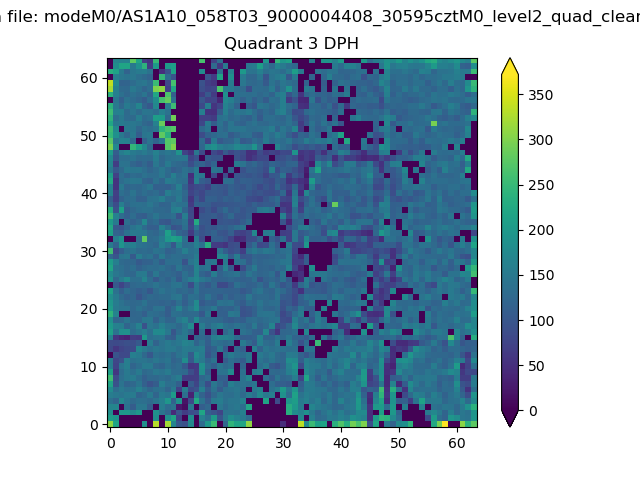 |
 |
Quadrant C |
| Plot type | Count rate plots | Images |
|---|---|---|
| Comparison with Poisson distribution Blue bars denote a histogram of data divided into 1 sec bins. Red curve is a Poisson curve with rate = median count rate of data. |
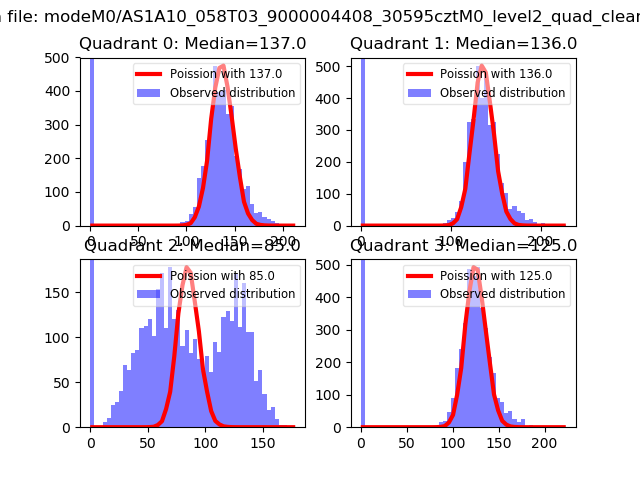 |
 |
| Quadrant-wise count rates Data is divided into 100 sec bins |
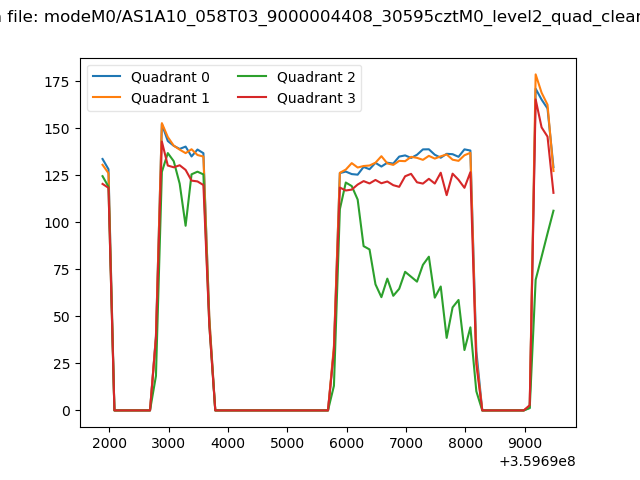 |
|
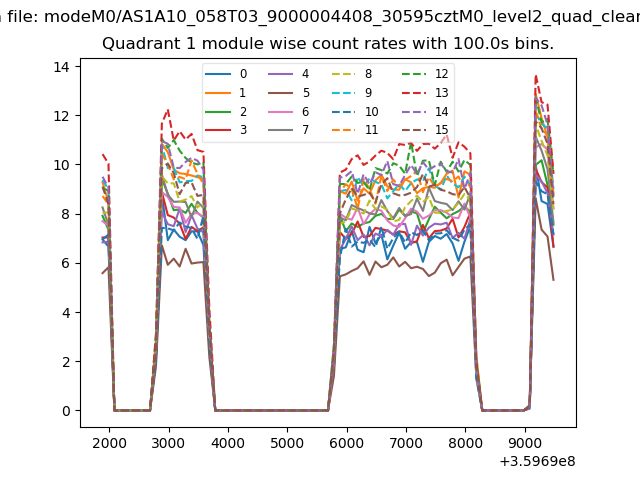
| Module-wise count rates for Quadrant A Data is divided into 100 sec bins |
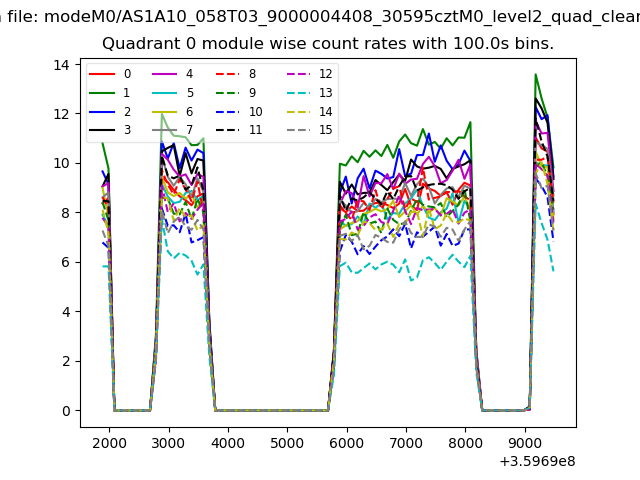 |
 |
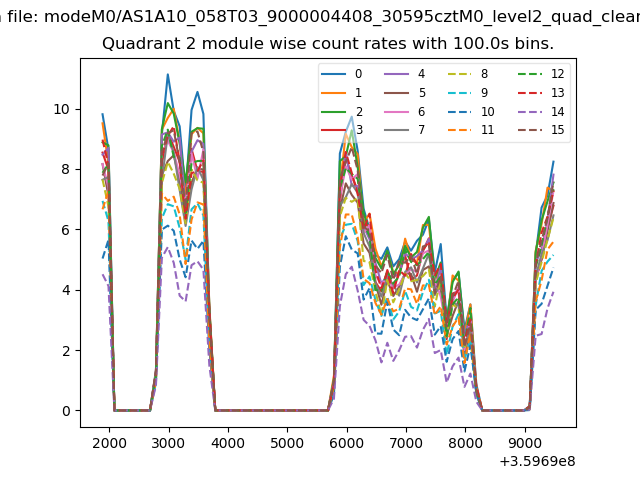
| Module-wise count rates for Quadrant B Data is divided into 100 sec bins |
 |
 |
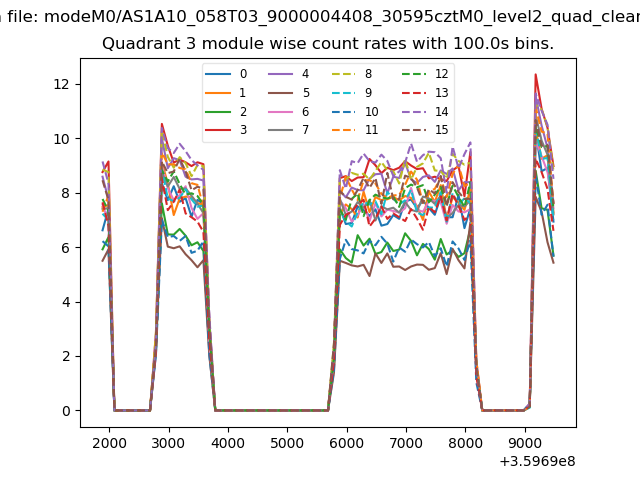
| Module-wise count rates for Quadrant C Data is divided into 100 sec bins |
 |
 |
| Module-wise count rates for Quadrant D Data is divided into 100 sec bins |
 |
 |
| Parameter | Plot |
|---|---|
| CZT HV Monitor | 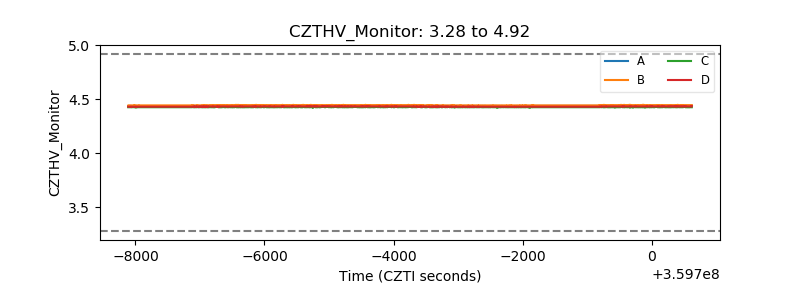 |
| D_VDD | 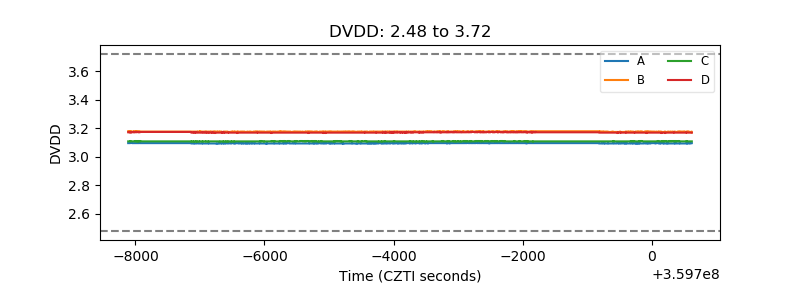 |
| Temperature 1 | 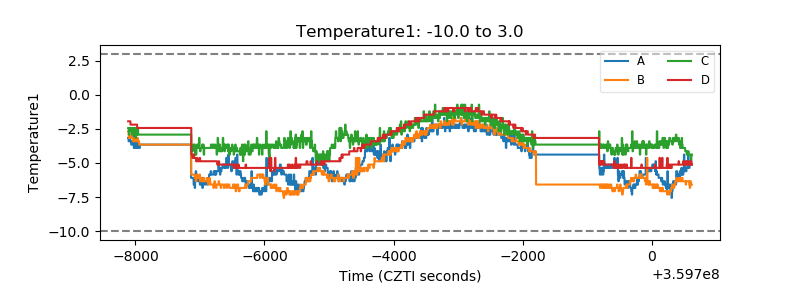 |
| Veto HV Monitor | 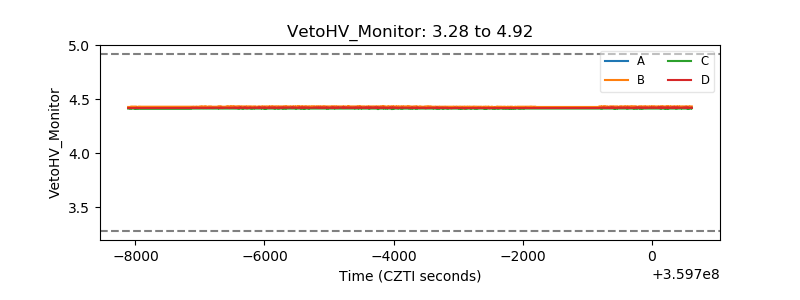 |
| Veto LLD | 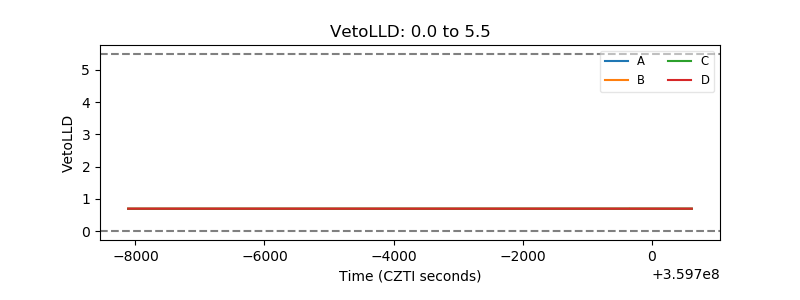 |
| Alpha Counter | 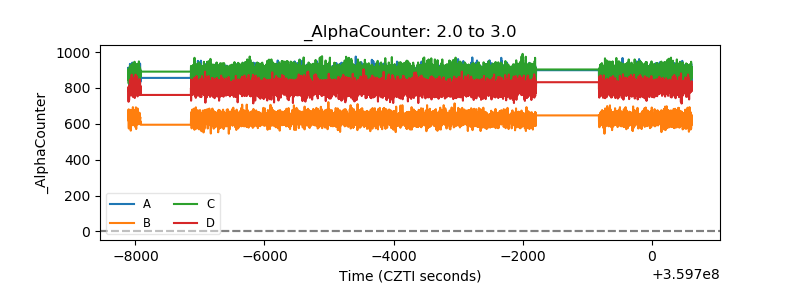 |
| _CPM_Rate | 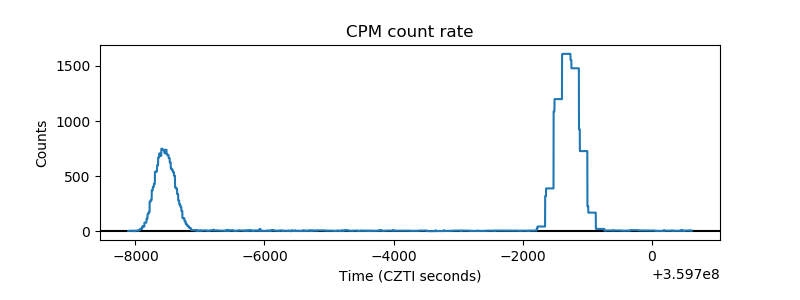 |
| CZT Counter | 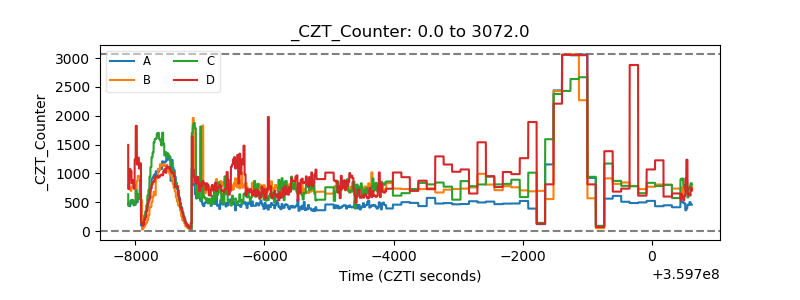 |
| +2.5 Volts monitor |  |
| +5 Volts monitor | 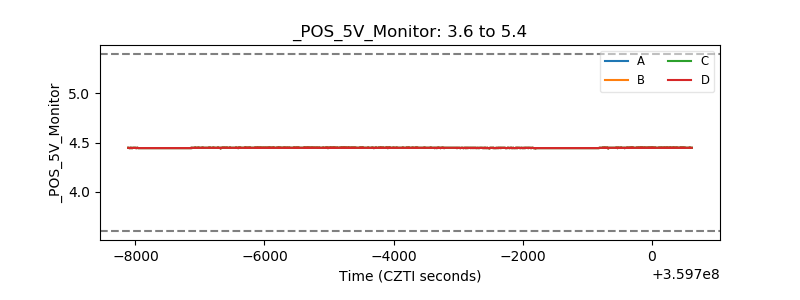 |
| _ROLL_ROT | 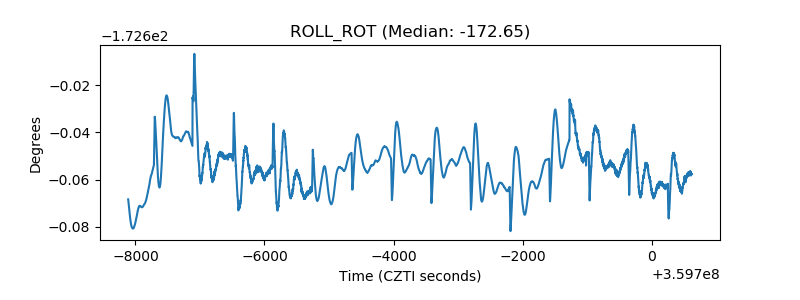 |
| _Roll_DEC | 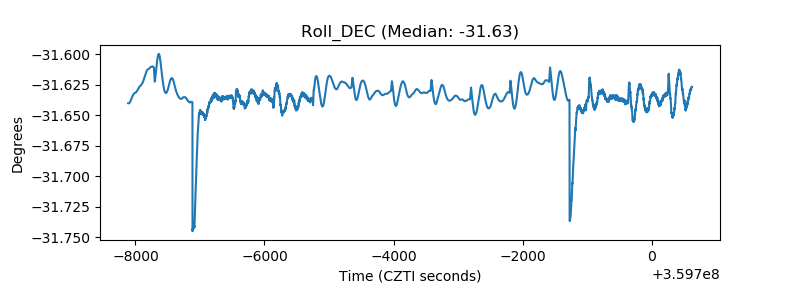 |
| _Roll_RA | 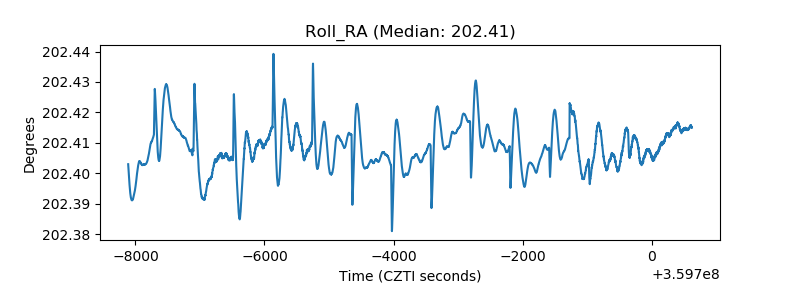 |
| Veto Counter | 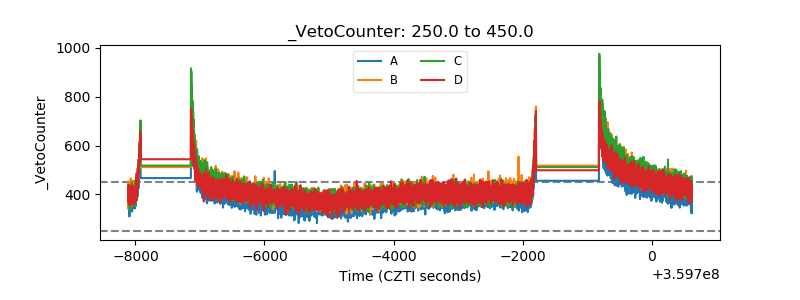 |