| Param | Original file | Final file |
|---|---|---|
| Filename | modeM0/AS1A10_058T03_9000004408_30597cztM0_level2.evt | modeM0/AS1A10_058T03_9000004408_30597cztM0_level2_quad_clean.evt |
| Size (bytes) | 645,436,800 | 66,548,160 |
| Size | 615.5 MB | 63.5 MB |
| Events in quadrant A | 3,273,787 | 414,282 |
| Events in quadrant B | 5,138,110 | 413,920 |
| Events in quadrant C | 4,641,020 | 352,027 |
| Events in quadrant D | 6,052,863 | 379,558 |
| Mode M0 | |||
|---|---|---|---|
| Quadrant | BADHDUFLAG | Total packets | Discarded packets |
| A | 0 | 13696 | 2 |
| B | 0 | 19908 | 2 |
| C | 0 | 18297 | 3 |
| D | 0 | 22874 | 2 |
| Mode SS | |||
|---|---|---|---|
| Quadrant | BADHDUFLAG | Total packets | Discarded packets |
| A | 0 | 130 | 0 |
| B | 0 | 130 | 0 |
| C | 0 | 130 | 0 |
| D | 0 | 130 | 0 |
| Mode M9 | |||
|---|---|---|---|
| Quadrant | BADHDUFLAG | Total packets | Discarded packets |
| A | 0 | 12 | 0 |
| B | 0 | 12 | 0 |
| C | 0 | 12 | 0 |
| D | 0 | 12 | 0 |
| Quadrant | Total seconds | Saturated seconds | Saturation percentage |
|---|---|---|---|
| A | 6528 | 33 | 0.505515% |
| B | 6528 | 106 | 1.623775% |
| C | 6528 | 1729 | 26.485907% |
| D | 6528 | 197 | 3.017770% |
Noise dominated data is calculated using 1-second bins in cleaned event files. If a bin has >2000 counts, and if more than 50% of those come from <1% of pixels, then it is considered to be noise-dominated and hence unusable.
| Quadrant | # 1 sec bins | Bins with >0 counts | Bins with >2000 counts | High rate bins dominated by noise | Noise dominated (total time) | Noise dominated (detector-on time) | Marked lightcurve |
|---|---|---|---|---|---|---|---|
| A | 7638 | 6529 | 0 | 0 | 0.00% | 0.00% | 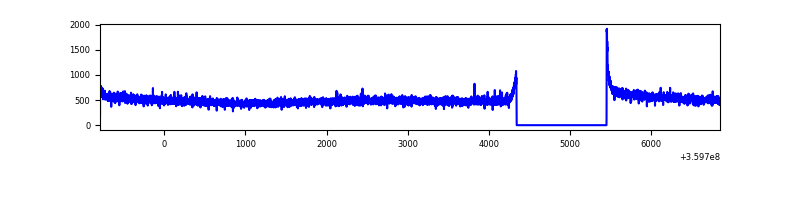 |
| B | 7638 | 6529 | 9 | 9 | 0.12% | 0.14% | 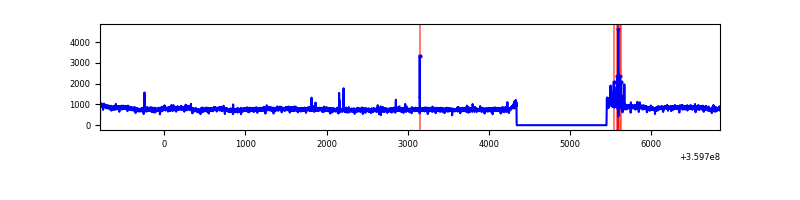 |
| C | 7638 | 6529 | 28 | 28 | 0.37% | 0.43% | 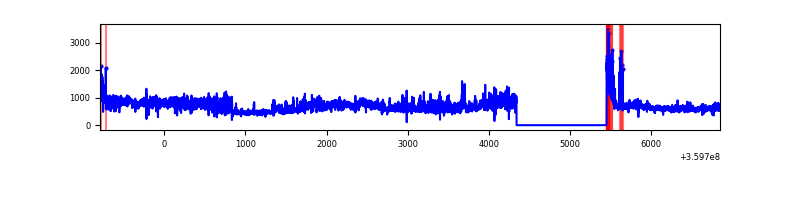 |
| D | 7638 | 6529 | 107 | 107 | 1.40% | 1.64% | 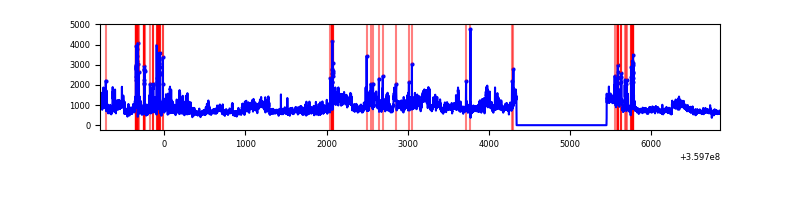 |
Top three noisy pixels from each quadrant. If the there are fewer than three noisy pixels in the level2.evt file, extra rows are filled as -1
| Pixel properties | Quadrant properties | ||||||
|---|---|---|---|---|---|---|---|
| Quadrant | DetID | PixID | Counts | Sigma | Mean | Median | Sigma |
| A | 8 | 192 | 11321 | 62.32 | 846 | 830 | 168.3 |
| A | 13 | 254 | 11297 | 62.18 | 846 | 830 | 168.3 |
| A | 3 | 137 | 8254 | 44.1 | 846 | 830 | 168.3 |
| B | 6 | 159 | 1784896 | 11140.68 | 841 | 821 | 160.1 |
| B | 0 | 229 | 29380 | 178.34 | 841 | 821 | 160.1 |
| B | 4 | 171 | 23667 | 142.66 | 841 | 821 | 160.1 |
| C | 14 | 254 | 751134 | 4365.91 | 736 | 741 | 171.9 |
| C | 14 | 238 | 699064 | 4062.96 | 736 | 741 | 171.9 |
| C | 0 | 10 | 181562 | 1052.05 | 736 | 741 | 171.9 |
| D | 8 | 195 | 2262974 | 11826.75 | 808 | 787 | 191.3 |
| D | 1 | 52 | 292981 | 1527.59 | 808 | 787 | 191.3 |
| D | 13 | 249 | 251743 | 1312.0 | 808 | 787 | 191.3 |
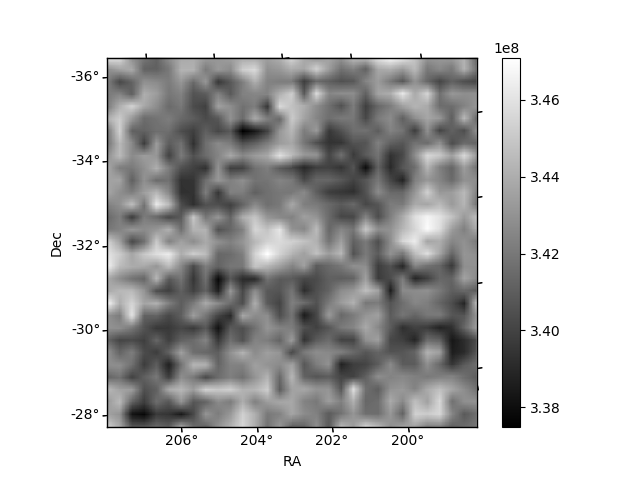
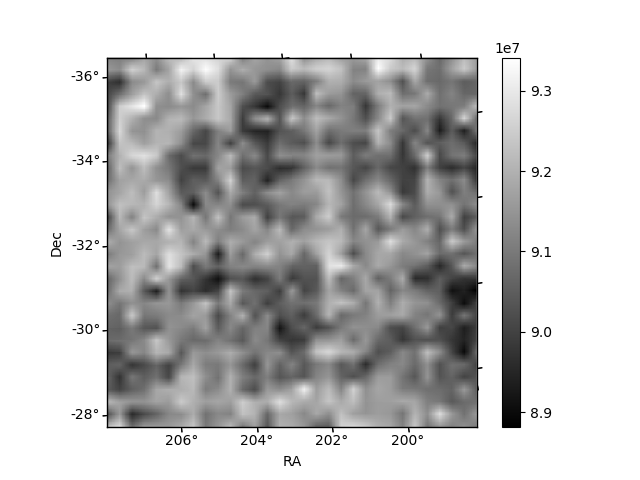
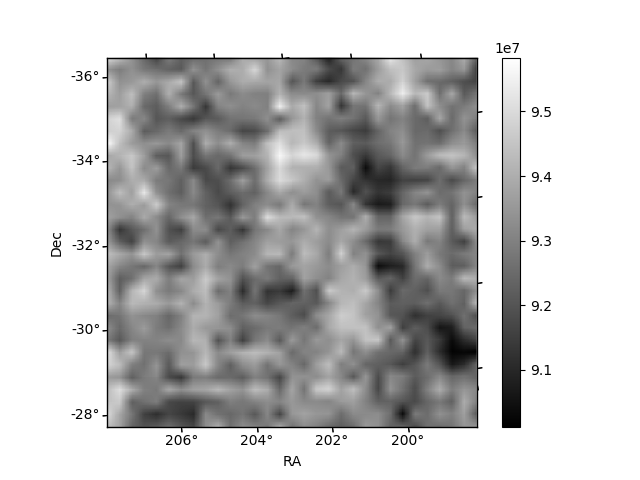
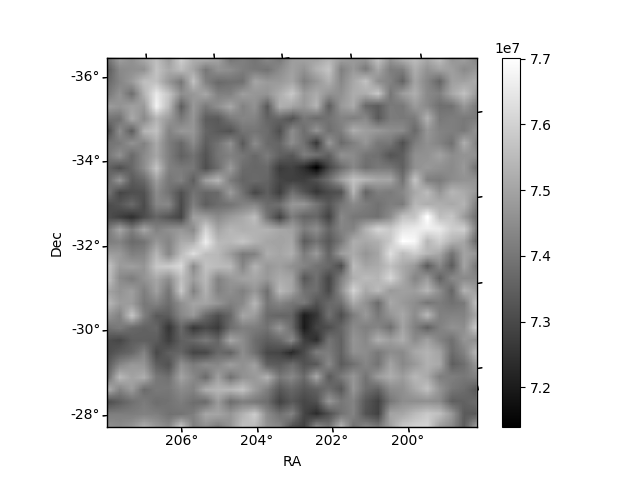
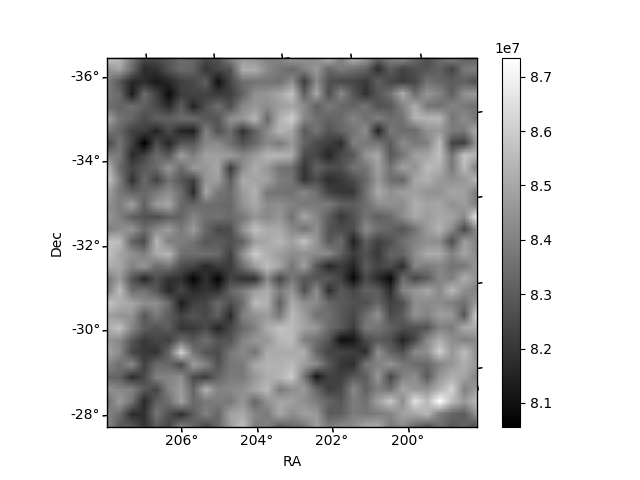
Histogram calculated using DETX and DETY for each event in the final _common_clean file
| Quadrant A | 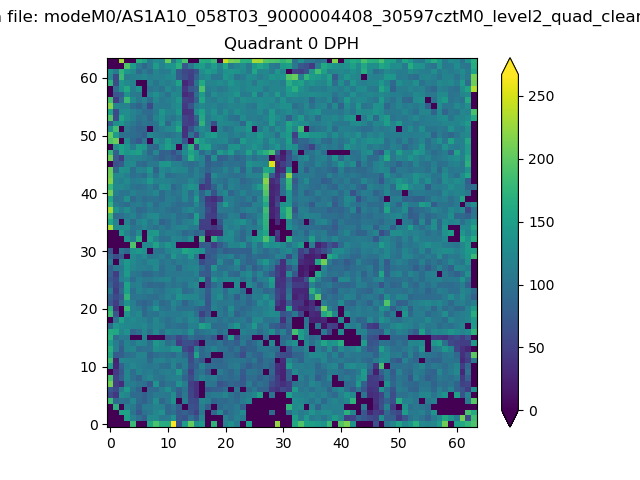 |
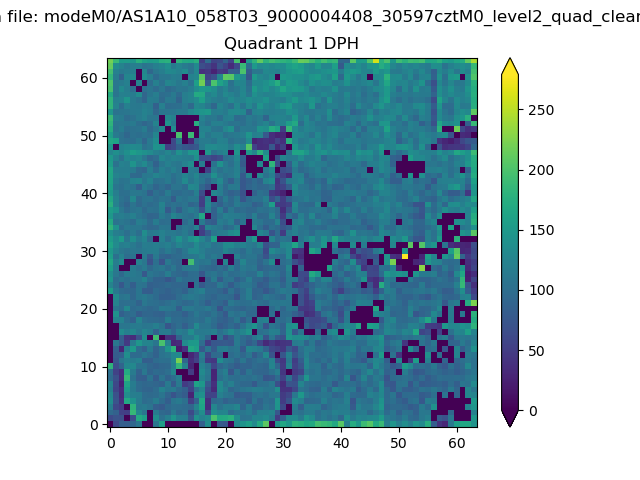 |
Quadrant B |
|---|---|---|---|
| Quadrant D | 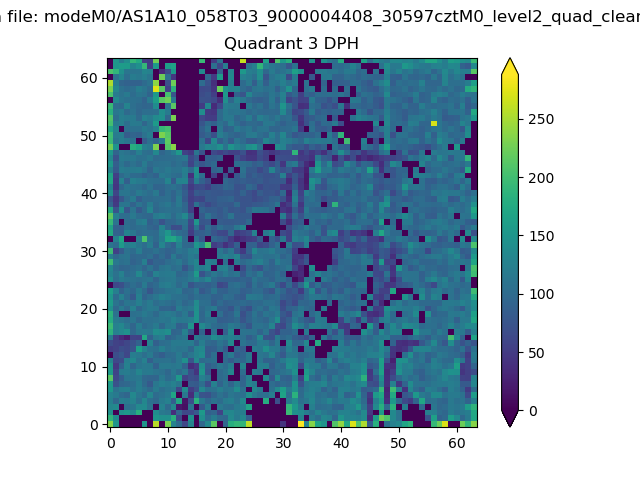 |
 |
Quadrant C |
| Plot type | Count rate plots | Images |
|---|---|---|
| Comparison with Poisson distribution Blue bars denote a histogram of data divided into 1 sec bins. Red curve is a Poisson curve with rate = median count rate of data. |
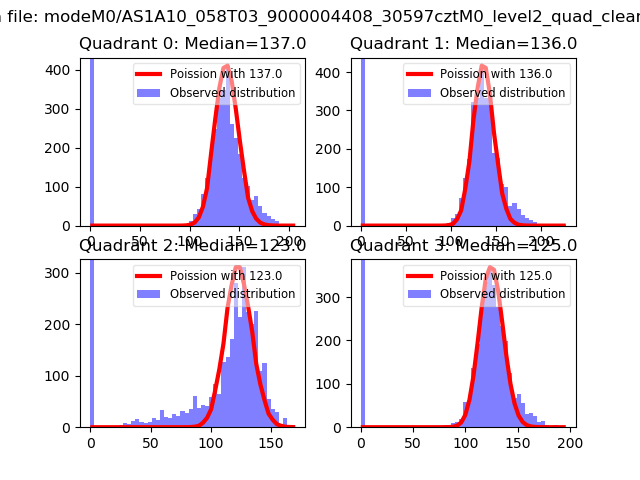 |
 |
| Quadrant-wise count rates Data is divided into 100 sec bins |
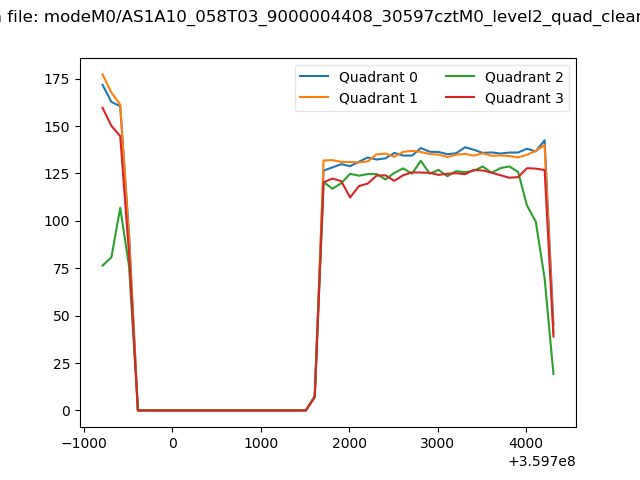 |
|
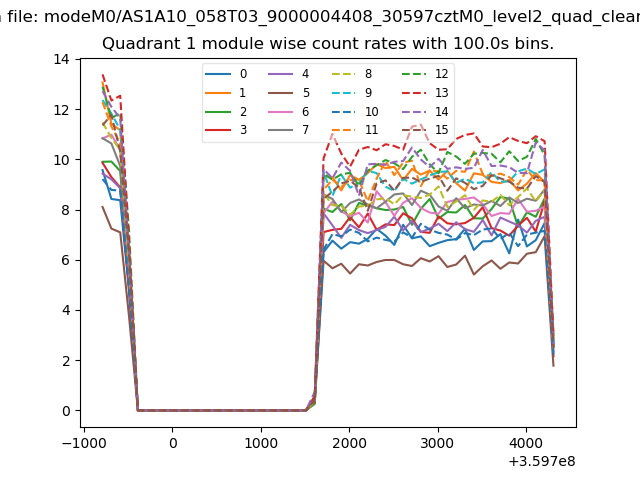
| Module-wise count rates for Quadrant A Data is divided into 100 sec bins |
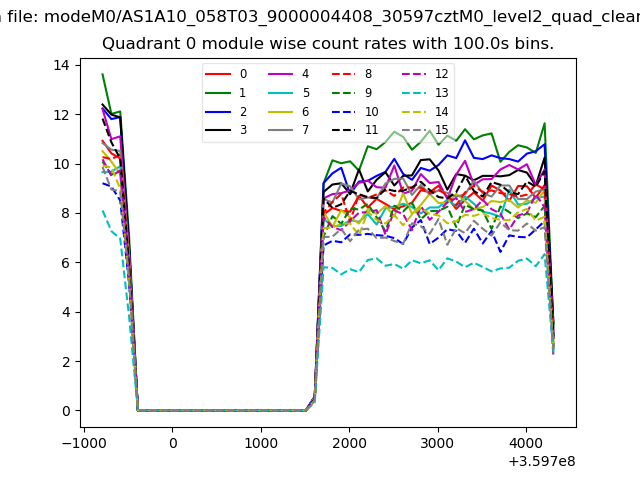 |
 |
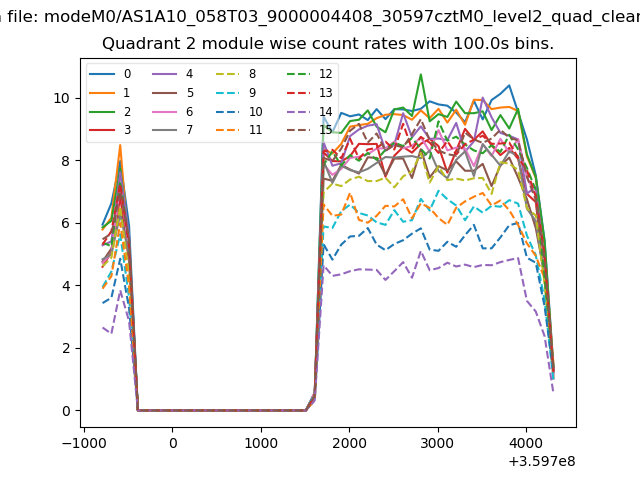
| Module-wise count rates for Quadrant B Data is divided into 100 sec bins |
 |
 |
| Module-wise count rates for Quadrant C Data is divided into 100 sec bins |
 |
 |
| Module-wise count rates for Quadrant D Data is divided into 100 sec bins |
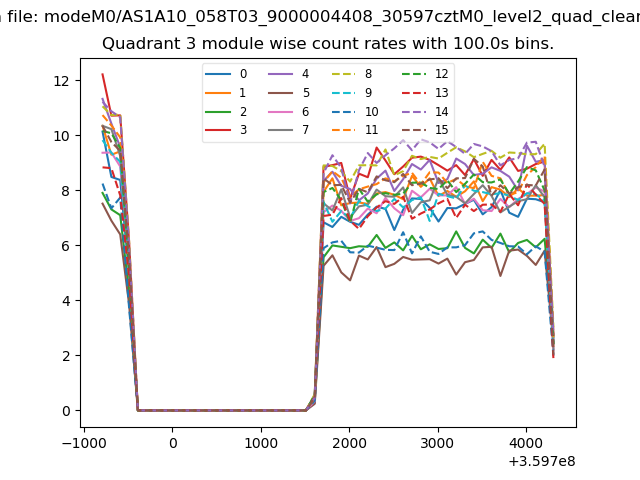 |
 |
| Parameter | Plot |
|---|---|
| CZT HV Monitor | 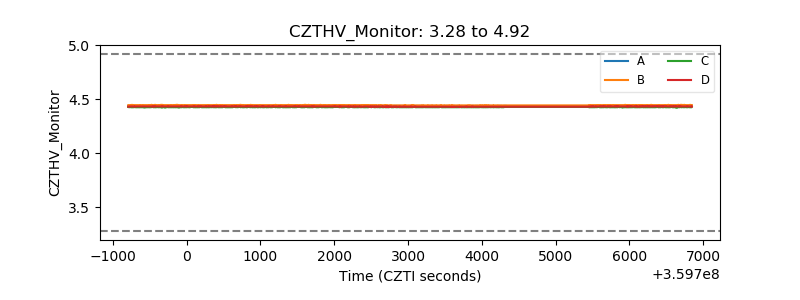 |
| D_VDD | 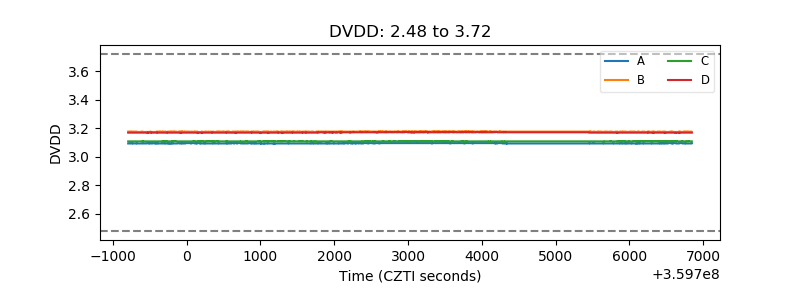 |
| Temperature 1 |  |
| Veto HV Monitor |  |
| Veto LLD |  |
| Alpha Counter | 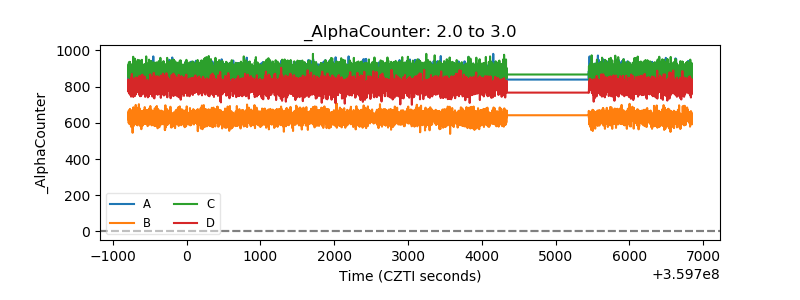 |
| _CPM_Rate | 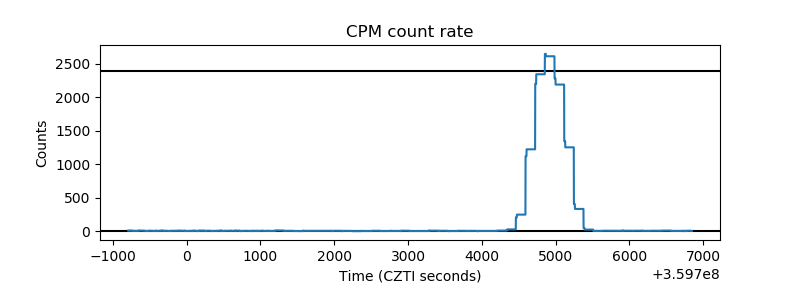 |
| CZT Counter |  |
| +2.5 Volts monitor |  |
| +5 Volts monitor | 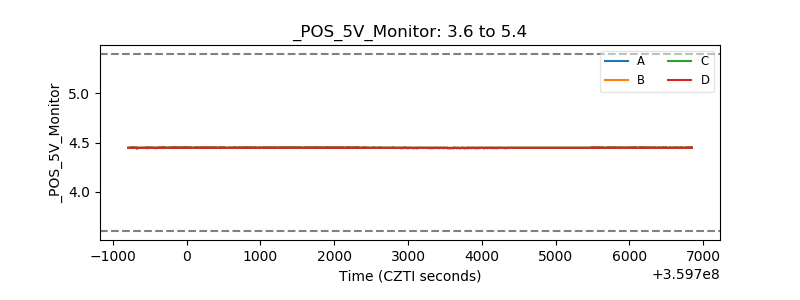 |
| _ROLL_ROT | 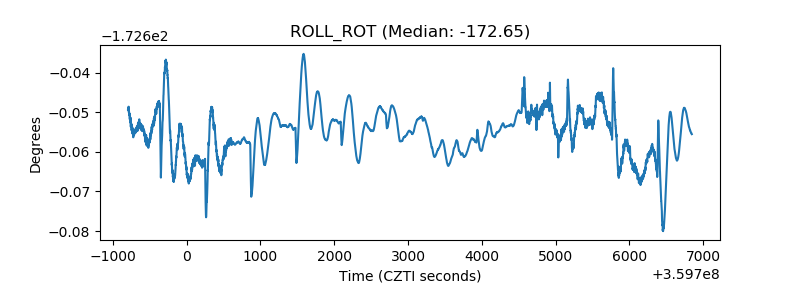 |
| _Roll_DEC | 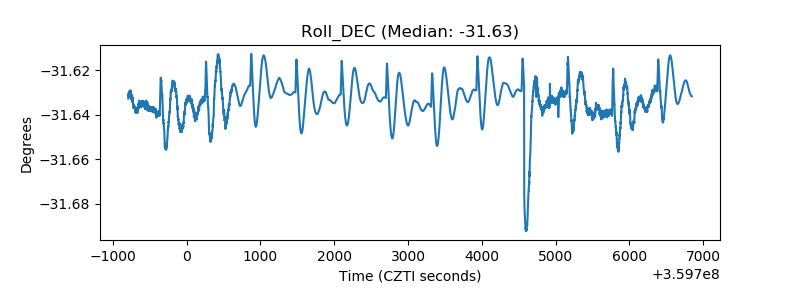 |
| _Roll_RA |  |
| Veto Counter | 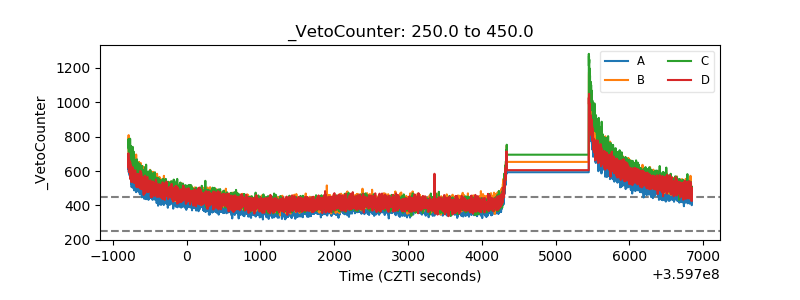 |