| Param | Original file | Final file |
|---|---|---|
| Filename | modeM0/AS1A10_058T03_9000004408_30598cztM0_level2.evt | modeM0/AS1A10_058T03_9000004408_30598cztM0_level2_quad_clean.evt |
| Size (bytes) | 624,718,080 | 68,048,640 |
| Size | 595.8 MB | 64.9 MB |
| Events in quadrant A | 3,431,943 | 418,927 |
| Events in quadrant B | 5,263,562 | 416,053 |
| Events in quadrant C | 4,015,182 | 394,859 |
| Events in quadrant D | 5,779,168 | 386,361 |
| Mode M0 | |||
|---|---|---|---|
| Quadrant | BADHDUFLAG | Total packets | Discarded packets |
| A | 0 | 14067 | 2 |
| B | 0 | 19891 | 3 |
| C | 0 | 16388 | 2 |
| D | 0 | 21785 | 2 |
| Mode SS | |||
|---|---|---|---|
| Quadrant | BADHDUFLAG | Total packets | Discarded packets |
| A | 0 | 130 | 0 |
| B | 0 | 130 | 0 |
| C | 0 | 130 | 0 |
| D | 0 | 130 | 0 |
| Mode M9 | |||
|---|---|---|---|
| Quadrant | BADHDUFLAG | Total packets | Discarded packets |
| A | 0 | 17 | 0 |
| B | 0 | 18 | 0 |
| C | 0 | 18 | 0 |
| D | 0 | 18 | 0 |
| Quadrant | Total seconds | Saturated seconds | Saturation percentage |
|---|---|---|---|
| A | 6361 | 60 | 0.943248% |
| B | 6360 | 173 | 2.720126% |
| C | 6360 | 371 | 5.833333% |
| D | 6360 | 121 | 1.902516% |
Noise dominated data is calculated using 1-second bins in cleaned event files. If a bin has >2000 counts, and if more than 50% of those come from <1% of pixels, then it is considered to be noise-dominated and hence unusable.
| Quadrant | # 1 sec bins | Bins with >0 counts | Bins with >2000 counts | High rate bins dominated by noise | Noise dominated (total time) | Noise dominated (detector-on time) | Marked lightcurve |
|---|---|---|---|---|---|---|---|
| A | 7606 | 6362 | 1 | 1 | 0.01% | 0.02% | 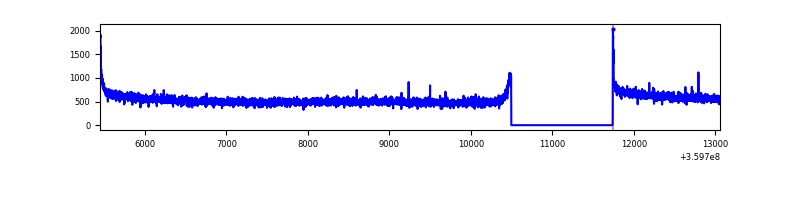 |
| B | 7605 | 6361 | 24 | 24 | 0.32% | 0.38% | 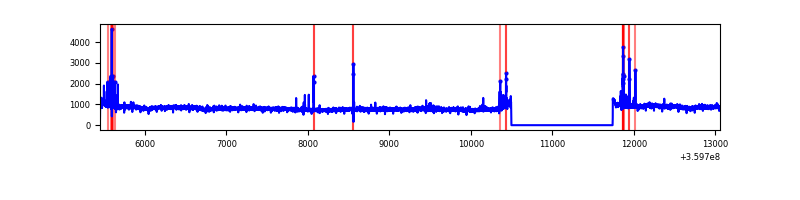 |
| C | 7605 | 6361 | 58 | 58 | 0.76% | 0.91% | 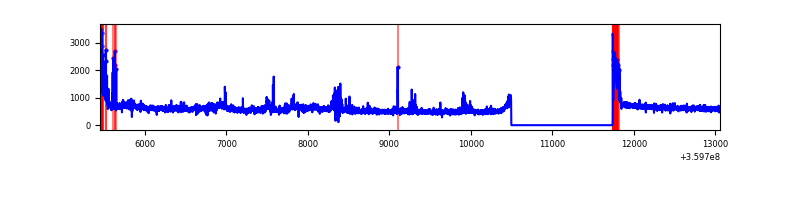 |
| D | 7605 | 6361 | 37 | 37 | 0.49% | 0.58% | 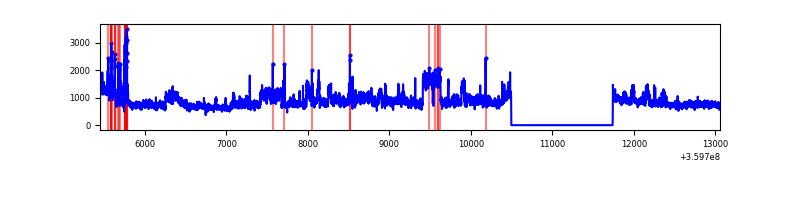 |
Top three noisy pixels from each quadrant. If the there are fewer than three noisy pixels in the level2.evt file, extra rows are filled as -1
| Pixel properties | Quadrant properties | ||||||
|---|---|---|---|---|---|---|---|
| Quadrant | DetID | PixID | Counts | Sigma | Mean | Median | Sigma |
| A | 8 | 192 | 22152 | 122.42 | 884 | 870 | 173.8 |
| A | 13 | 254 | 11232 | 59.61 | 884 | 870 | 173.8 |
| A | 3 | 137 | 8105 | 41.62 | 884 | 870 | 173.8 |
| B | 6 | 159 | 1702133 | 10546.86 | 872 | 855 | 161.3 |
| B | 4 | 171 | 77904 | 477.65 | 872 | 855 | 161.3 |
| B | 0 | 229 | 50570 | 308.2 | 872 | 855 | 161.3 |
| C | 14 | 238 | 259703 | 1352.0 | 833 | 842 | 191.5 |
| C | 0 | 10 | 244960 | 1275.0 | 833 | 842 | 191.5 |
| C | 14 | 254 | 158205 | 821.89 | 833 | 842 | 191.5 |
| D | 8 | 195 | 2235249 | 11234.91 | 852 | 832 | 198.9 |
| D | 1 | 52 | 113235 | 565.17 | 852 | 832 | 198.9 |
| D | 13 | 249 | 106225 | 529.93 | 852 | 832 | 198.9 |
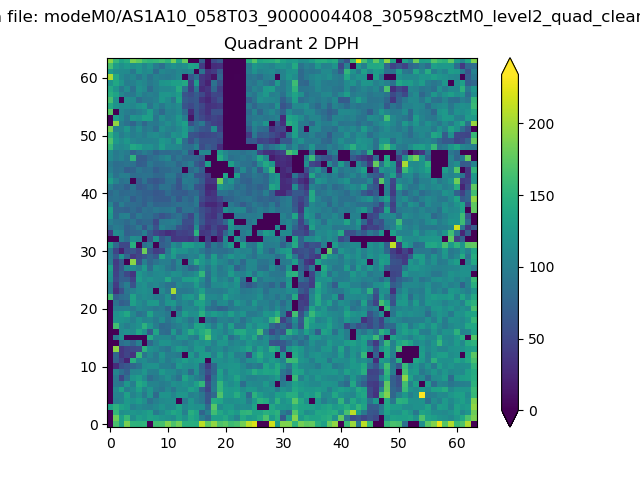
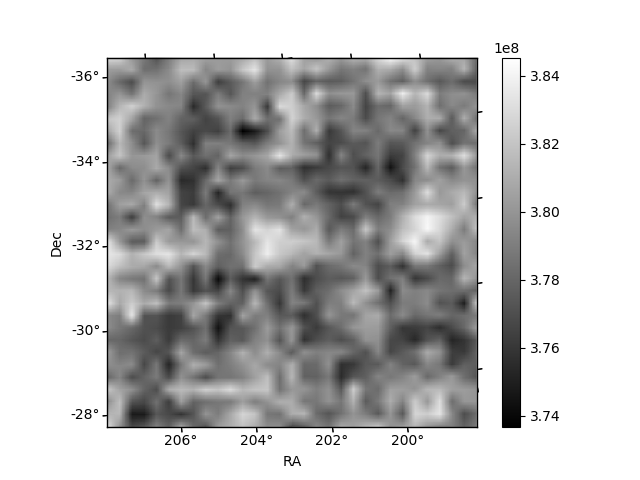
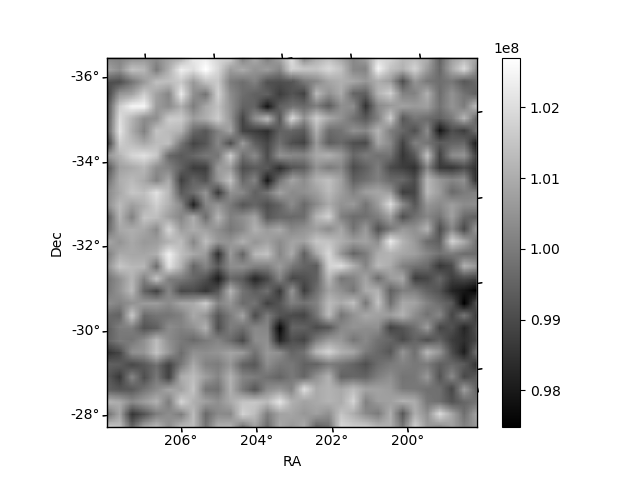
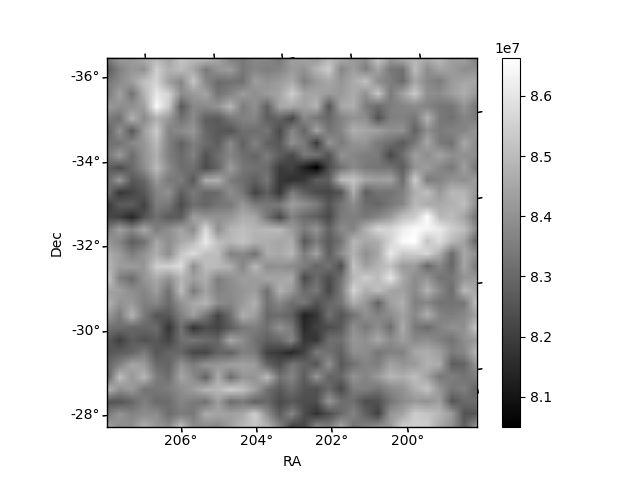
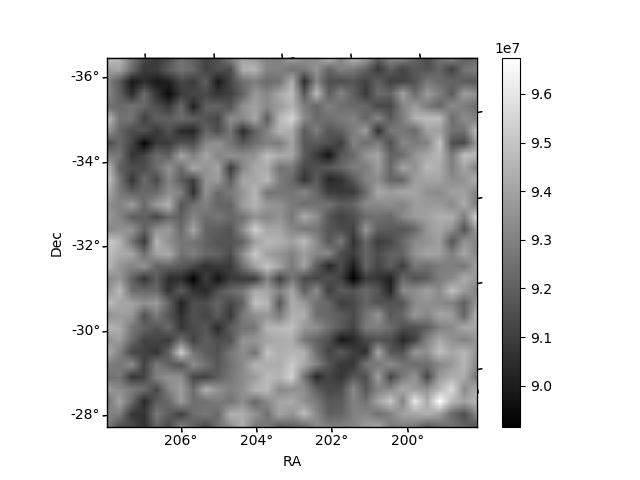
Histogram calculated using DETX and DETY for each event in the final _common_clean file
| Quadrant A | 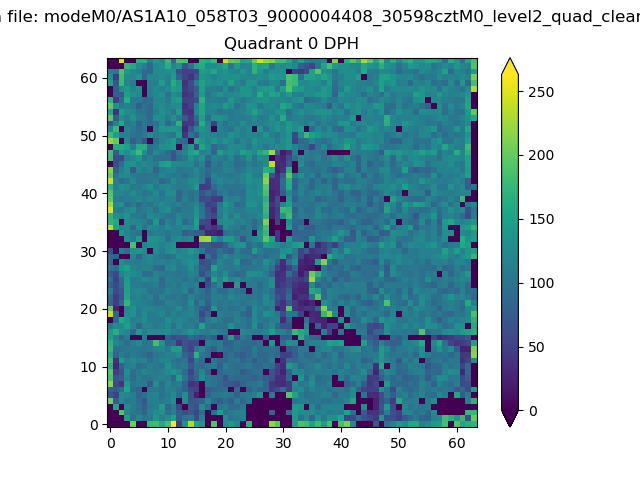 |
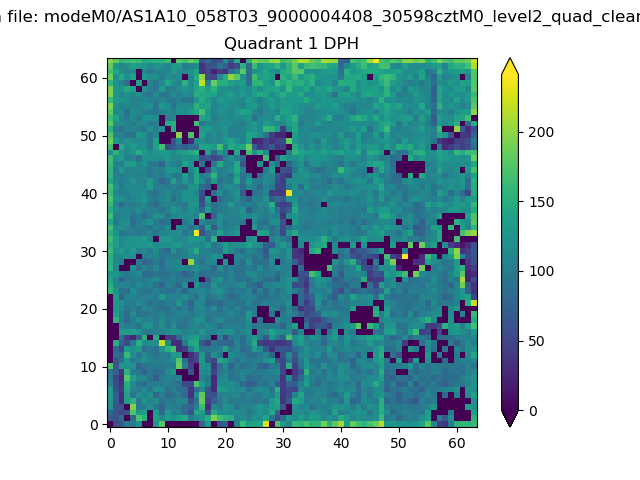 |
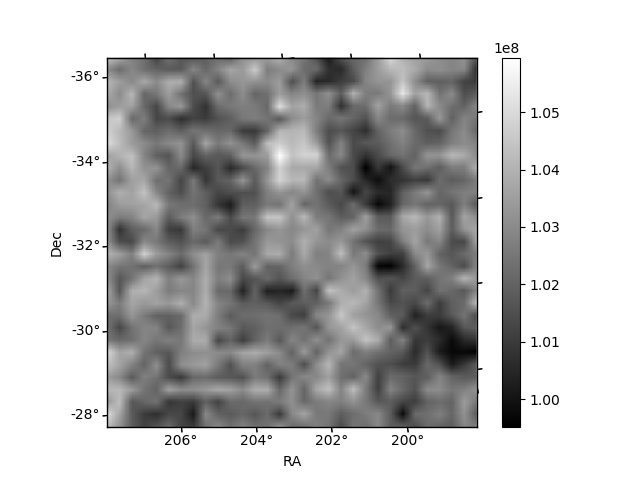
Quadrant B |
|---|---|---|---|
| Quadrant D | 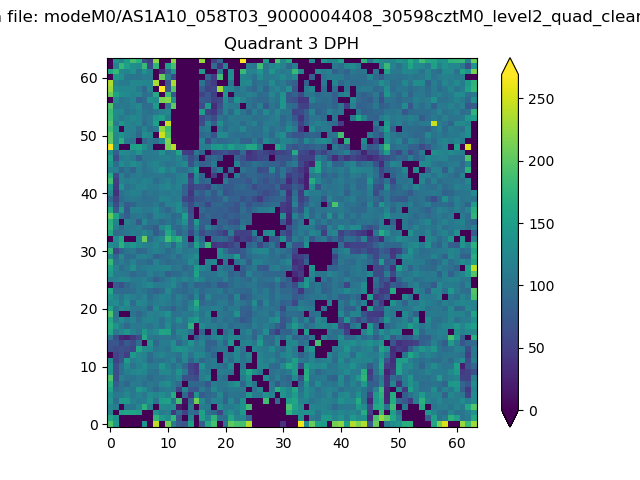 |
 |
Quadrant C |
| Plot type | Count rate plots | Images |
|---|---|---|
| Comparison with Poisson distribution Blue bars denote a histogram of data divided into 1 sec bins. Red curve is a Poisson curve with rate = median count rate of data. |
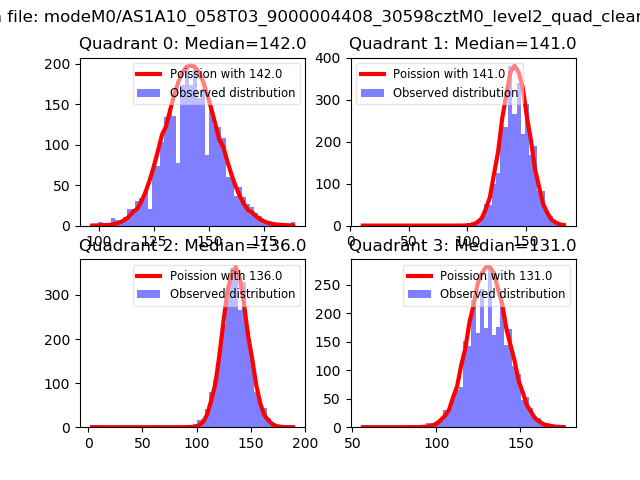 |
 |
| Quadrant-wise count rates Data is divided into 100 sec bins |
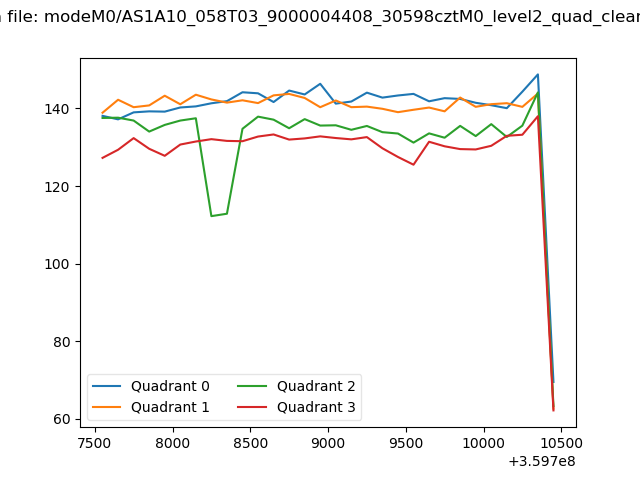 |
|
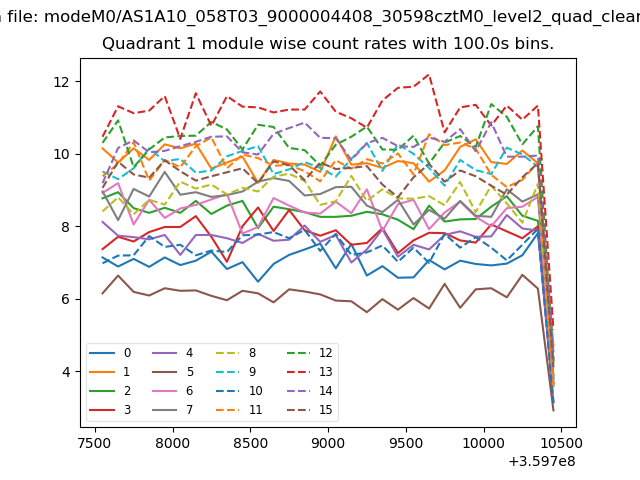
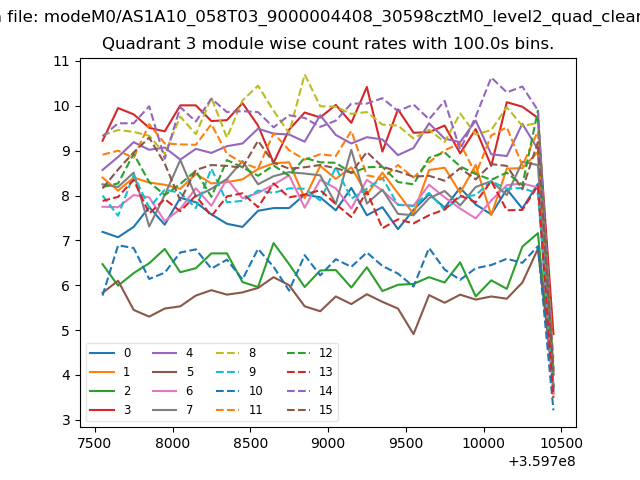
| Module-wise count rates for Quadrant A Data is divided into 100 sec bins |
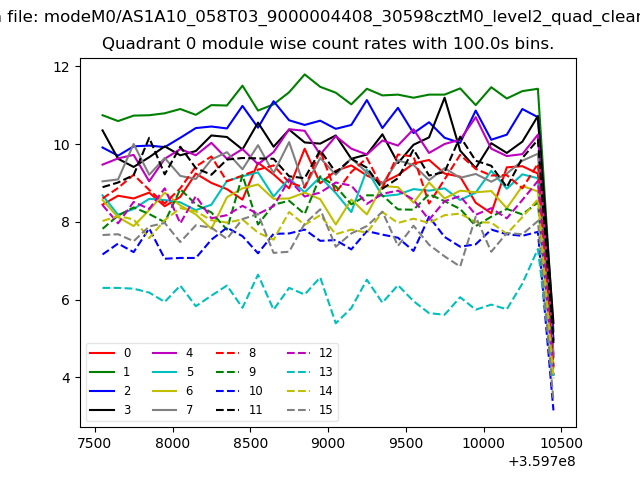 |
 |
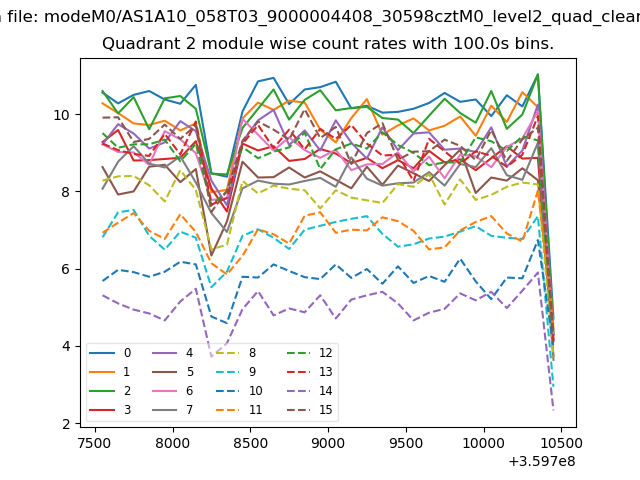
| Module-wise count rates for Quadrant B Data is divided into 100 sec bins |
 |
 |
| Module-wise count rates for Quadrant C Data is divided into 100 sec bins |
 |
 |
| Module-wise count rates for Quadrant D Data is divided into 100 sec bins |
 |
 |
| Parameter | Plot |
|---|---|
| CZT HV Monitor | 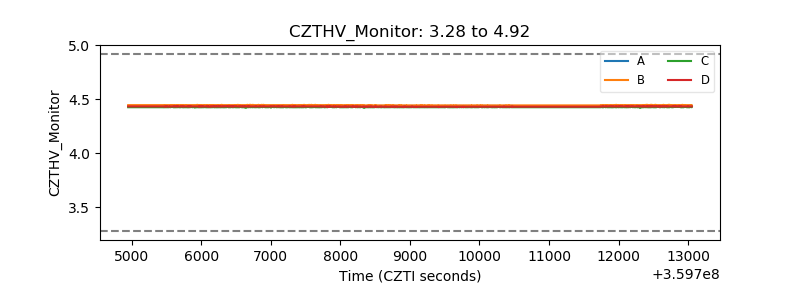 |
| D_VDD | 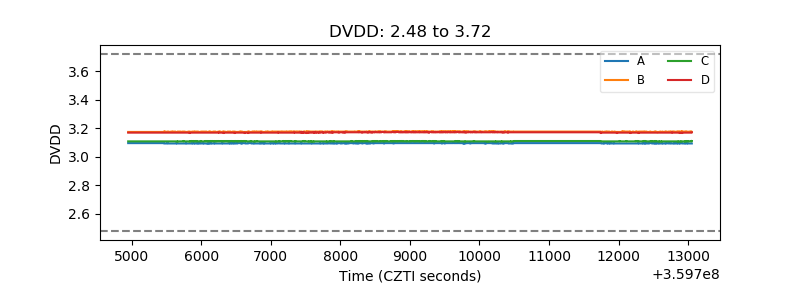 |
| Temperature 1 | 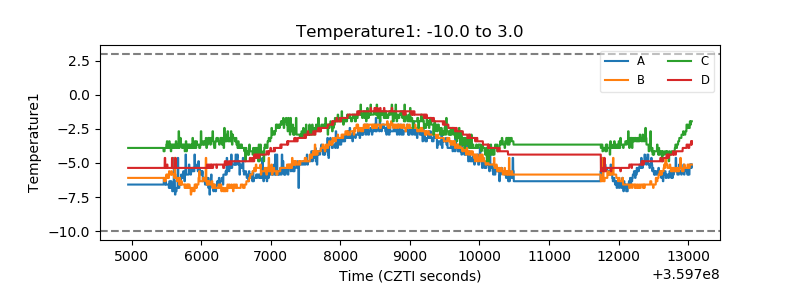 |
| Veto HV Monitor | 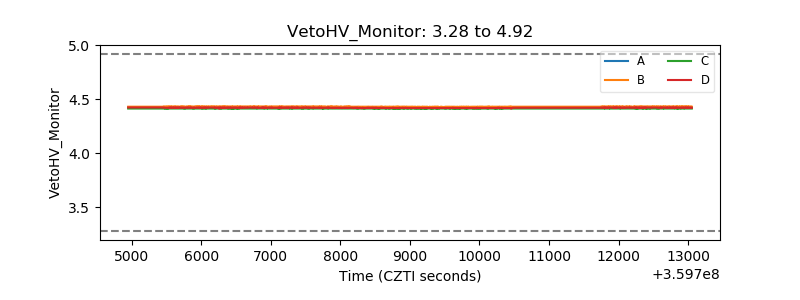 |
| Veto LLD | 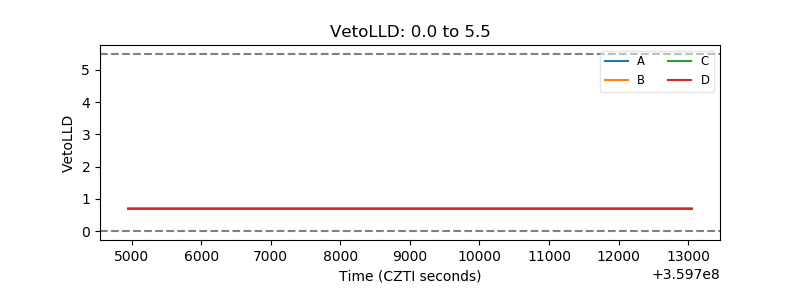 |
| Alpha Counter | 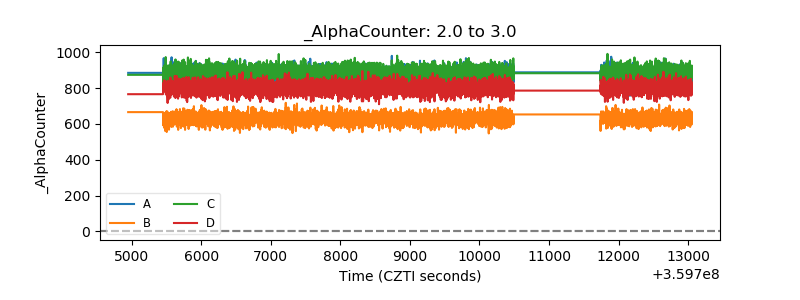 |
| _CPM_Rate | 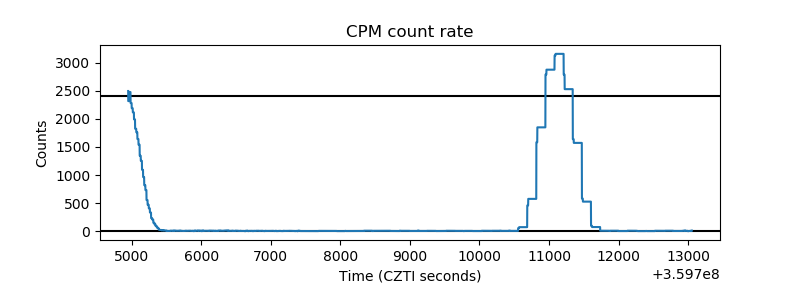 |
| CZT Counter | 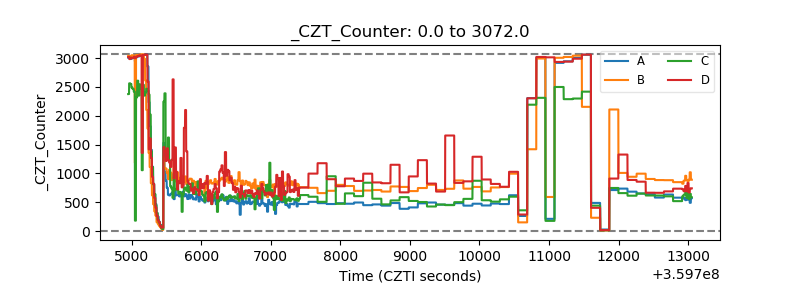 |
| +2.5 Volts monitor |  |
| +5 Volts monitor |  |
| _ROLL_ROT | 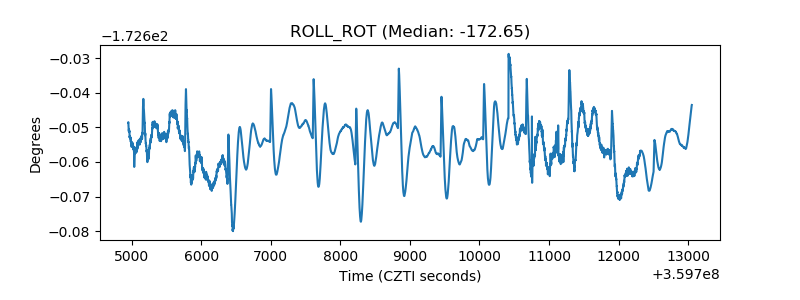 |
| _Roll_DEC | 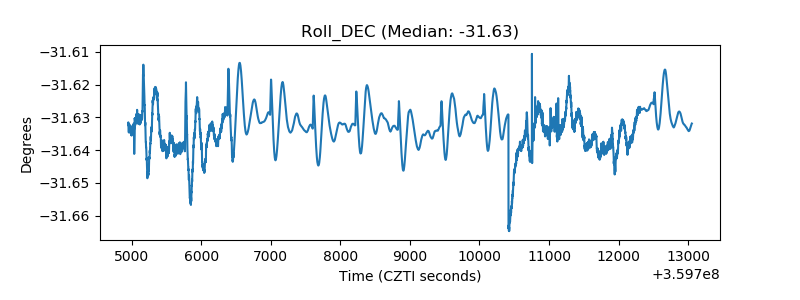 |
| _Roll_RA | 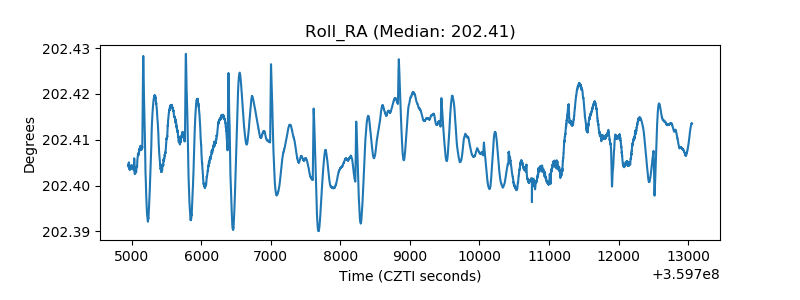 |
| Veto Counter | 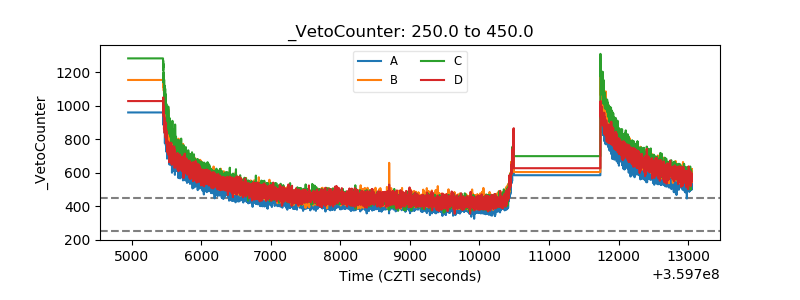 |