| Param | Original file | Final file |
|---|---|---|
| Filename | modeM0/AS1A10_058T03_9000004408_30599cztM0_level2.evt | modeM0/AS1A10_058T03_9000004408_30599cztM0_level2_quad_clean.evt |
| Size (bytes) | 639,100,800 | 77,610,240 |
| Size | 609.5 MB | 74.0 MB |
| Events in quadrant A | 3,534,305 | 497,352 |
| Events in quadrant B | 5,264,916 | 495,892 |
| Events in quadrant C | 4,018,600 | 466,857 |
| Events in quadrant D | 6,118,642 | 456,664 |
| Mode M0 | |||
|---|---|---|---|
| Quadrant | BADHDUFLAG | Total packets | Discarded packets |
| A | 0 | 14415 | 2 |
| B | 0 | 19780 | 2 |
| C | 0 | 16220 | 2 |
| D | 0 | 22436 | 2 |
| Mode SS | |||
|---|---|---|---|
| Quadrant | BADHDUFLAG | Total packets | Discarded packets |
| A | 0 | 128 | 0 |
| B | 0 | 128 | 0 |
| C | 0 | 128 | 0 |
| D | 0 | 128 | 0 |
| Mode M9 | |||
|---|---|---|---|
| Quadrant | BADHDUFLAG | Total packets | Discarded packets |
| A | 0 | 23 | 0 |
| B | 0 | 24 | 0 |
| C | 0 | 24 | 0 |
| D | 0 | 24 | 0 |
| Quadrant | Total seconds | Saturated seconds | Saturation percentage |
|---|---|---|---|
| A | 6199 | 70 | 1.129214% |
| B | 6199 | 165 | 2.661720% |
| C | 6199 | 443 | 7.146314% |
| D | 6199 | 135 | 2.177771% |
Noise dominated data is calculated using 1-second bins in cleaned event files. If a bin has >2000 counts, and if more than 50% of those come from <1% of pixels, then it is considered to be noise-dominated and hence unusable.
| Quadrant | # 1 sec bins | Bins with >0 counts | Bins with >2000 counts | High rate bins dominated by noise | Noise dominated (total time) | Noise dominated (detector-on time) | Marked lightcurve |
|---|---|---|---|---|---|---|---|
| A | 7514 | 6200 | 1 | 1 | 0.01% | 0.02% | 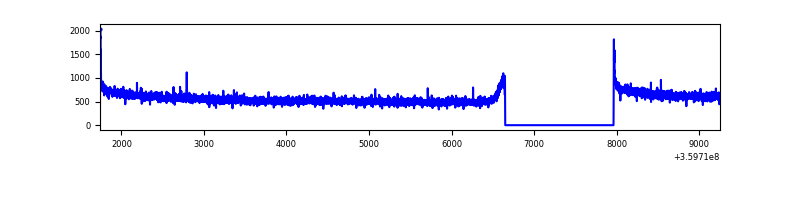 |
| B | 7514 | 6200 | 18 | 18 | 0.24% | 0.29% | 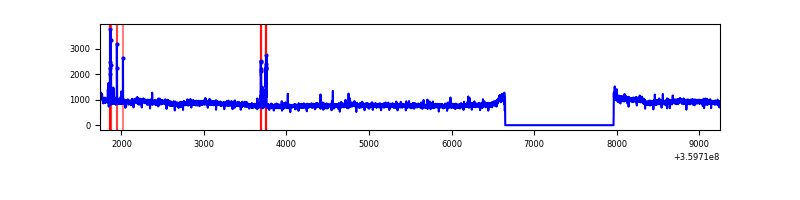 |
| C | 7514 | 6200 | 70 | 70 | 0.93% | 1.13% | 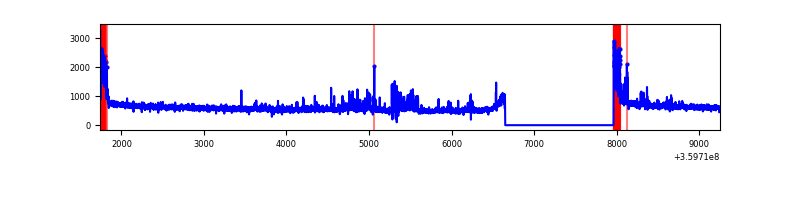 |
| D | 7514 | 6200 | 72 | 72 | 0.96% | 1.16% | 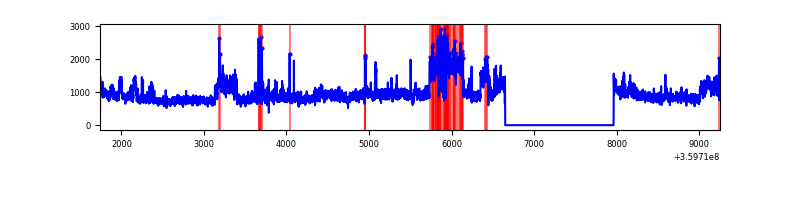 |
Top three noisy pixels from each quadrant. If the there are fewer than three noisy pixels in the level2.evt file, extra rows are filled as -1
| Pixel properties | Quadrant properties | ||||||
|---|---|---|---|---|---|---|---|
| Quadrant | DetID | PixID | Counts | Sigma | Mean | Median | Sigma |
| A | 8 | 192 | 21989 | 118.66 | 911 | 900 | 177.7 |
| A | 13 | 254 | 11307 | 58.56 | 911 | 900 | 177.7 |
| A | 3 | 137 | 8028 | 40.11 | 911 | 900 | 177.7 |
| B | 6 | 159 | 1657760 | 10177.56 | 893 | 875 | 162.8 |
| B | 4 | 171 | 67888 | 411.63 | 893 | 875 | 162.8 |
| B | 0 | 229 | 20358 | 119.68 | 893 | 875 | 162.8 |
| C | 0 | 10 | 246686 | 1265.06 | 853 | 864 | 194.3 |
| C | 14 | 238 | 210322 | 1077.92 | 853 | 864 | 194.3 |
| C | 14 | 254 | 89084 | 454.0 | 853 | 864 | 194.3 |
| D | 8 | 195 | 2474203 | 12028.69 | 880 | 860 | 205.6 |
| D | 5 | 222 | 214583 | 1039.41 | 880 | 860 | 205.6 |
| D | 1 | 52 | 52772 | 252.47 | 880 | 860 | 205.6 |
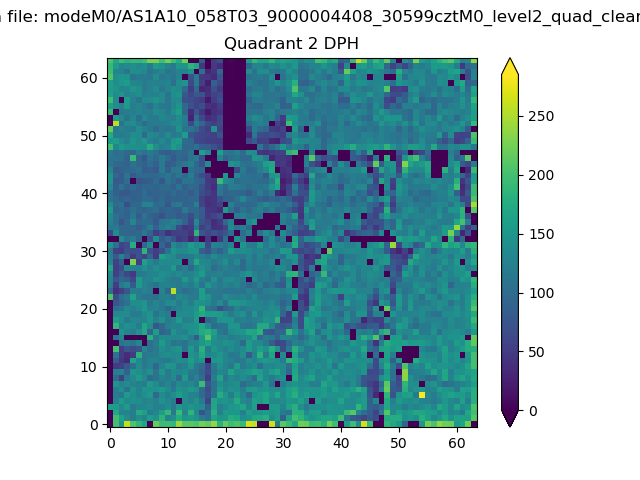
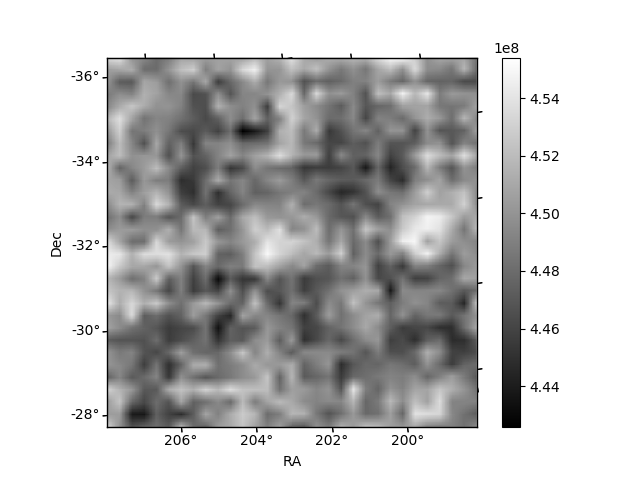
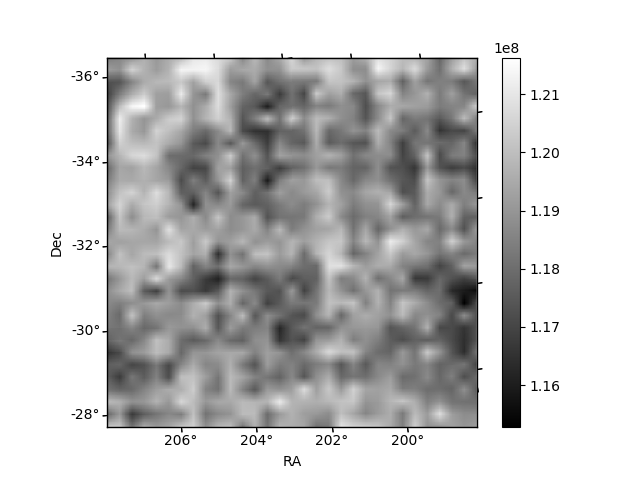
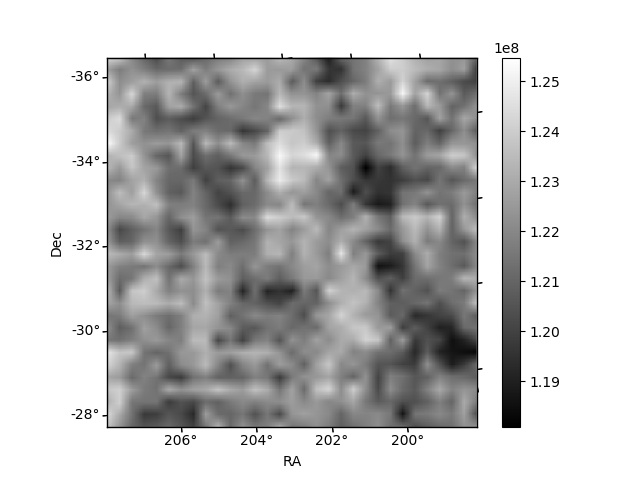
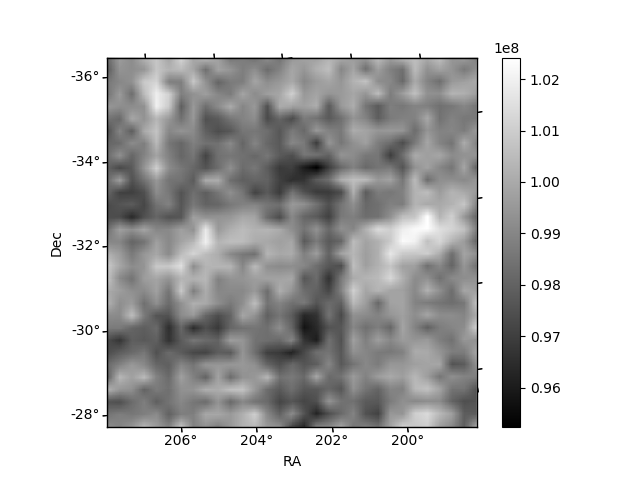
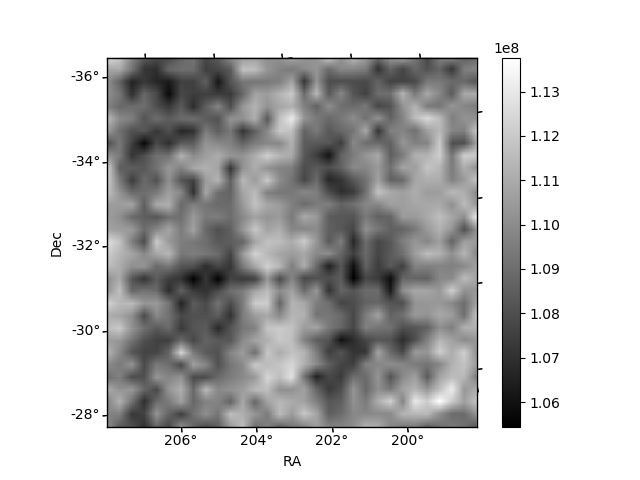
Histogram calculated using DETX and DETY for each event in the final _common_clean file
| Quadrant A | 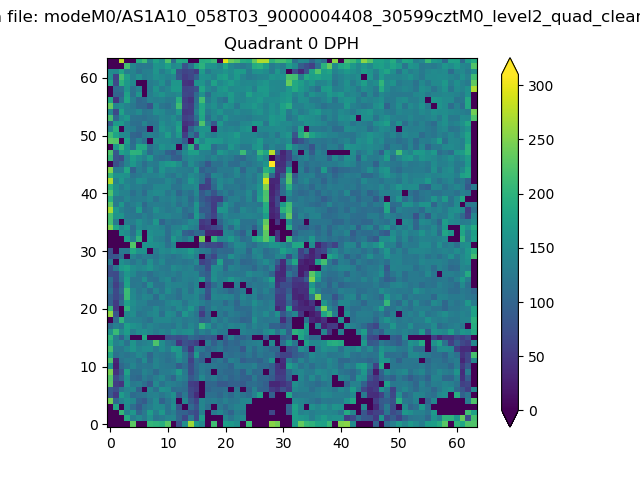 |
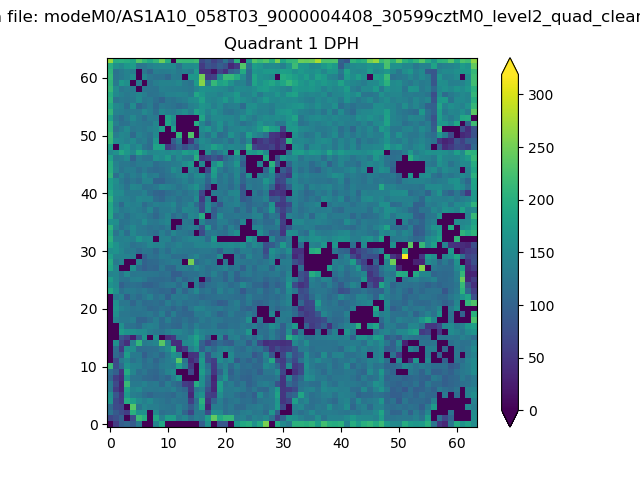 |
Quadrant B |
|---|---|---|---|
| Quadrant D | 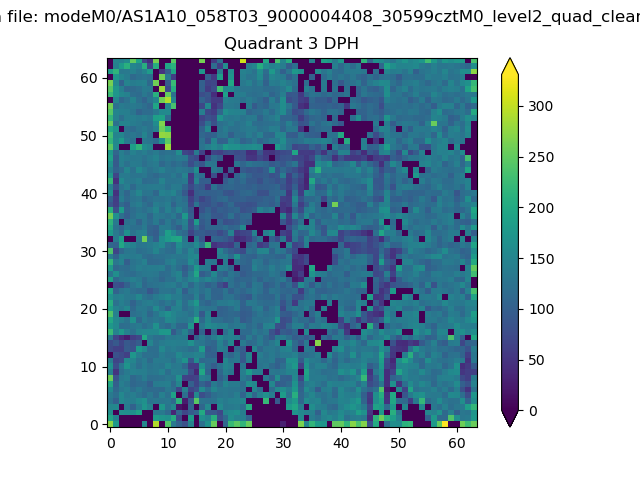 |
 |
Quadrant C |
| Plot type | Count rate plots | Images |
|---|---|---|
| Comparison with Poisson distribution Blue bars denote a histogram of data divided into 1 sec bins. Red curve is a Poisson curve with rate = median count rate of data. |
 |
 |
| Quadrant-wise count rates Data is divided into 100 sec bins |
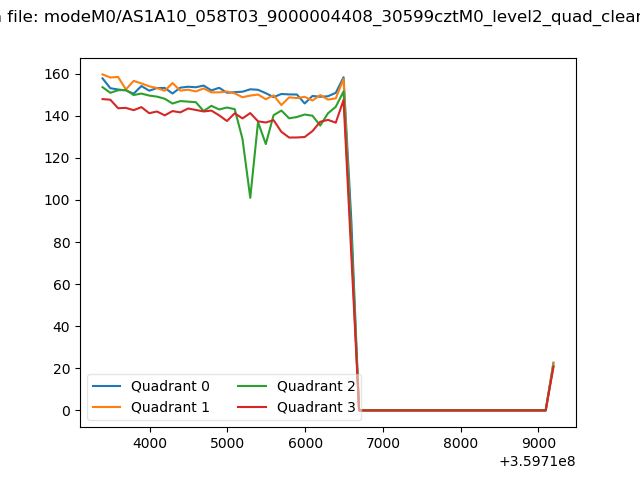 |
|
| Module-wise count rates for Quadrant A Data is divided into 100 sec bins |
 |
 |
| Module-wise count rates for Quadrant B Data is divided into 100 sec bins |
 |
 |
| Module-wise count rates for Quadrant C Data is divided into 100 sec bins |
 |
 |
| Module-wise count rates for Quadrant D Data is divided into 100 sec bins |
 |
 |
| Parameter | Plot |
|---|---|
| CZT HV Monitor |  |
| D_VDD | 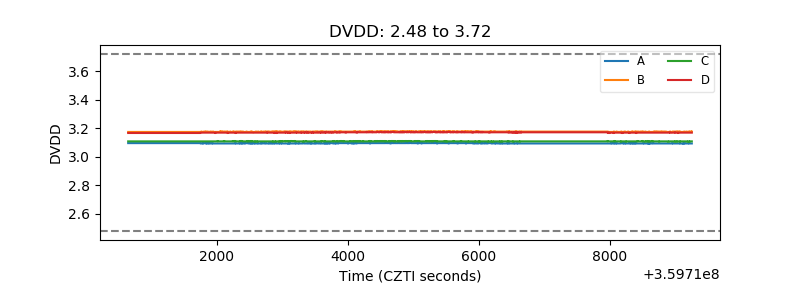 |
| Temperature 1 | 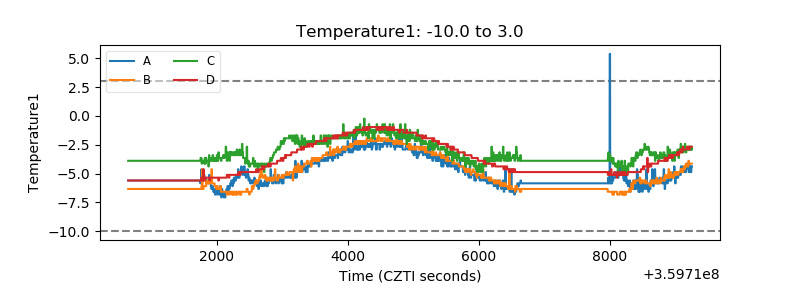 |
| Veto HV Monitor | 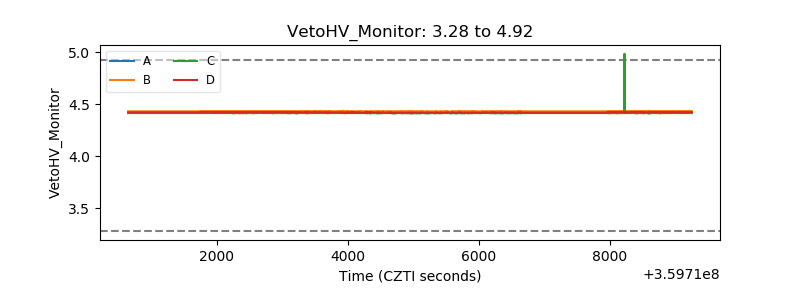 |
| Veto LLD | 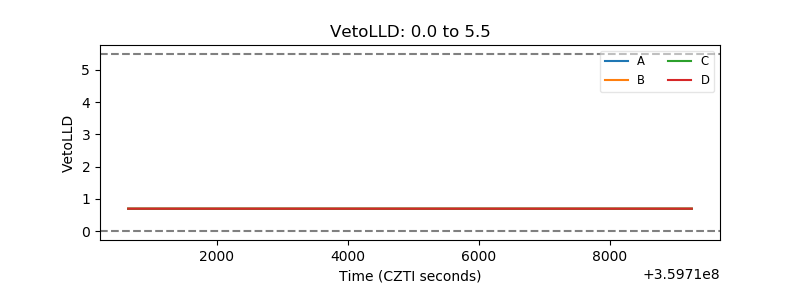 |
| Alpha Counter | 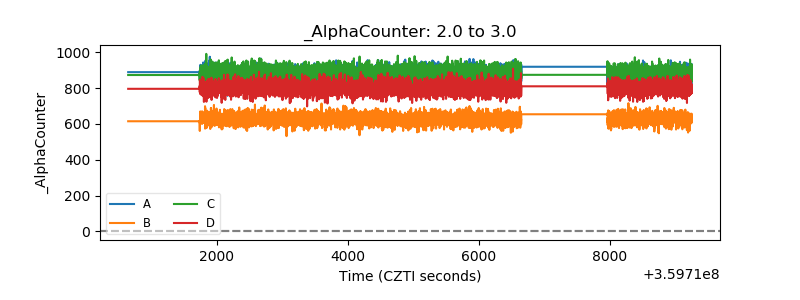 |
| _CPM_Rate | 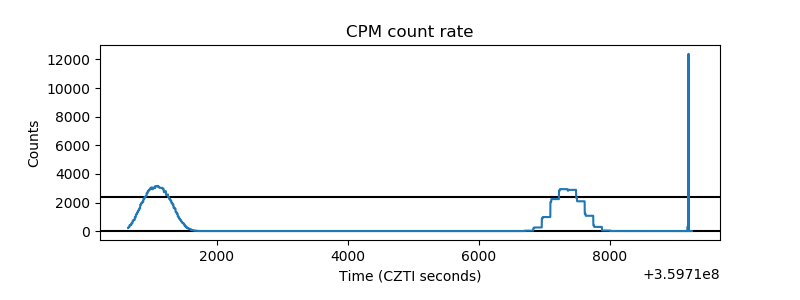 |
| CZT Counter | 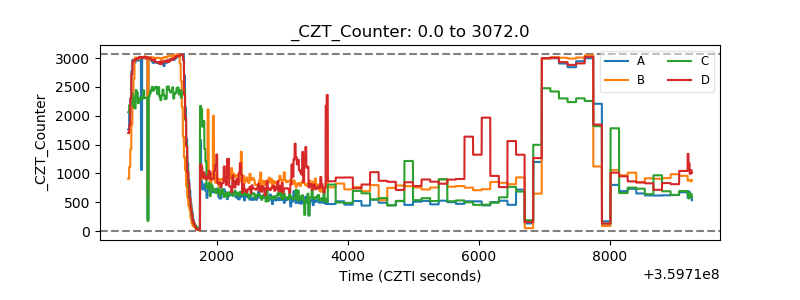 |
| +2.5 Volts monitor |  |
| +5 Volts monitor | 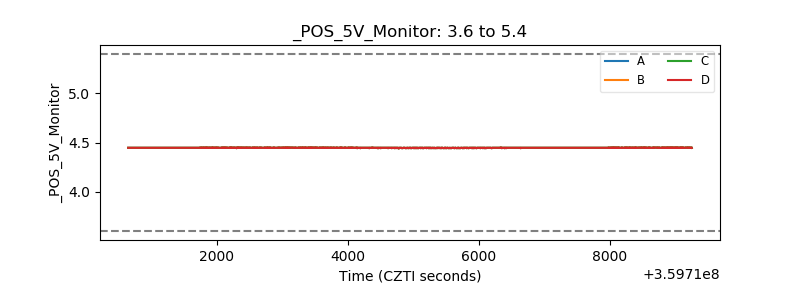 |
| _ROLL_ROT |  |
| _Roll_DEC | 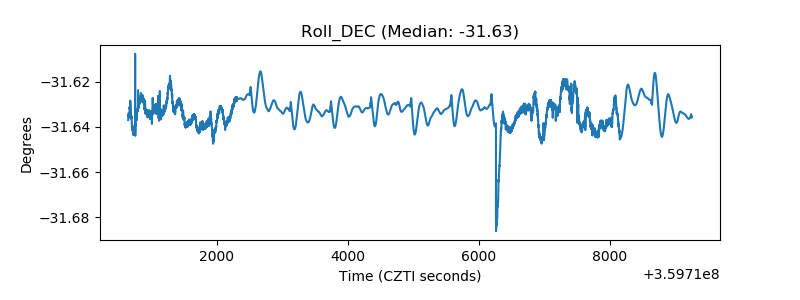 |
| _Roll_RA | 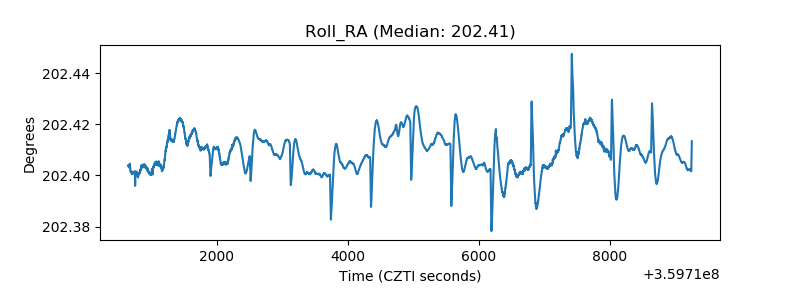 |
| Veto Counter |  |