| Param | Original file | Final file |
|---|---|---|
| Filename | modeM0/AS1A10_058T03_9000004408_30600cztM0_level2.evt | modeM0/AS1A10_058T03_9000004408_30600cztM0_level2_quad_clean.evt |
| Size (bytes) | 650,378,880 | 99,794,880 |
| Size | 620.2 MB | 95.2 MB |
| Events in quadrant A | 3,686,105 | 668,147 |
| Events in quadrant B | 5,478,700 | 664,924 |
| Events in quadrant C | 4,021,148 | 632,248 |
| Events in quadrant D | 6,085,614 | 617,021 |
| Mode M0 | |||
|---|---|---|---|
| Quadrant | BADHDUFLAG | Total packets | Discarded packets |
| A | 0 | 15088 | 2 |
| B | 0 | 20451 | 2 |
| C | 0 | 16289 | 2 |
| D | 0 | 22391 | 2 |
| Mode SS | |||
|---|---|---|---|
| Quadrant | BADHDUFLAG | Total packets | Discarded packets |
| A | 0 | 128 | 0 |
| B | 0 | 128 | 0 |
| C | 0 | 128 | 0 |
| D | 0 | 128 | 0 |
| Mode M9 | |||
|---|---|---|---|
| Quadrant | BADHDUFLAG | Total packets | Discarded packets |
| A | 0 | 14 | 0 |
| B | 0 | 15 | 0 |
| C | 0 | 15 | 0 |
| D | 0 | 15 | 0 |
| Quadrant | Total seconds | Saturated seconds | Saturation percentage |
|---|---|---|---|
| A | 6301 | 124 | 1.967942% |
| B | 6301 | 263 | 4.173941% |
| C | 6301 | 485 | 7.697191% |
| D | 6301 | 193 | 3.063006% |
Noise dominated data is calculated using 1-second bins in cleaned event files. If a bin has >2000 counts, and if more than 50% of those come from <1% of pixels, then it is considered to be noise-dominated and hence unusable.
| Quadrant | # 1 sec bins | Bins with >0 counts | Bins with >2000 counts | High rate bins dominated by noise | Noise dominated (total time) | Noise dominated (detector-on time) | Marked lightcurve |
|---|---|---|---|---|---|---|---|
| A | 7626 | 6302 | 0 | 0 | 0.00% | 0.00% | 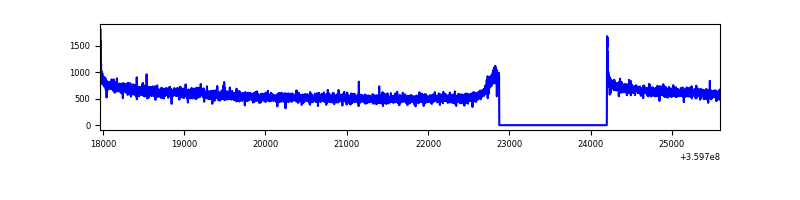 |
| B | 7626 | 6302 | 16 | 16 | 0.21% | 0.25% | 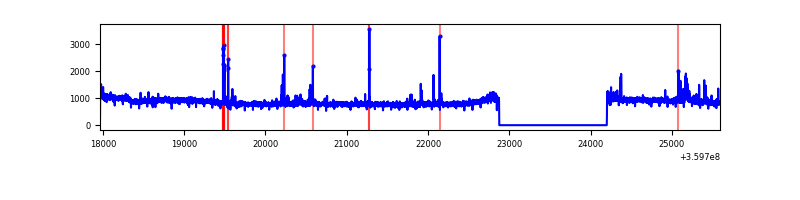 |
| C | 7626 | 6302 | 58 | 58 | 0.76% | 0.92% | 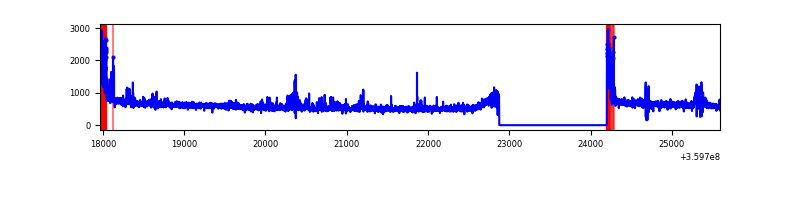 |
| D | 7626 | 6302 | 57 | 57 | 0.75% | 0.90% | 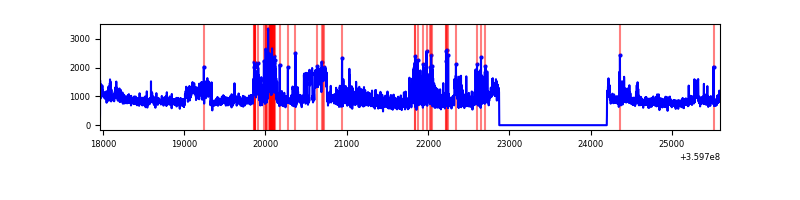 |
Top three noisy pixels from each quadrant. If the there are fewer than three noisy pixels in the level2.evt file, extra rows are filled as -1
| Pixel properties | Quadrant properties | ||||||
|---|---|---|---|---|---|---|---|
| Quadrant | DetID | PixID | Counts | Sigma | Mean | Median | Sigma |
| A | 8 | 192 | 20652 | 106.71 | 951 | 938 | 184.7 |
| A | 13 | 254 | 10831 | 53.55 | 951 | 938 | 184.7 |
| A | 3 | 137 | 8232 | 39.48 | 951 | 938 | 184.7 |
| B | 6 | 159 | 1674390 | 9820.78 | 926 | 907 | 170.4 |
| B | 0 | 229 | 75310 | 436.63 | 926 | 907 | 170.4 |
| B | 4 | 171 | 47709 | 274.66 | 926 | 907 | 170.4 |
| C | 0 | 10 | 231793 | 1153.81 | 879 | 891 | 200.1 |
| C | 14 | 238 | 204453 | 1017.2 | 879 | 891 | 200.1 |
| C | 14 | 254 | 79109 | 390.85 | 879 | 891 | 200.1 |
| D | 8 | 195 | 2154999 | 10163.42 | 917 | 898 | 211.9 |
| D | 5 | 222 | 289758 | 1362.89 | 917 | 898 | 211.9 |
| D | 2 | 250 | 104737 | 489.93 | 917 | 898 | 211.9 |
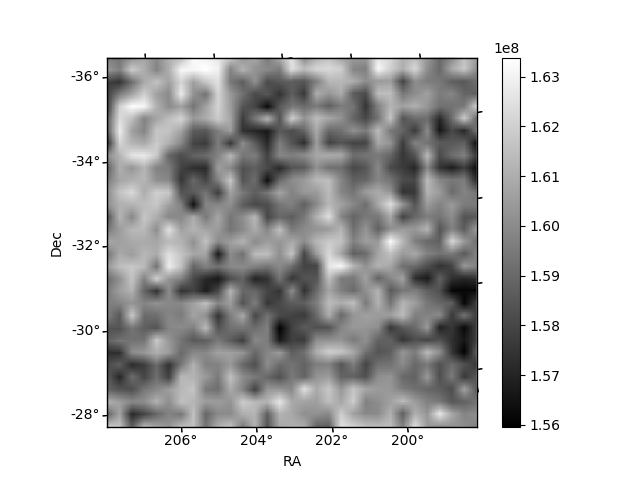
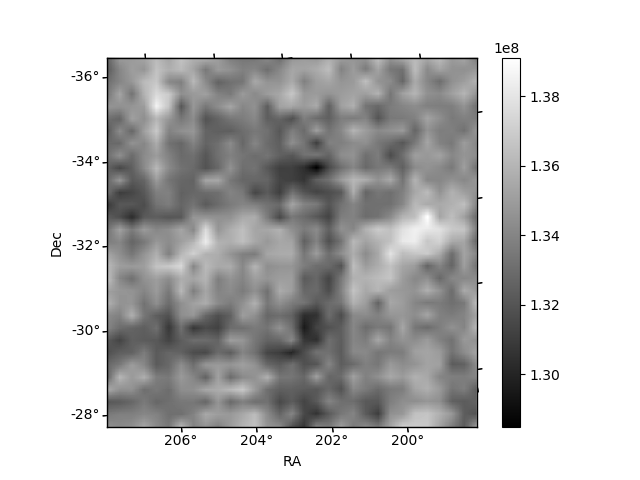
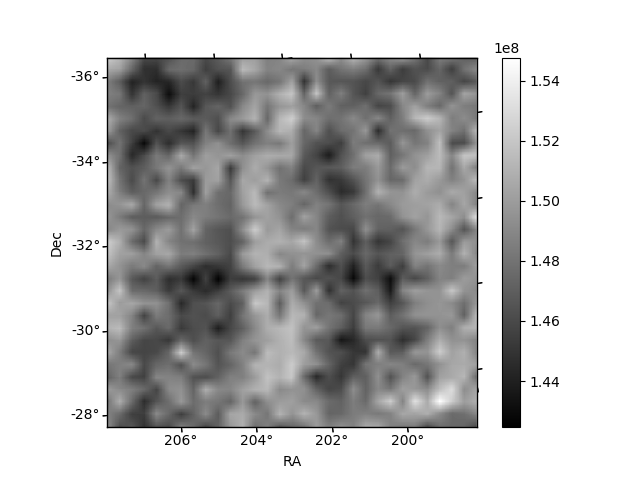
Histogram calculated using DETX and DETY for each event in the final _common_clean file
| Quadrant A | 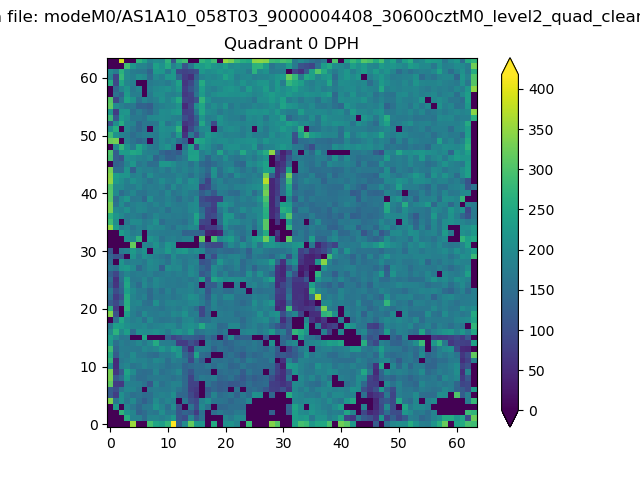 |
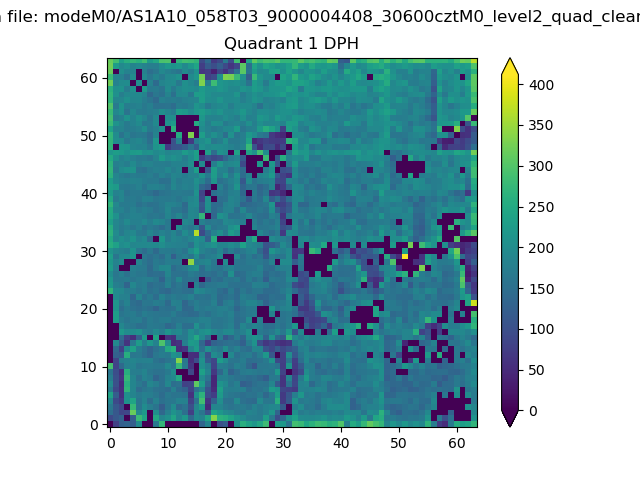 |
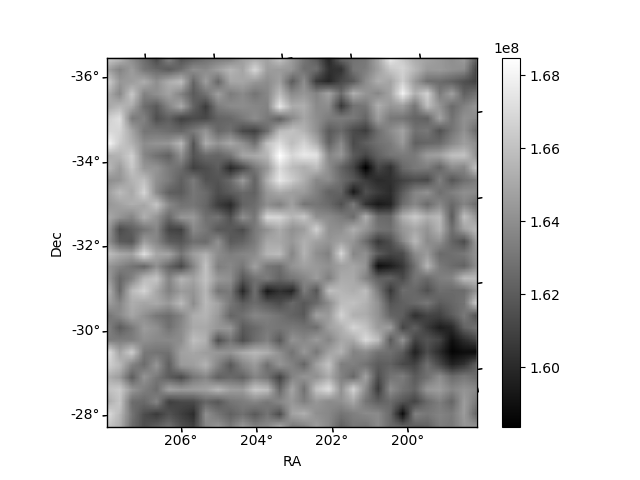
Quadrant B |
|---|---|---|---|
| Quadrant D |  |
 |
Quadrant C |
| Plot type | Count rate plots | Images |
|---|---|---|
| Comparison with Poisson distribution Blue bars denote a histogram of data divided into 1 sec bins. Red curve is a Poisson curve with rate = median count rate of data. |
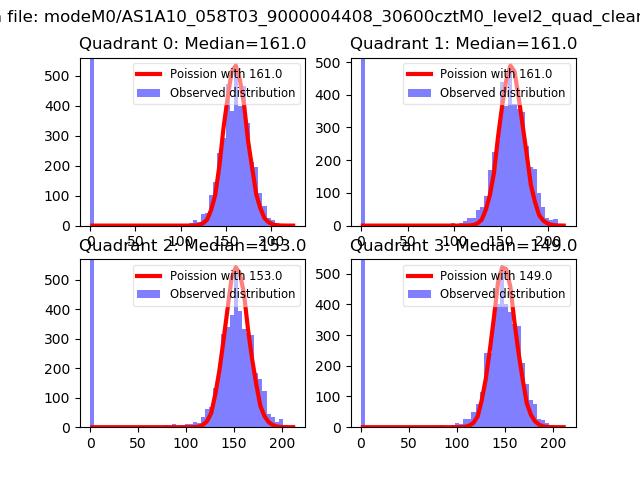 |
 |
| Quadrant-wise count rates Data is divided into 100 sec bins |
 |
|
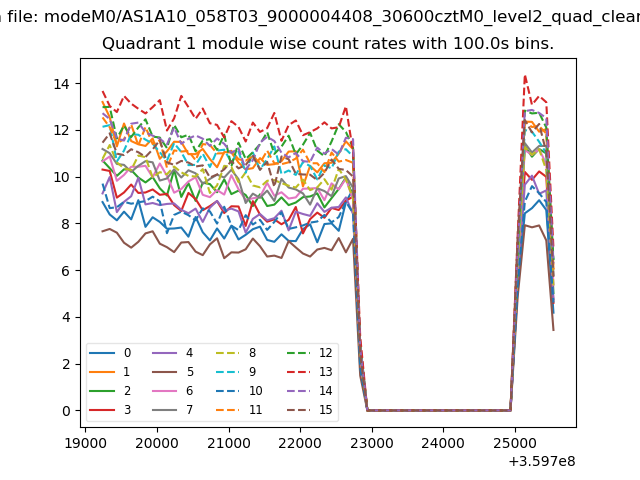
| Module-wise count rates for Quadrant A Data is divided into 100 sec bins |
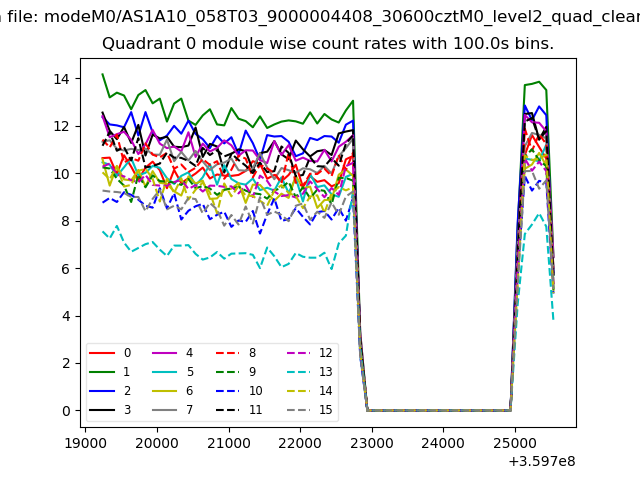 |
 |
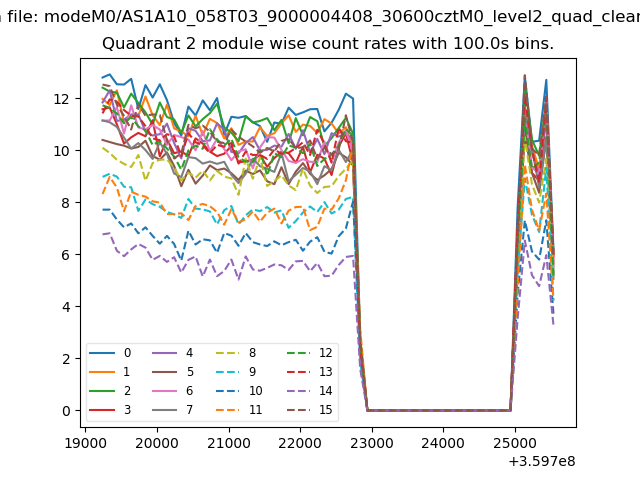
| Module-wise count rates for Quadrant B Data is divided into 100 sec bins |
 |
 |
| Module-wise count rates for Quadrant C Data is divided into 100 sec bins |
 |
 |
| Module-wise count rates for Quadrant D Data is divided into 100 sec bins |
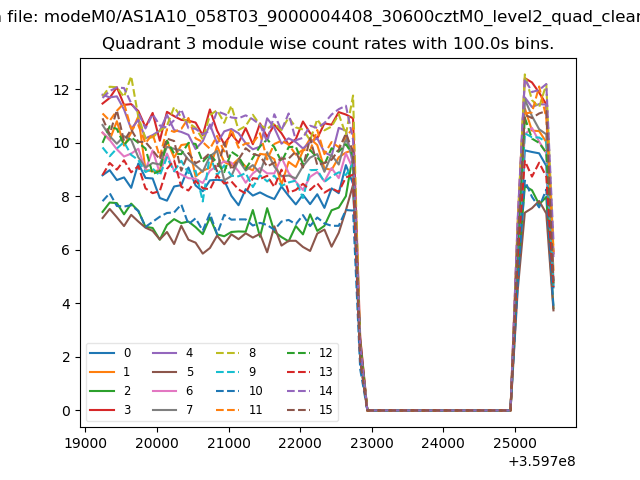 |
 |
| Parameter | Plot |
|---|---|
| CZT HV Monitor | 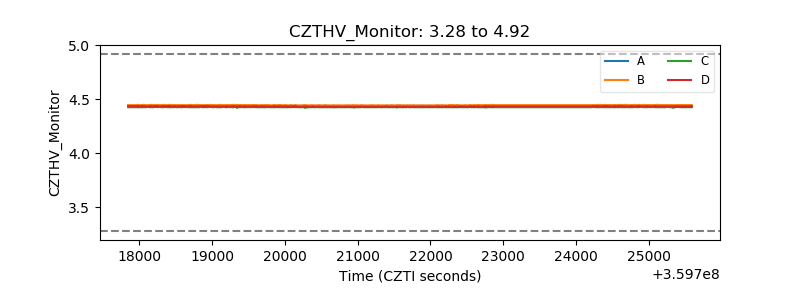 |
| D_VDD | 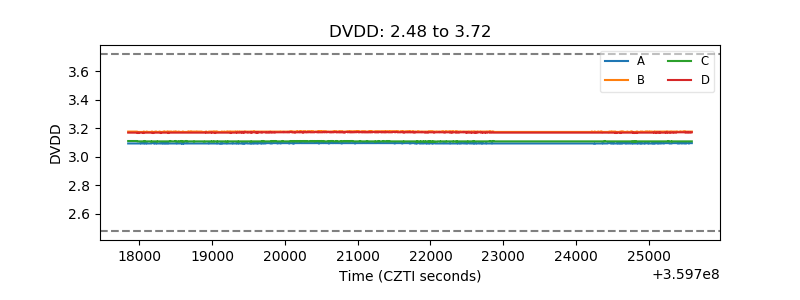 |
| Temperature 1 |  |
| Veto HV Monitor | 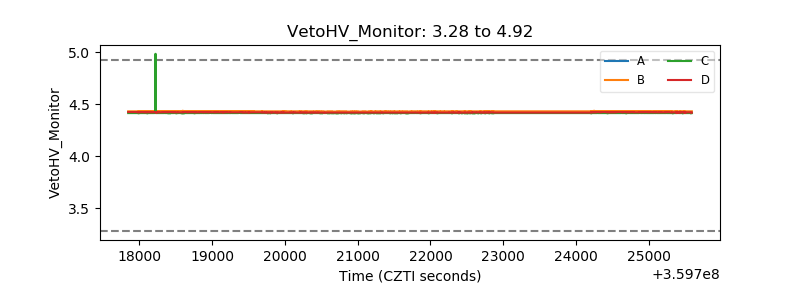 |
| Veto LLD | 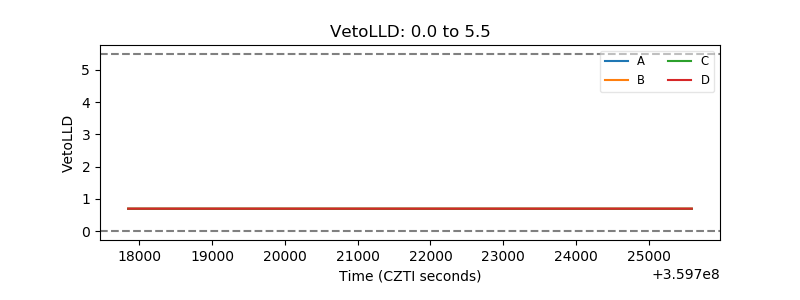 |
| Alpha Counter |  |
| _CPM_Rate | 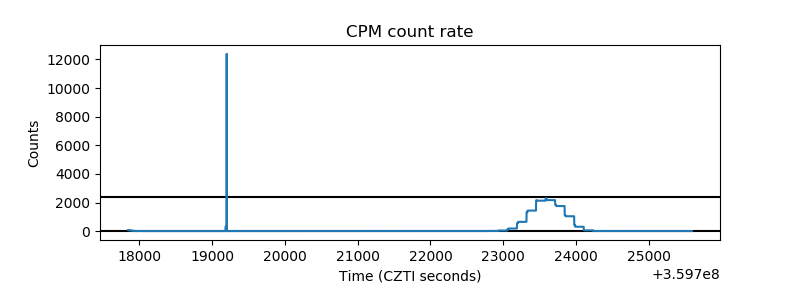 |
| CZT Counter | 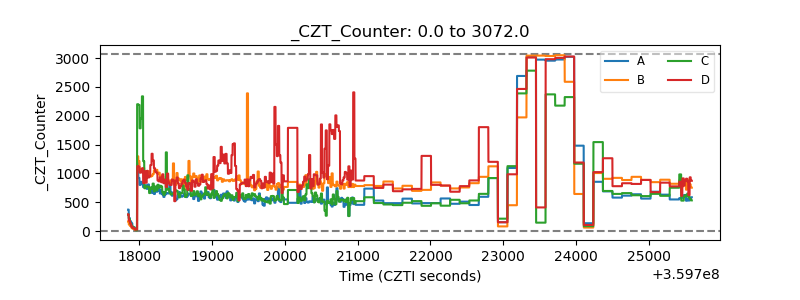 |
| +2.5 Volts monitor |  |
| +5 Volts monitor |  |
| _ROLL_ROT | 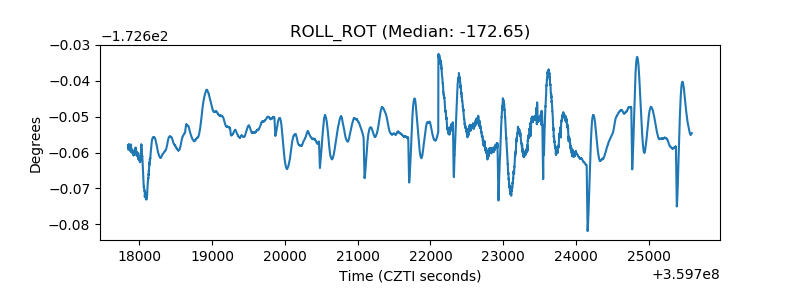 |
| _Roll_DEC | 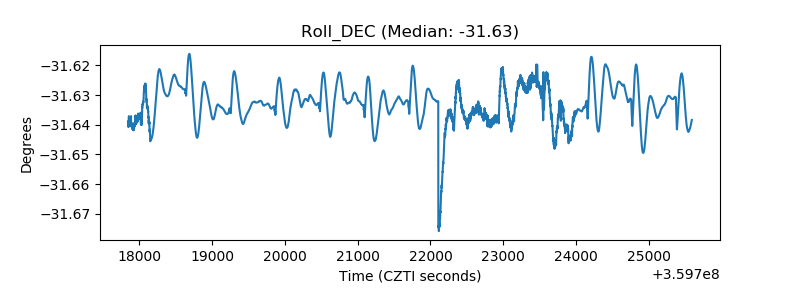 |
| _Roll_RA |  |
| Veto Counter | 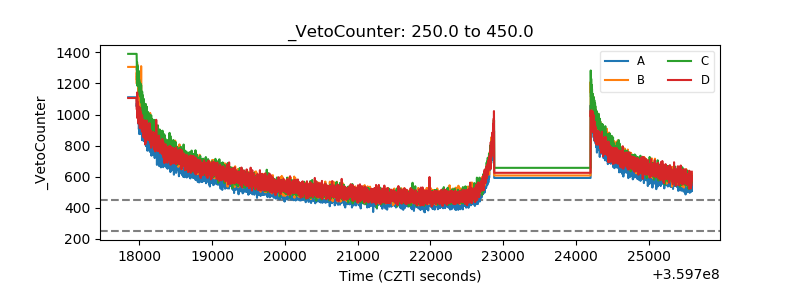 |