| Param | Original file | Final file |
|---|---|---|
| Filename | modeM0/AS1A10_058T03_9000004408_30601cztM0_level2.evt | modeM0/AS1A10_058T03_9000004408_30601cztM0_level2_quad_clean.evt |
| Size (bytes) | 627,719,040 | 107,795,520 |
| Size | 598.6 MB | 102.8 MB |
| Events in quadrant A | 3,651,210 | 737,974 |
| Events in quadrant B | 5,209,485 | 731,016 |
| Events in quadrant C | 3,731,802 | 689,378 |
| Events in quadrant D | 6,000,600 | 674,658 |
| Mode M0 | |||
|---|---|---|---|
| Quadrant | BADHDUFLAG | Total packets | Discarded packets |
| A | 0 | 14851 | 1 |
| B | 0 | 19508 | 1 |
| C | 0 | 15223 | 1 |
| D | 0 | 22141 | 1 |
| Mode SS | |||
|---|---|---|---|
| Quadrant | BADHDUFLAG | Total packets | Discarded packets |
| A | 0 | 126 | 0 |
| B | 0 | 126 | 0 |
| C | 0 | 126 | 0 |
| D | 0 | 126 | 0 |
| Mode M9 | |||
|---|---|---|---|
| Quadrant | BADHDUFLAG | Total packets | Discarded packets |
| A | 0 | 12 | 0 |
| B | 0 | 12 | 0 |
| C | 0 | 12 | 0 |
| D | 0 | 12 | 0 |
| Quadrant | Total seconds | Saturated seconds | Saturation percentage |
|---|---|---|---|
| A | 6183 | 223 | 3.606663% |
| B | 6183 | 291 | 4.706453% |
| C | 6183 | 461 | 7.455928% |
| D | 6184 | 227 | 3.670763% |
Noise dominated data is calculated using 1-second bins in cleaned event files. If a bin has >2000 counts, and if more than 50% of those come from <1% of pixels, then it is considered to be noise-dominated and hence unusable.
| Quadrant | # 1 sec bins | Bins with >0 counts | Bins with >2000 counts | High rate bins dominated by noise | Noise dominated (total time) | Noise dominated (detector-on time) | Marked lightcurve |
|---|---|---|---|---|---|---|---|
| A | 7423 | 6184 | 16 | 16 | 0.22% | 0.26% | 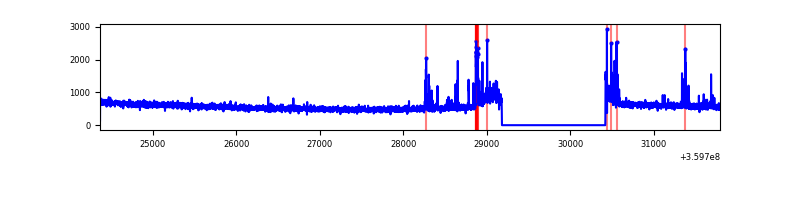 |
| B | 7423 | 6184 | 8 | 8 | 0.11% | 0.13% | 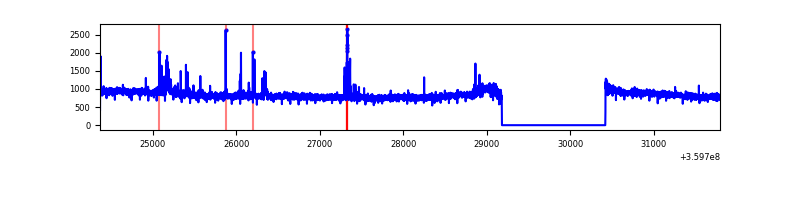 |
| C | 7423 | 6184 | 22 | 22 | 0.30% | 0.36% | 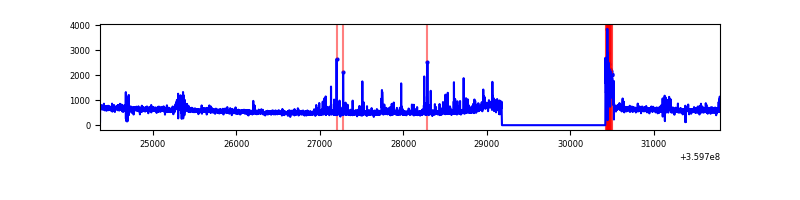 |
| D | 7424 | 6185 | 67 | 67 | 0.90% | 1.08% | 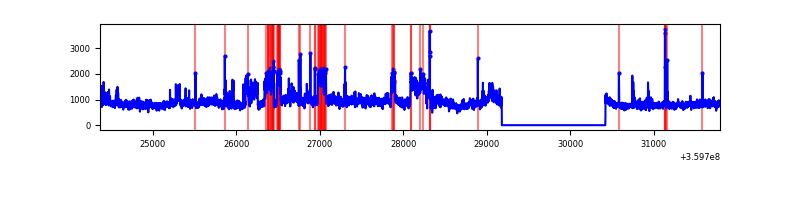 |
Top three noisy pixels from each quadrant. If the there are fewer than three noisy pixels in the level2.evt file, extra rows are filled as -1
| Pixel properties | Quadrant properties | ||||||
|---|---|---|---|---|---|---|---|
| Quadrant | DetID | PixID | Counts | Sigma | Mean | Median | Sigma |
| A | 0 | 13 | 175444 | 988.71 | 900 | 886 | 176.6 |
| A | 13 | 254 | 10713 | 55.66 | 900 | 886 | 176.6 |
| A | 8 | 192 | 9290 | 47.6 | 900 | 886 | 176.6 |
| B | 6 | 159 | 1643814 | 10096.11 | 875 | 858 | 162.7 |
| B | 0 | 229 | 62769 | 380.45 | 875 | 858 | 162.7 |
| B | 5 | 172 | 43608 | 262.7 | 875 | 858 | 162.7 |
| C | 14 | 238 | 188149 | 981.19 | 831 | 840 | 190.9 |
| C | 0 | 10 | 116309 | 604.86 | 831 | 840 | 190.9 |
| C | 15 | 208 | 74616 | 386.46 | 831 | 840 | 190.9 |
| D | 8 | 195 | 2493292 | 12431.09 | 865 | 846 | 200.5 |
| D | 2 | 250 | 93597 | 462.6 | 865 | 846 | 200.5 |
| D | 5 | 222 | 57653 | 283.33 | 865 | 846 | 200.5 |
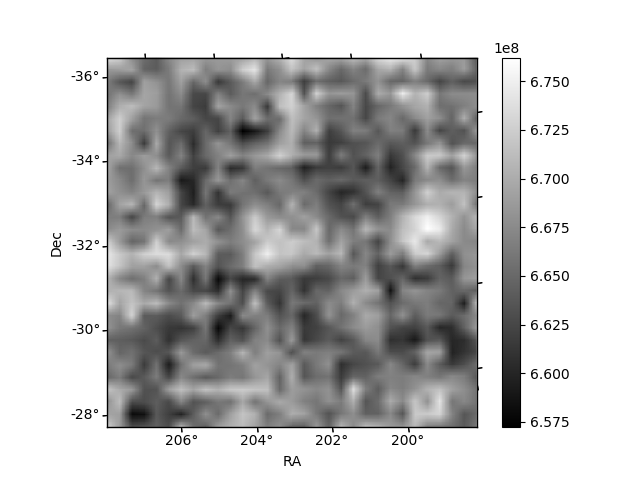
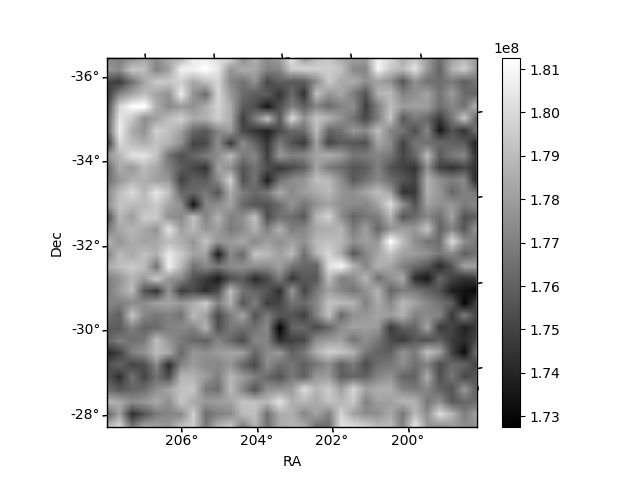
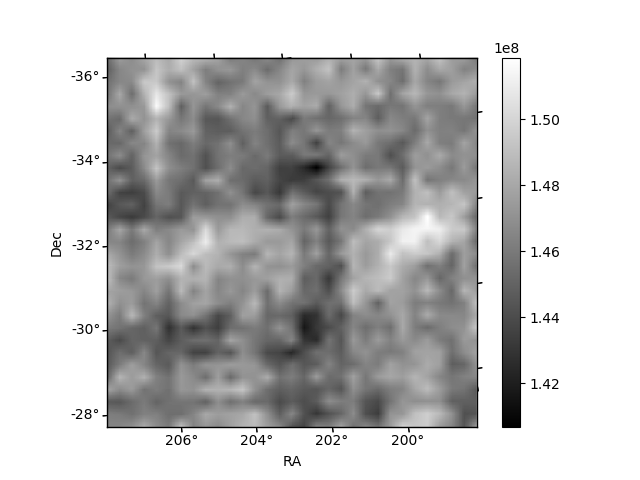
Histogram calculated using DETX and DETY for each event in the final _common_clean file
| Quadrant A | 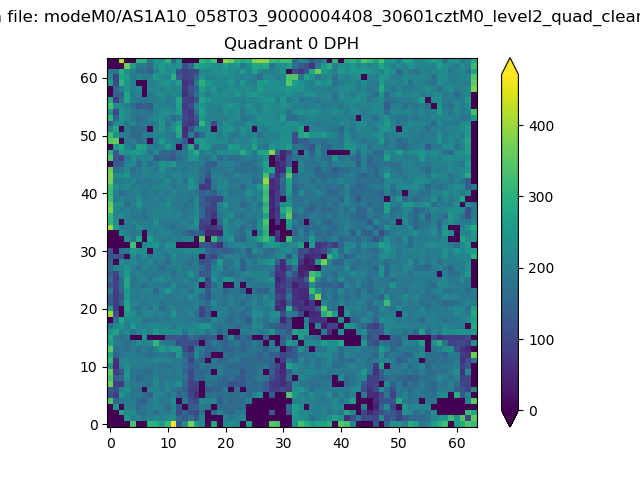 |
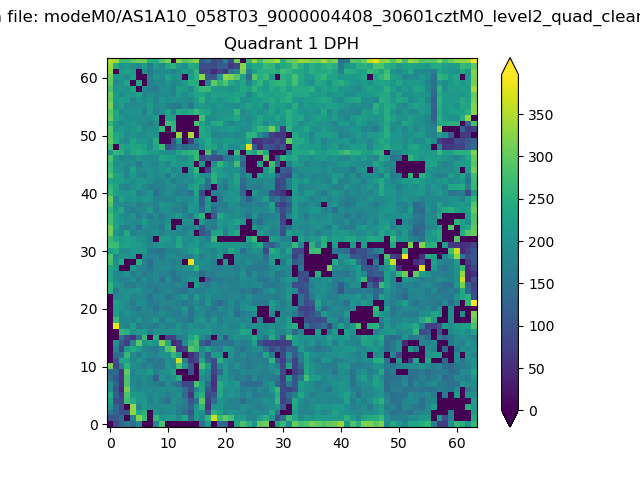 |
Quadrant B |
|---|---|---|---|
| Quadrant D | 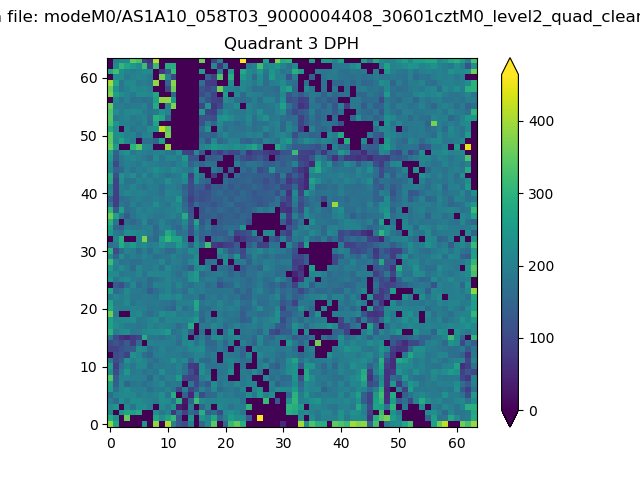 |
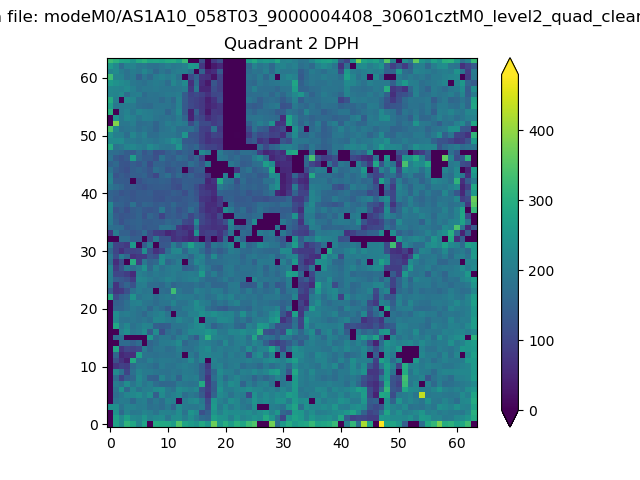 |
Quadrant C |
| Plot type | Count rate plots | Images |
|---|---|---|
| Comparison with Poisson distribution Blue bars denote a histogram of data divided into 1 sec bins. Red curve is a Poisson curve with rate = median count rate of data. |
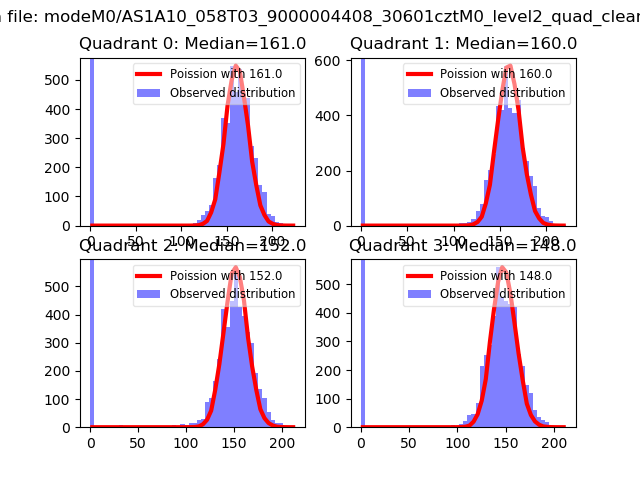 |
 |
| Quadrant-wise count rates Data is divided into 100 sec bins |
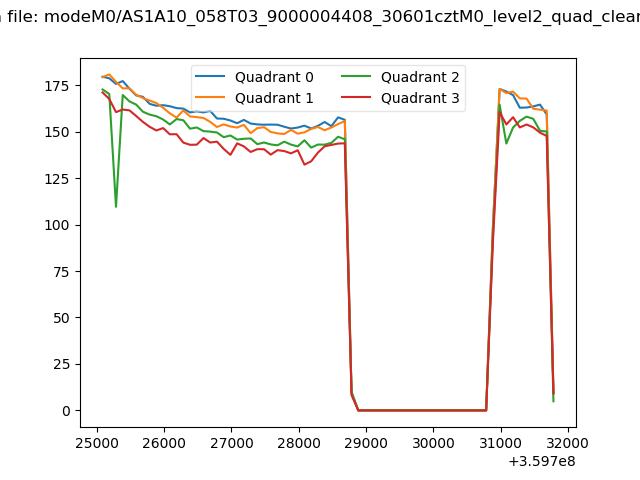 |
|
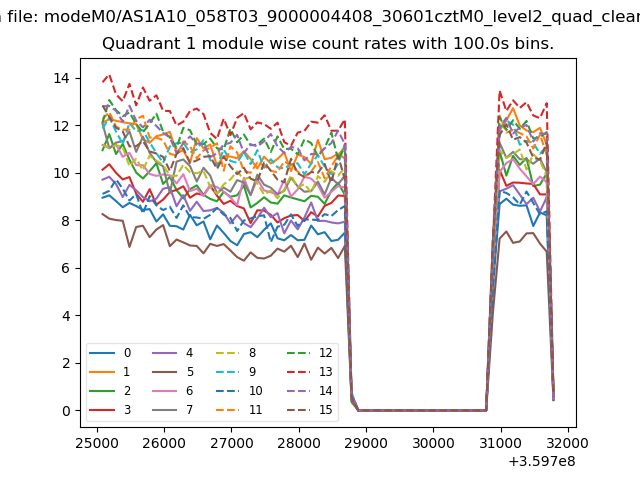
| Module-wise count rates for Quadrant A Data is divided into 100 sec bins |
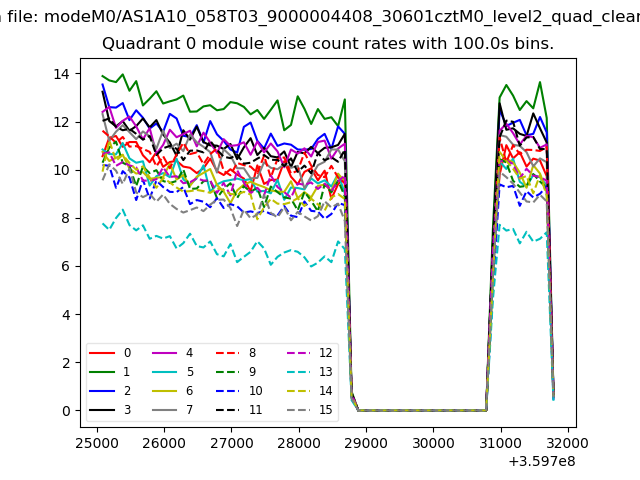 |
 |
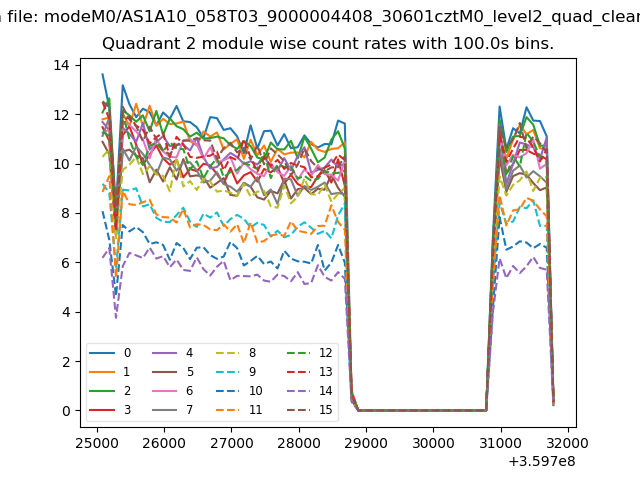
| Module-wise count rates for Quadrant B Data is divided into 100 sec bins |
 |
 |
| Module-wise count rates for Quadrant C Data is divided into 100 sec bins |
 |
 |
| Module-wise count rates for Quadrant D Data is divided into 100 sec bins |
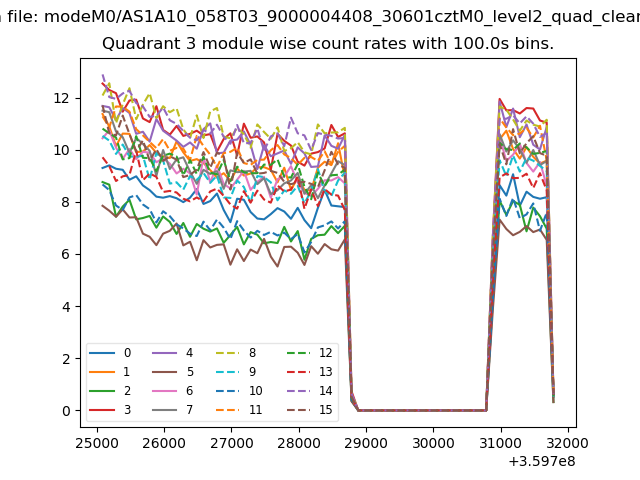 |
 |
| Parameter | Plot |
|---|---|
| CZT HV Monitor | 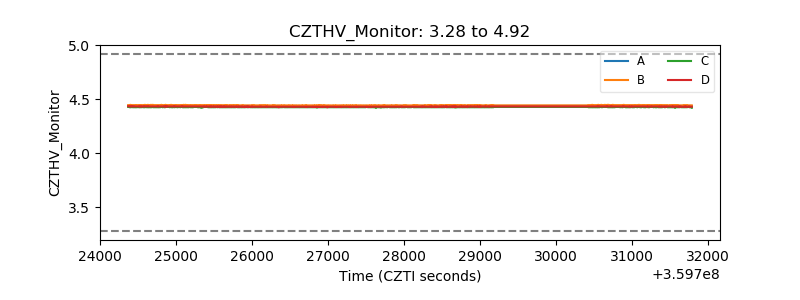 |
| D_VDD | 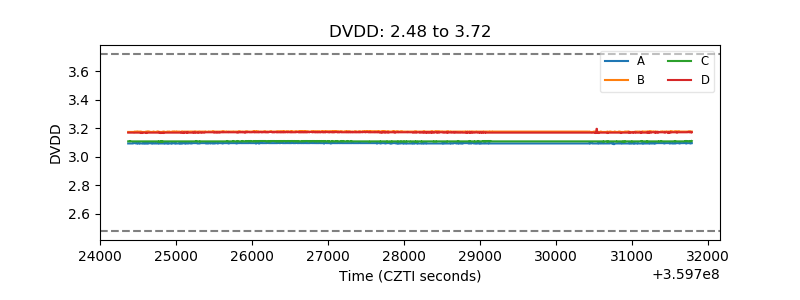 |
| Temperature 1 | 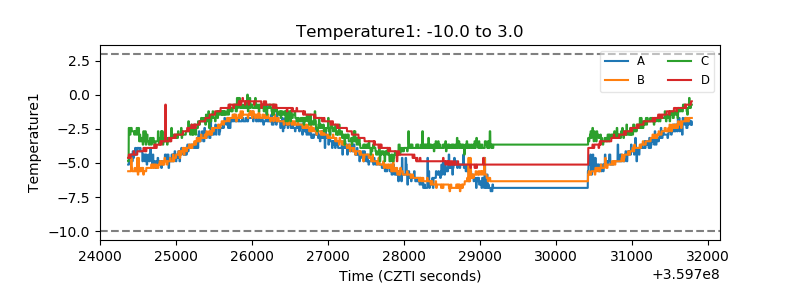 |
| Veto HV Monitor | 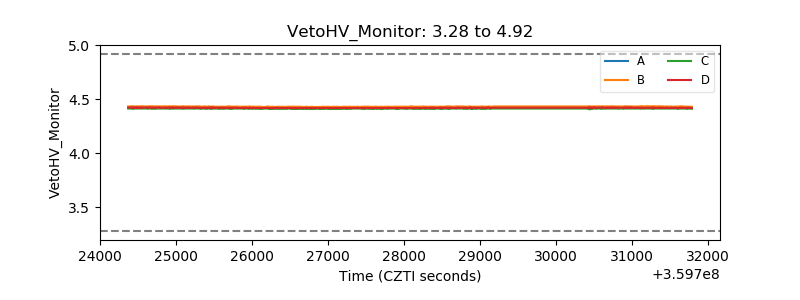 |
| Veto LLD | 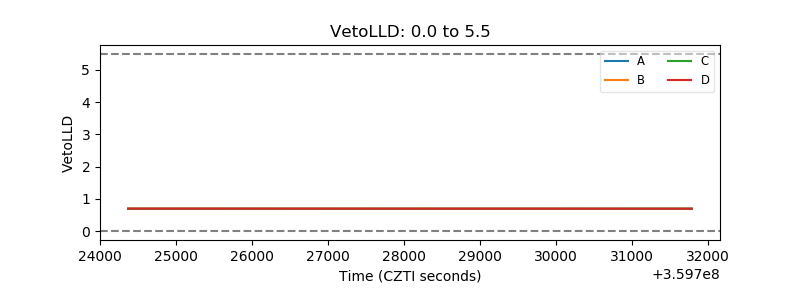 |
| Alpha Counter | 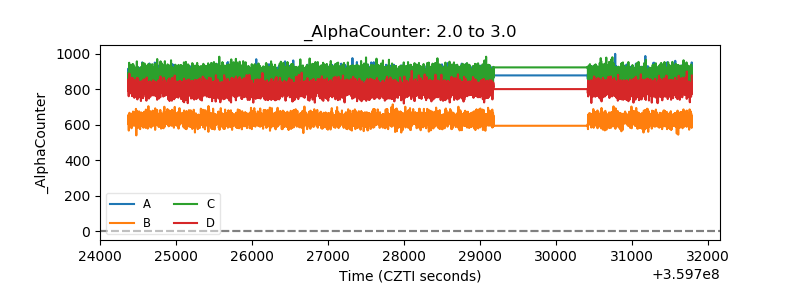 |
| _CPM_Rate | 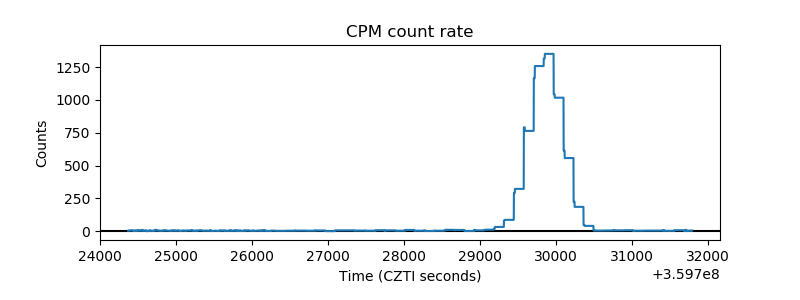 |
| CZT Counter | 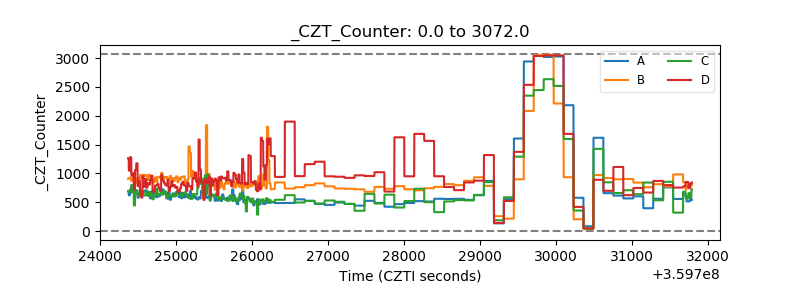 |
| +2.5 Volts monitor | 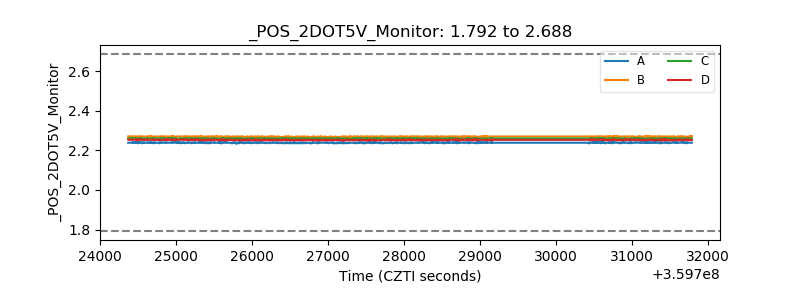 |
| +5 Volts monitor |  |
| _ROLL_ROT | 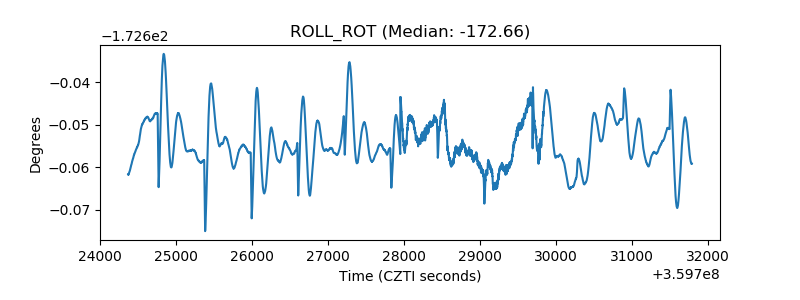 |
| _Roll_DEC | 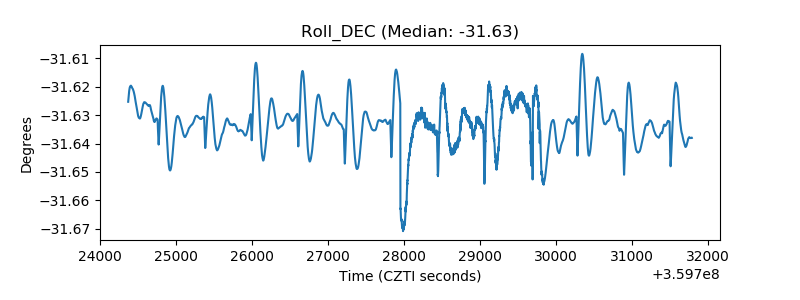 |
| _Roll_RA | 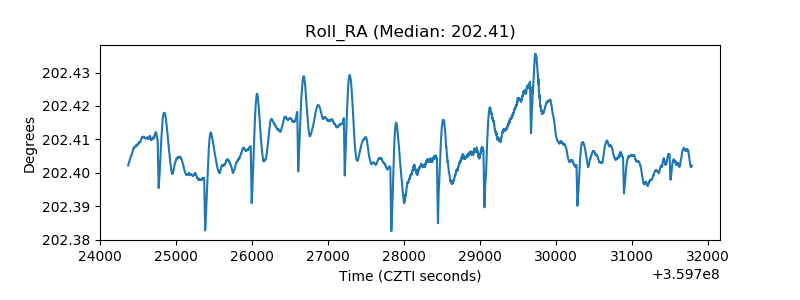 |
| Veto Counter | 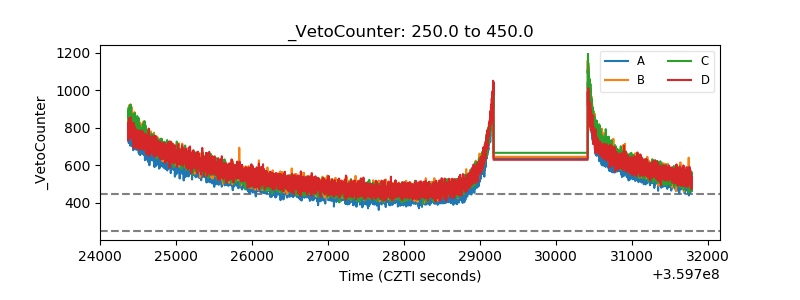 |