| Param | Original file | Final file |
|---|---|---|
| Filename | modeM0/AS1A10_058T03_9000004408_30602cztM0_level2.evt | modeM0/AS1A10_058T03_9000004408_30602cztM0_level2_quad_clean.evt |
| Size (bytes) | 600,552,000 | 109,307,520 |
| Size | 572.7 MB | 104.2 MB |
| Events in quadrant A | 3,733,423 | 745,086 |
| Events in quadrant B | 4,934,074 | 743,934 |
| Events in quadrant C | 3,306,106 | 706,301 |
| Events in quadrant D | 5,798,666 | 685,895 |
| Mode M0 | |||
|---|---|---|---|
| Quadrant | BADHDUFLAG | Total packets | Discarded packets |
| A | 0 | 14869 | 1 |
| B | 0 | 18875 | 2 |
| C | 0 | 13642 | 1 |
| D | 0 | 21533 | 1 |
| Mode SS | |||
|---|---|---|---|
| Quadrant | BADHDUFLAG | Total packets | Discarded packets |
| A | 0 | 126 | 0 |
| B | 0 | 126 | 0 |
| C | 0 | 126 | 0 |
| D | 0 | 126 | 0 |
| Mode M9 | |||
|---|---|---|---|
| Quadrant | BADHDUFLAG | Total packets | Discarded packets |
| A | 0 | 11 | 0 |
| B | 0 | 11 | 0 |
| C | 0 | 11 | 0 |
| D | 0 | 11 | 0 |
| Quadrant | Total seconds | Saturated seconds | Saturation percentage |
|---|---|---|---|
| A | 6146 | 227 | 3.693459% |
| B | 6145 | 215 | 3.498779% |
| C | 6146 | 268 | 4.360560% |
| D | 6146 | 204 | 3.319232% |
Noise dominated data is calculated using 1-second bins in cleaned event files. If a bin has >2000 counts, and if more than 50% of those come from <1% of pixels, then it is considered to be noise-dominated and hence unusable.
| Quadrant | # 1 sec bins | Bins with >0 counts | Bins with >2000 counts | High rate bins dominated by noise | Noise dominated (total time) | Noise dominated (detector-on time) | Marked lightcurve |
|---|---|---|---|---|---|---|---|
| A | 7251 | 6147 | 65 | 65 | 0.90% | 1.06% | 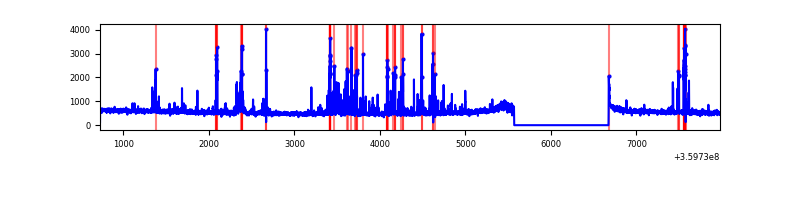 |
| B | 7250 | 6146 | 13 | 13 | 0.18% | 0.21% | 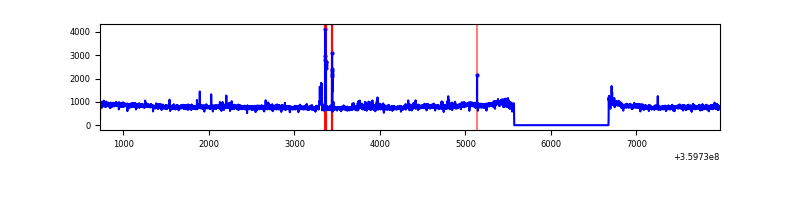 |
| C | 7251 | 6147 | 0 | 0 | 0.00% | 0.00% | 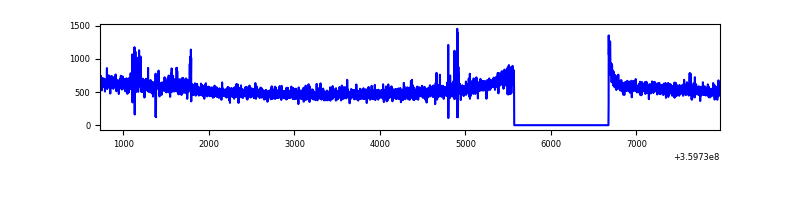 |
| D | 7251 | 6147 | 63 | 63 | 0.87% | 1.02% | 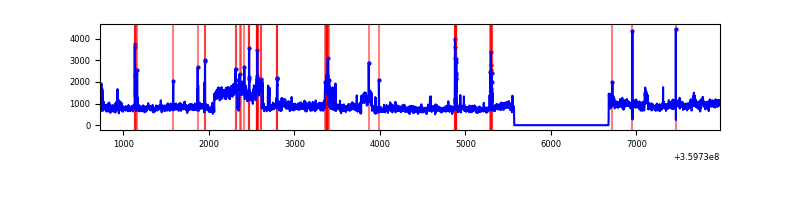 |
Top three noisy pixels from each quadrant. If the there are fewer than three noisy pixels in the level2.evt file, extra rows are filled as -1
| Pixel properties | Quadrant properties | ||||||
|---|---|---|---|---|---|---|---|
| Quadrant | DetID | PixID | Counts | Sigma | Mean | Median | Sigma |
| A | 0 | 13 | 476333 | 2868.8 | 835 | 821 | 165.8 |
| A | 13 | 170 | 18850 | 108.77 | 835 | 821 | 165.8 |
| A | 8 | 192 | 11587 | 64.95 | 835 | 821 | 165.8 |
| B | 6 | 159 | 1634659 | 10587.05 | 814 | 796 | 154.3 |
| B | 6 | 36 | 33698 | 213.2 | 814 | 796 | 154.3 |
| B | 5 | 172 | 33432 | 211.47 | 814 | 796 | 154.3 |
| C | 14 | 238 | 162484 | 899.73 | 781 | 787 | 179.7 |
| C | 14 | 254 | 44836 | 245.1 | 781 | 787 | 179.7 |
| C | 3 | 233 | 16709 | 88.59 | 781 | 787 | 179.7 |
| D | 8 | 195 | 2442147 | 13071.63 | 802 | 784 | 186.8 |
| D | 13 | 249 | 113337 | 602.63 | 802 | 784 | 186.8 |
| D | 5 | 222 | 84458 | 448.01 | 802 | 784 | 186.8 |
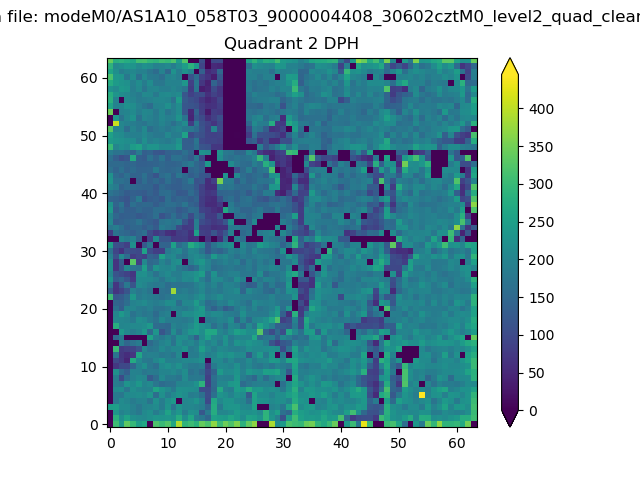
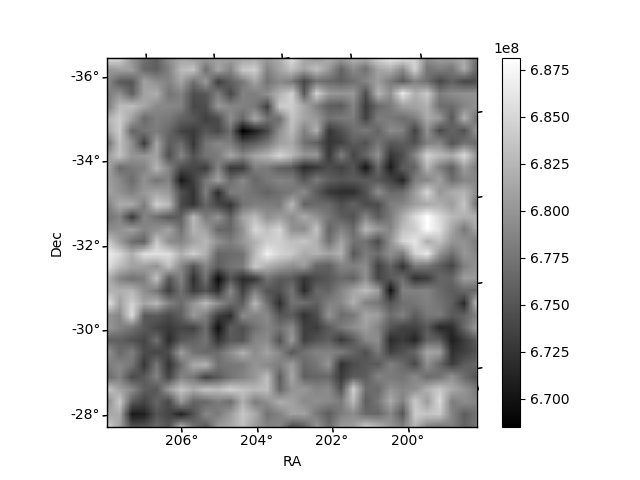
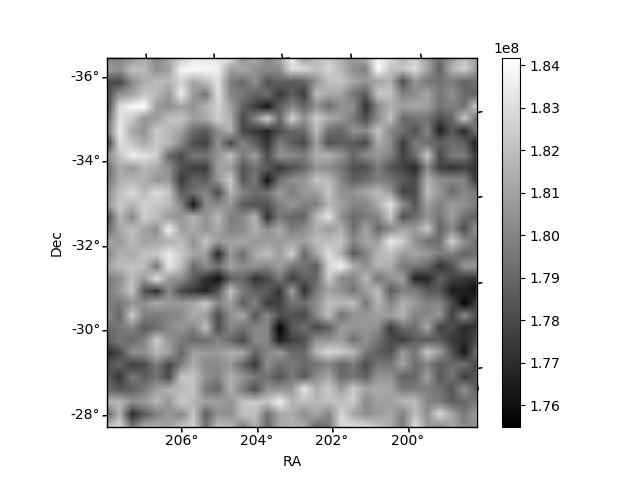
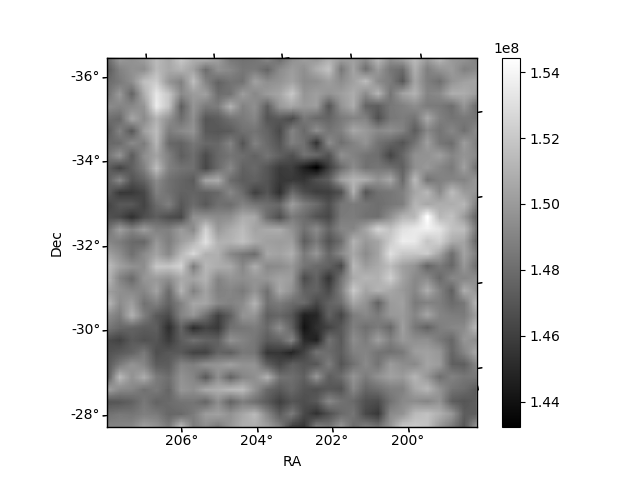
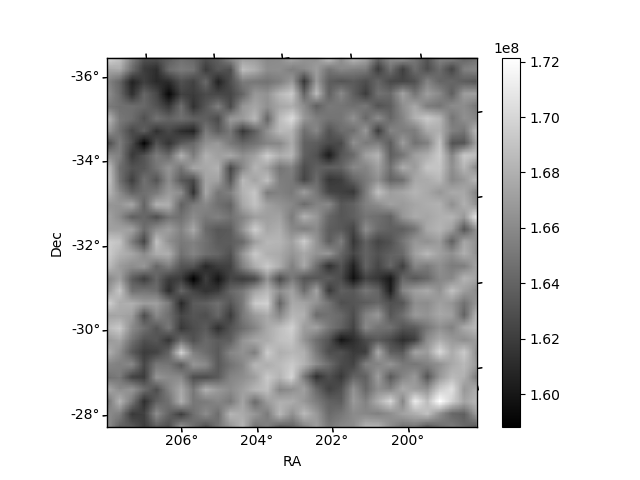
Histogram calculated using DETX and DETY for each event in the final _common_clean file
| Quadrant A | 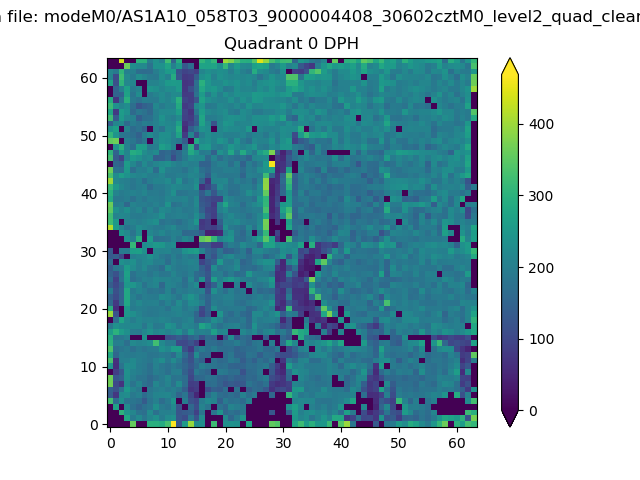 |
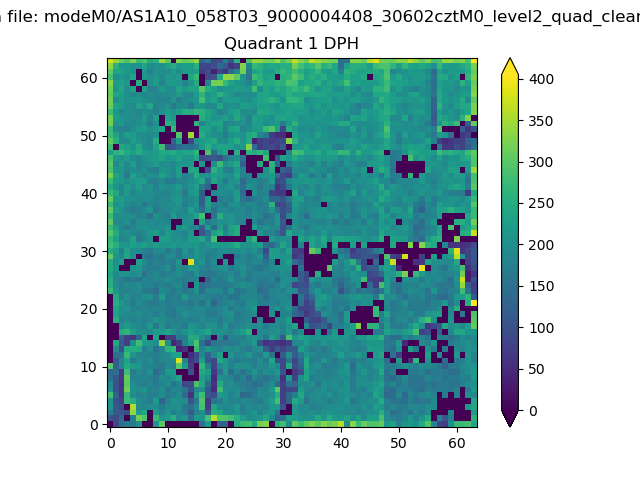 |
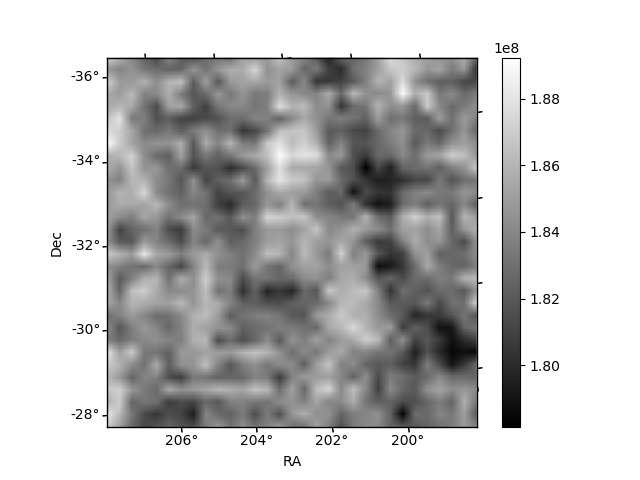
Quadrant B |
|---|---|---|---|
| Quadrant D | 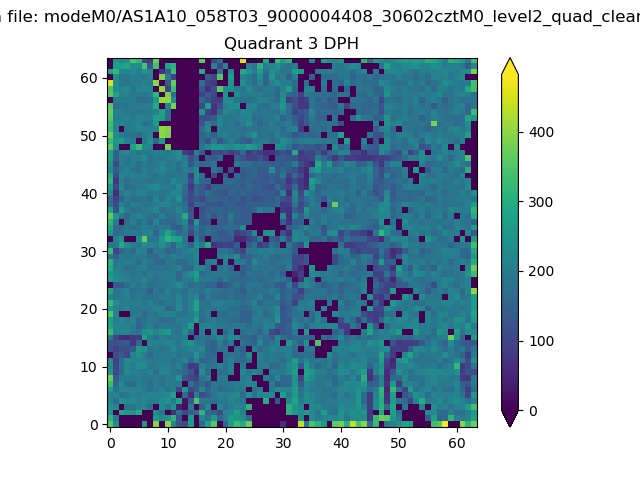 |
 |
Quadrant C |
| Plot type | Count rate plots | Images |
|---|---|---|
| Comparison with Poisson distribution Blue bars denote a histogram of data divided into 1 sec bins. Red curve is a Poisson curve with rate = median count rate of data. |
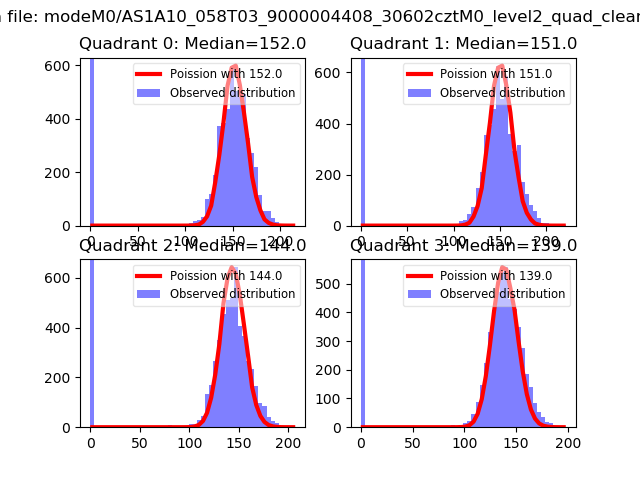 |
 |
| Quadrant-wise count rates Data is divided into 100 sec bins |
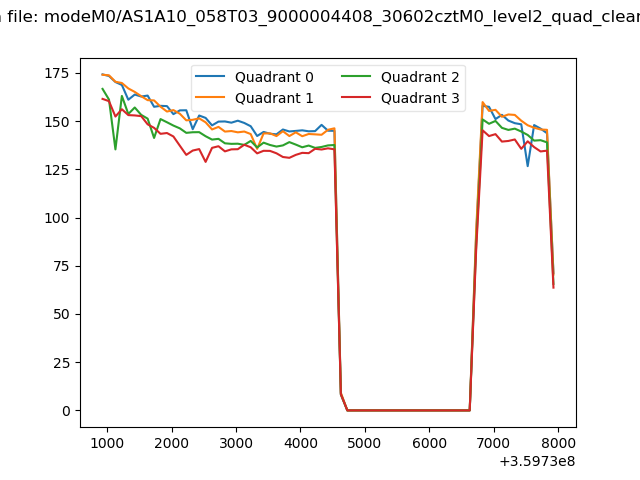 |
|
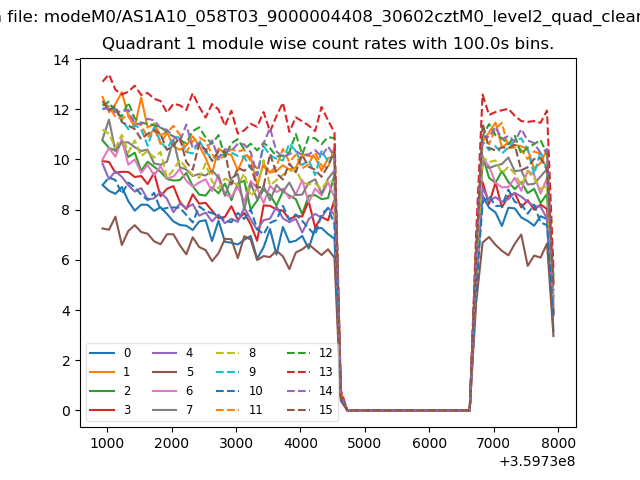
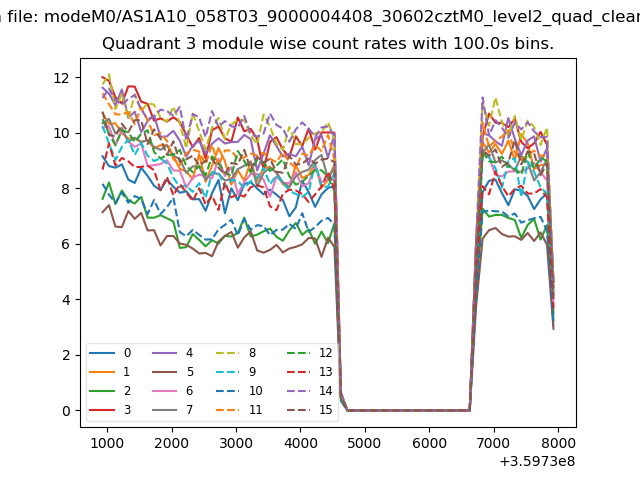
| Module-wise count rates for Quadrant A Data is divided into 100 sec bins |
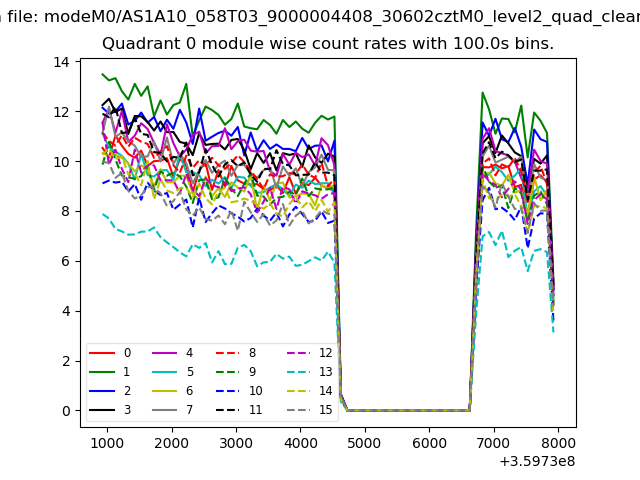 |
 |
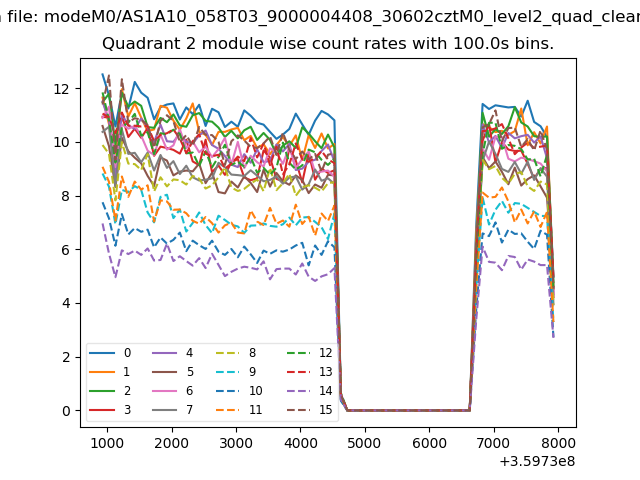
| Module-wise count rates for Quadrant B Data is divided into 100 sec bins |
 |
 |
| Module-wise count rates for Quadrant C Data is divided into 100 sec bins |
 |
 |
| Module-wise count rates for Quadrant D Data is divided into 100 sec bins |
 |
 |
| Parameter | Plot |
|---|---|
| CZT HV Monitor | 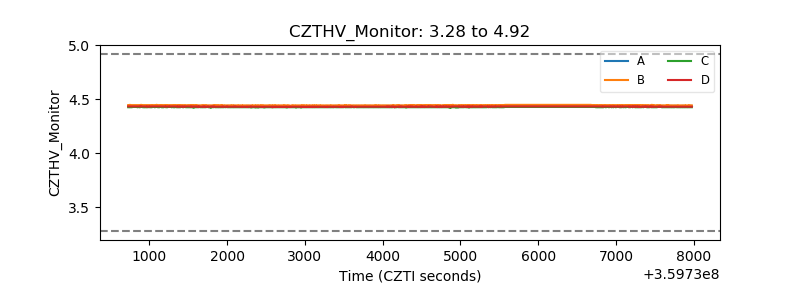 |
| D_VDD | 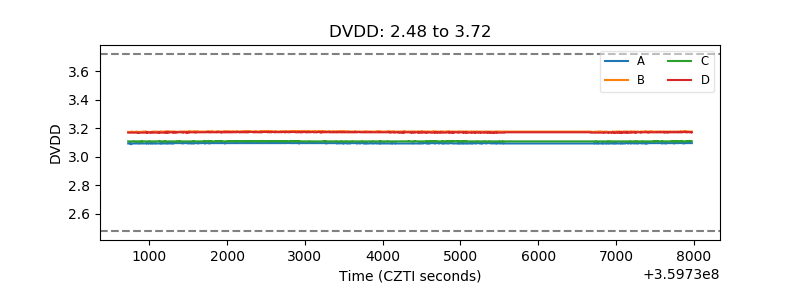 |
| Temperature 1 | 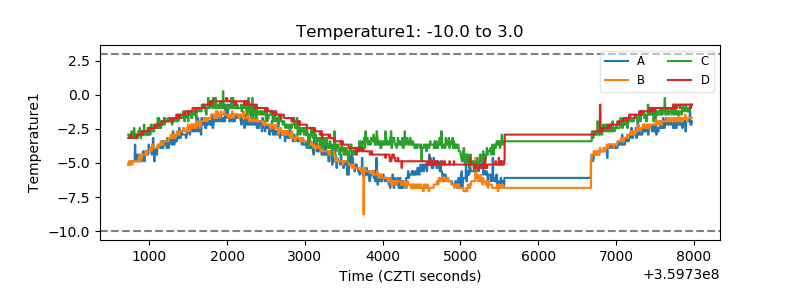 |
| Veto HV Monitor | 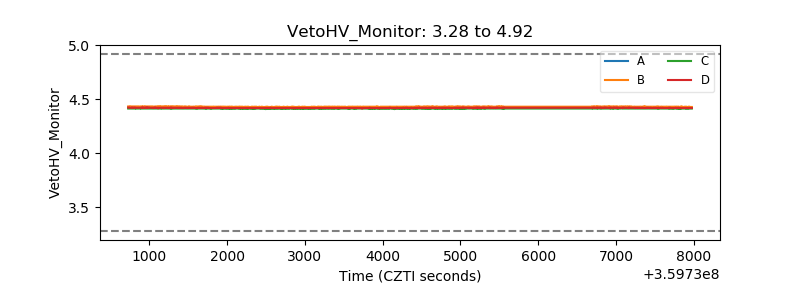 |
| Veto LLD | 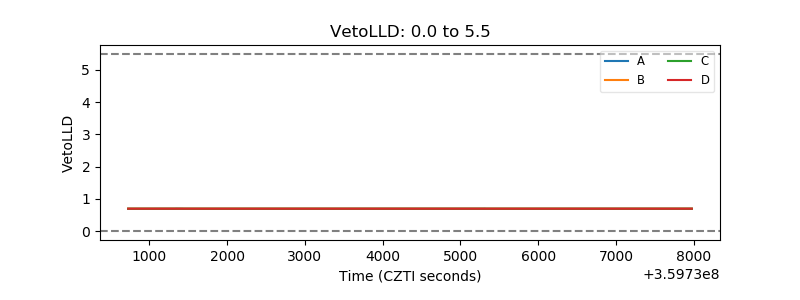 |
| Alpha Counter | 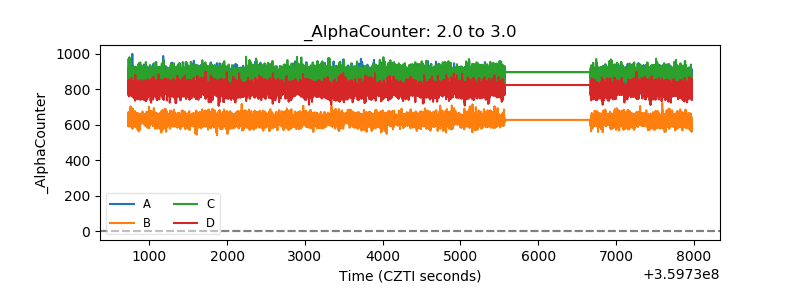 |
| _CPM_Rate | 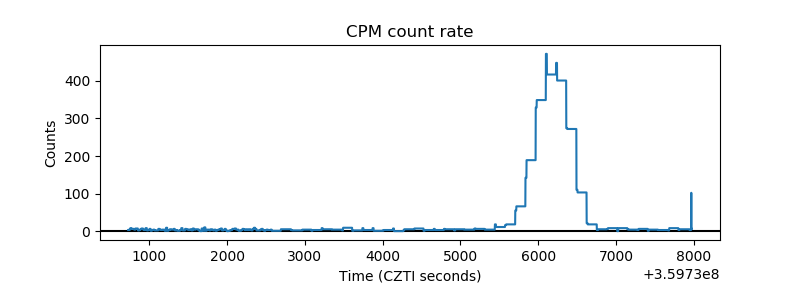 |
| CZT Counter | 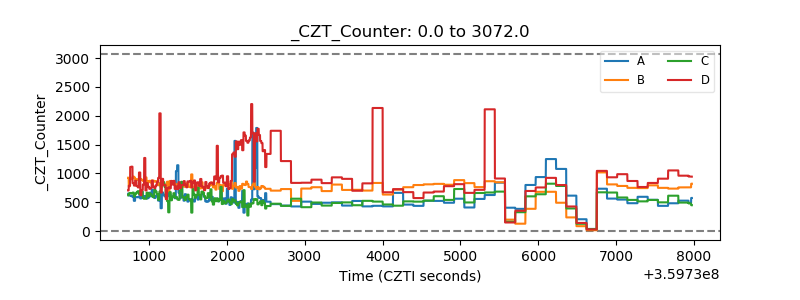 |
| +2.5 Volts monitor | 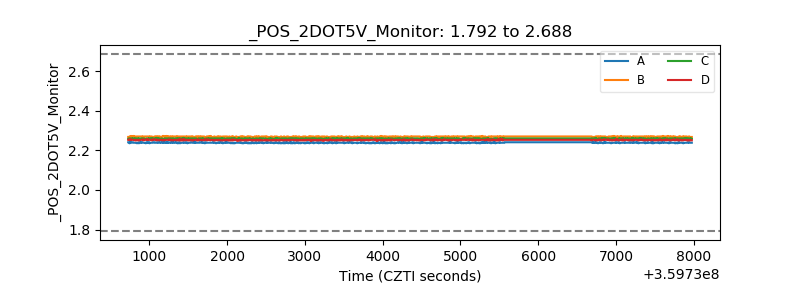 |
| +5 Volts monitor |  |
| _ROLL_ROT | 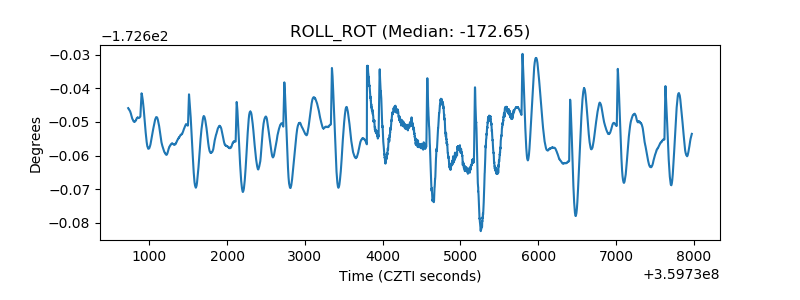 |
| _Roll_DEC | 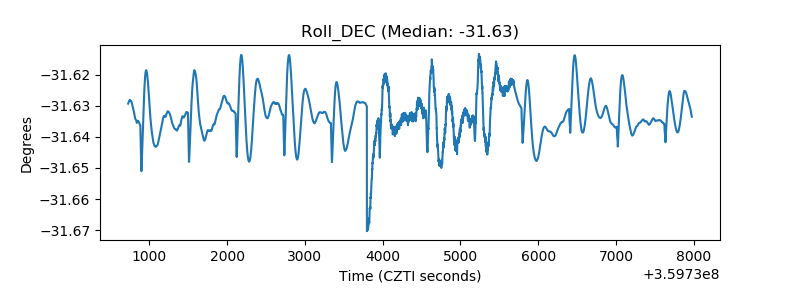 |
| _Roll_RA | 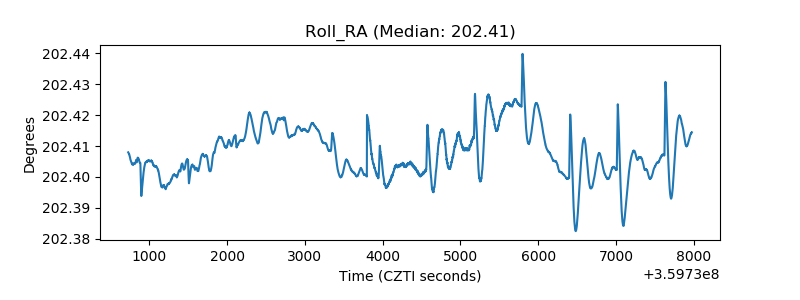 |
| Veto Counter | 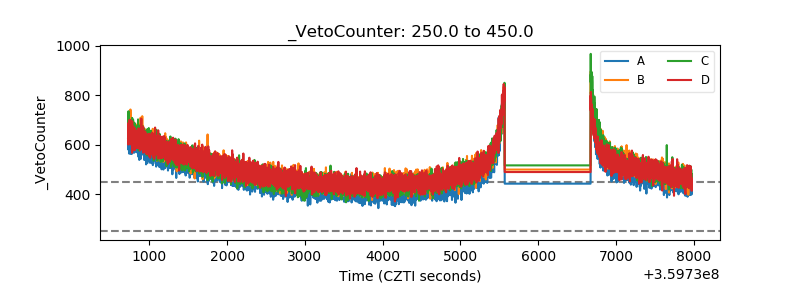 |