| Param | Original file | Final file |
|---|---|---|
| Filename | modeM0/AS1A10_058T03_9000004408_30604cztM0_level2.evt | modeM0/AS1A10_058T03_9000004408_30604cztM0_level2_quad_clean.evt |
| Size (bytes) | 720,169,920 | 112,965,120 |
| Size | 686.8 MB | 107.7 MB |
| Events in quadrant A | 4,221,107 | 745,179 |
| Events in quadrant B | 6,001,818 | 743,870 |
| Events in quadrant C | 4,258,702 | 708,820 |
| Events in quadrant D | 6,813,588 | 692,025 |
| Mode M0 | |||
|---|---|---|---|
| Quadrant | BADHDUFLAG | Total packets | Discarded packets |
| A | 0 | 17299 | 2 |
| B | 0 | 23427 | 2 |
| C | 0 | 17646 | 2 |
| D | 0 | 25851 | 2 |
| Mode SS | |||
|---|---|---|---|
| Quadrant | BADHDUFLAG | Total packets | Discarded packets |
| A | 0 | 156 | 0 |
| B | 0 | 156 | 0 |
| C | 0 | 156 | 0 |
| D | 0 | 156 | 0 |
| Mode M9 | |||
|---|---|---|---|
| Quadrant | BADHDUFLAG | Total packets | Discarded packets |
| A | 0 | 3 | 0 |
| B | 0 | 3 | 0 |
| C | 0 | 3 | 0 |
| D | 0 | 3 | 0 |
| Quadrant | Total seconds | Saturated seconds | Saturation percentage |
|---|---|---|---|
| A | 7631 | 157 | 2.057397% |
| B | 7630 | 197 | 2.581913% |
| C | 7630 | 204 | 2.673657% |
| D | 7630 | 184 | 2.411533% |
Noise dominated data is calculated using 1-second bins in cleaned event files. If a bin has >2000 counts, and if more than 50% of those come from <1% of pixels, then it is considered to be noise-dominated and hence unusable.
| Quadrant | # 1 sec bins | Bins with >0 counts | Bins with >2000 counts | High rate bins dominated by noise | Noise dominated (total time) | Noise dominated (detector-on time) | Marked lightcurve |
|---|---|---|---|---|---|---|---|
| A | 7976 | 7632 | 62 | 62 | 0.78% | 0.81% | 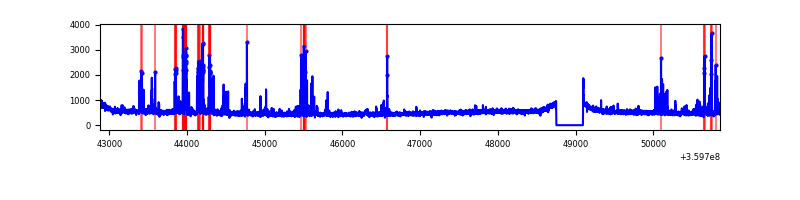 |
| B | 7975 | 7631 | 9 | 9 | 0.11% | 0.12% | 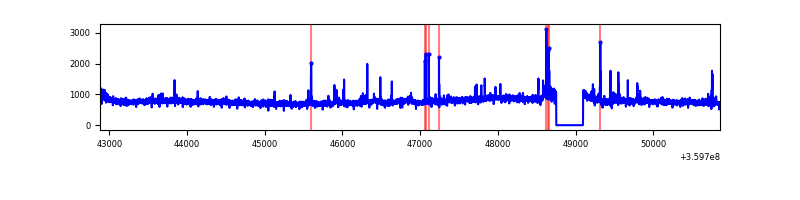 |
| C | 7975 | 7631 | 17 | 17 | 0.21% | 0.22% | 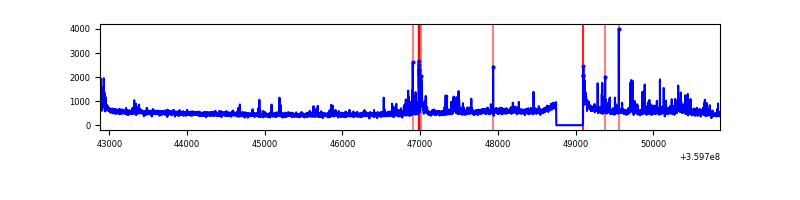 |
| D | 7975 | 7631 | 55 | 55 | 0.69% | 0.72% | 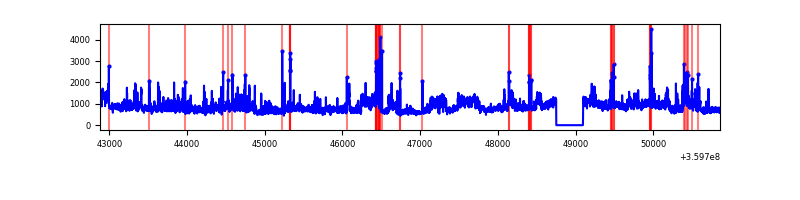 |
Top three noisy pixels from each quadrant. If the there are fewer than three noisy pixels in the level2.evt file, extra rows are filled as -1
| Pixel properties | Quadrant properties | ||||||
|---|---|---|---|---|---|---|---|
| Quadrant | DetID | PixID | Counts | Sigma | Mean | Median | Sigma |
| A | 0 | 13 | 443545 | 2266.0 | 970 | 952 | 195.3 |
| A | 12 | 96 | 27224 | 134.51 | 970 | 952 | 195.3 |
| A | 13 | 254 | 13147 | 62.44 | 970 | 952 | 195.3 |
| B | 6 | 159 | 2108536 | 11513.07 | 952 | 928 | 183.1 |
| B | 0 | 229 | 92702 | 501.33 | 952 | 928 | 183.1 |
| B | 4 | 171 | 26872 | 141.72 | 952 | 928 | 183.1 |
| C | 3 | 233 | 253962 | 1182.59 | 913 | 917 | 214.0 |
| C | 15 | 208 | 252843 | 1177.36 | 913 | 917 | 214.0 |
| C | 14 | 238 | 148834 | 691.28 | 913 | 917 | 214.0 |
| D | 8 | 195 | 2650283 | 12051.21 | 929 | 905 | 219.8 |
| D | 5 | 222 | 262277 | 1188.9 | 929 | 905 | 219.8 |
| D | 1 | 52 | 232157 | 1051.89 | 929 | 905 | 219.8 |
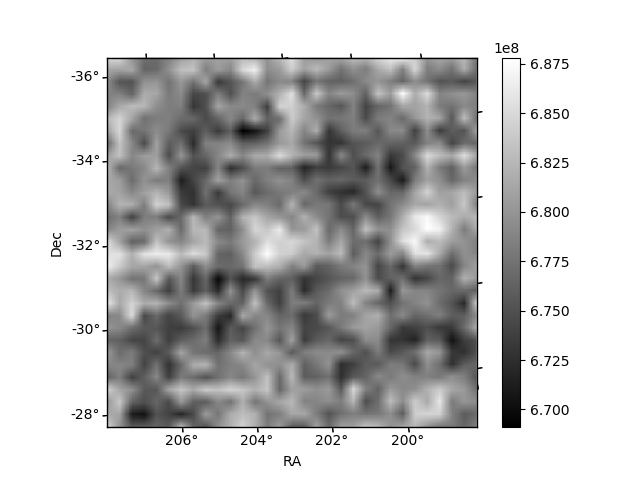
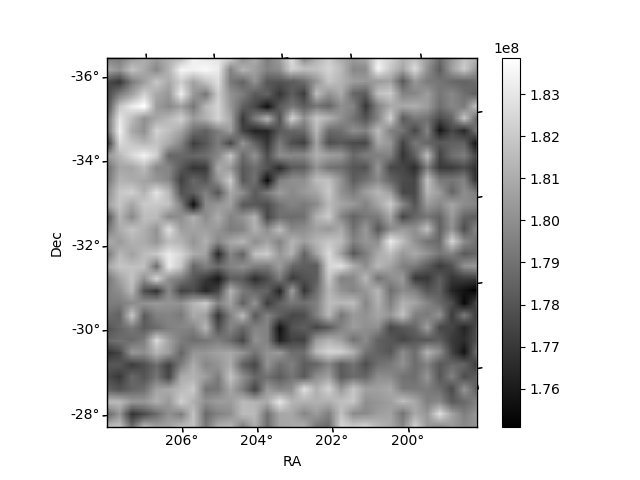
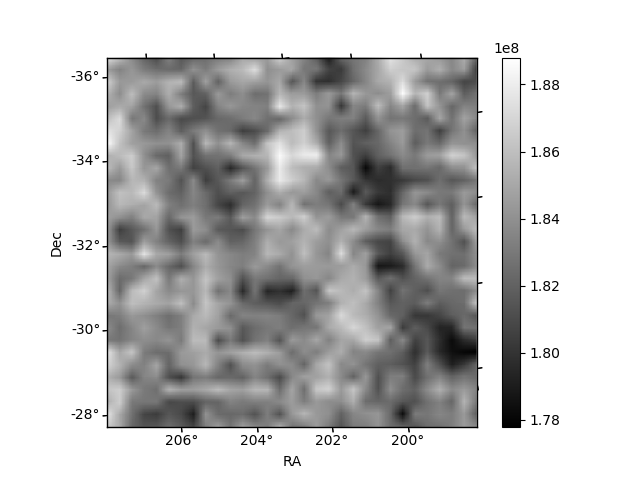
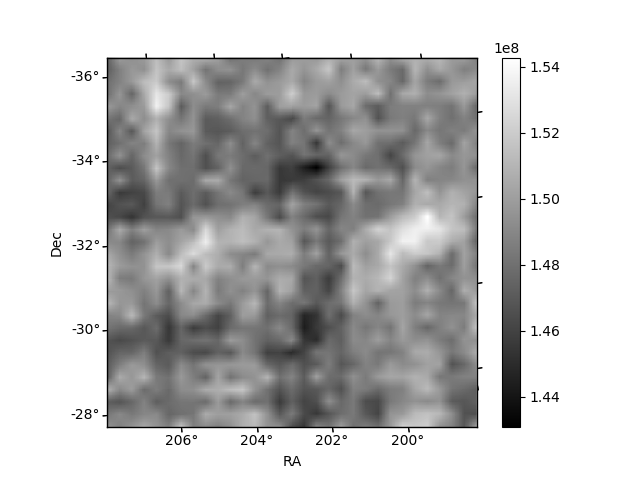
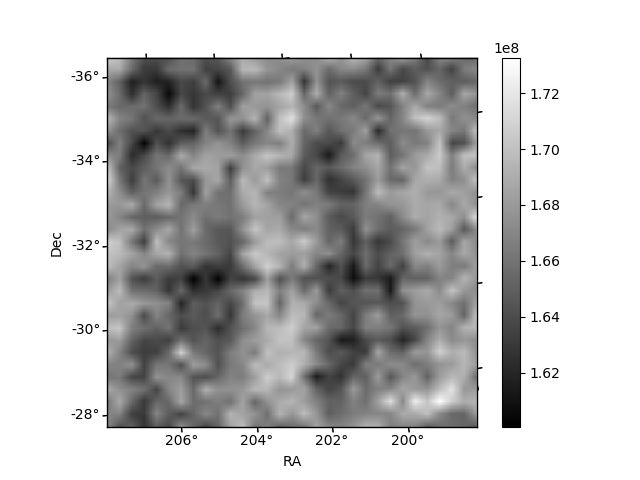
Histogram calculated using DETX and DETY for each event in the final _common_clean file
| Quadrant A | 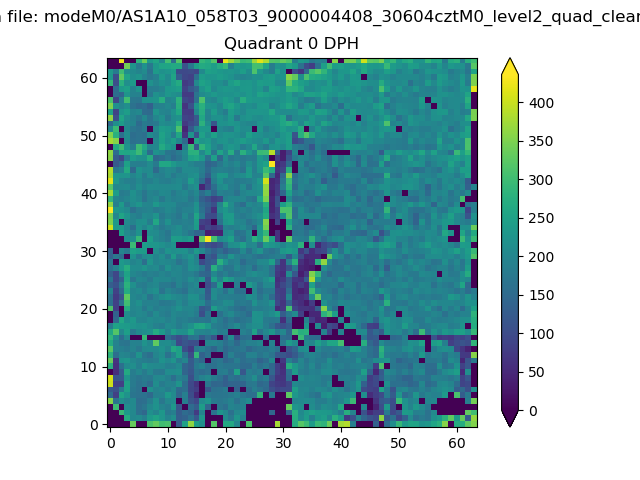 |
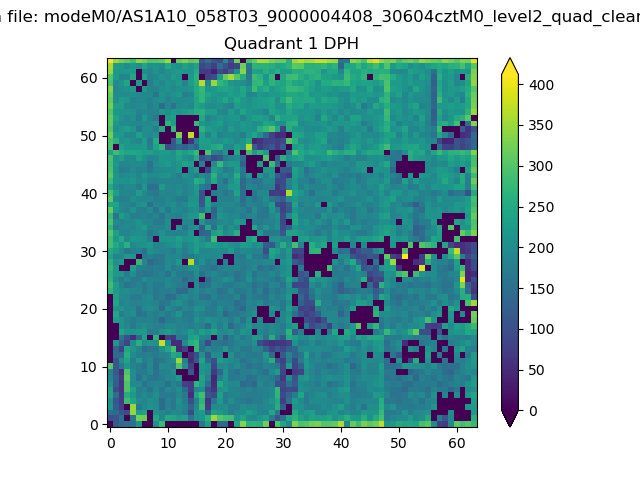 |
Quadrant B |
|---|---|---|---|
| Quadrant D | 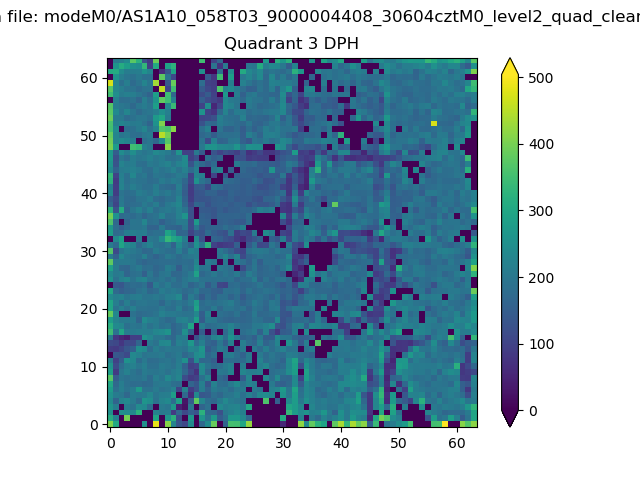 |
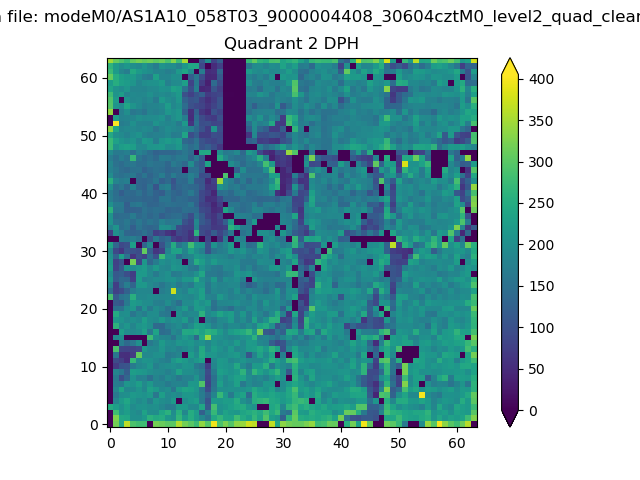 |
Quadrant C |
| Plot type | Count rate plots | Images |
|---|---|---|
| Comparison with Poisson distribution Blue bars denote a histogram of data divided into 1 sec bins. Red curve is a Poisson curve with rate = median count rate of data. |
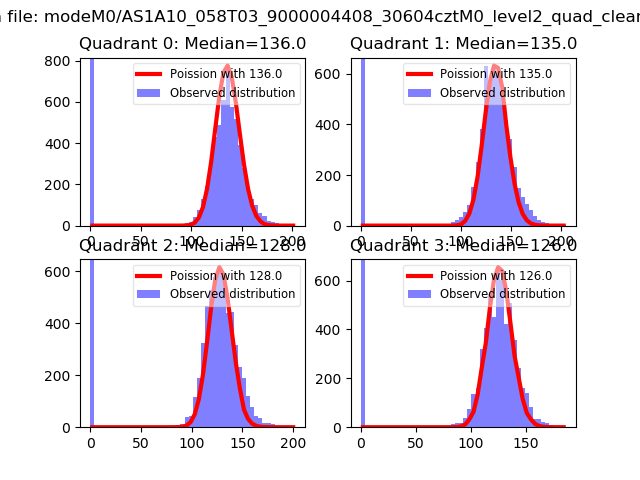 |
 |
| Quadrant-wise count rates Data is divided into 100 sec bins |
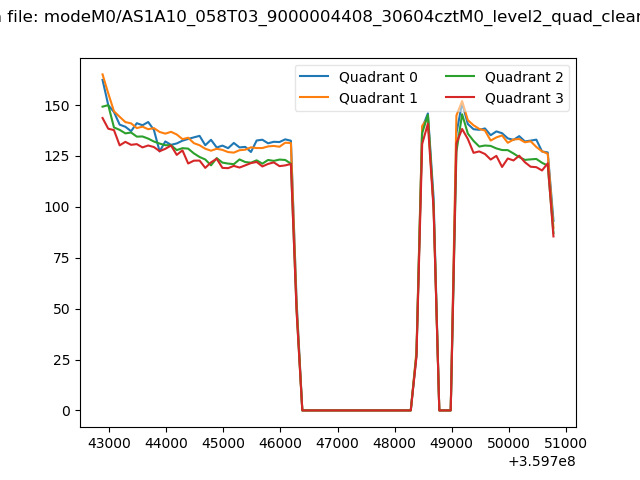 |
|
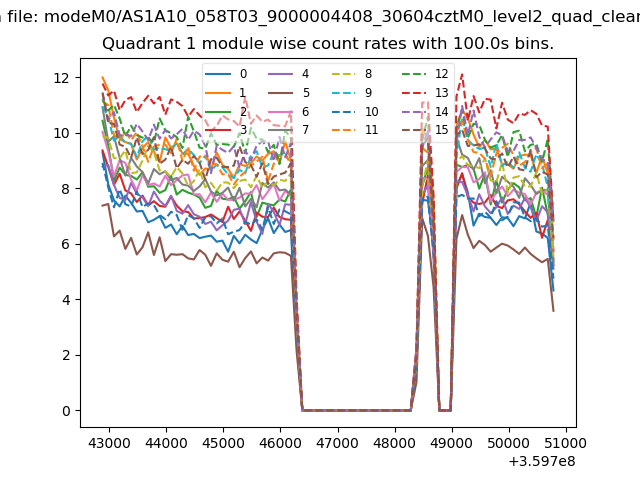
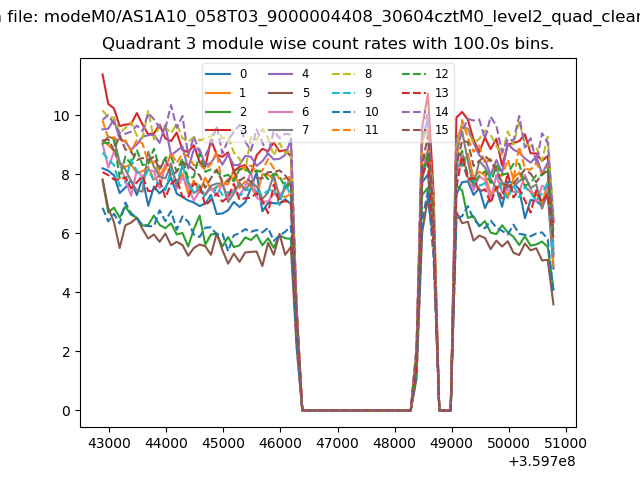
| Module-wise count rates for Quadrant A Data is divided into 100 sec bins |
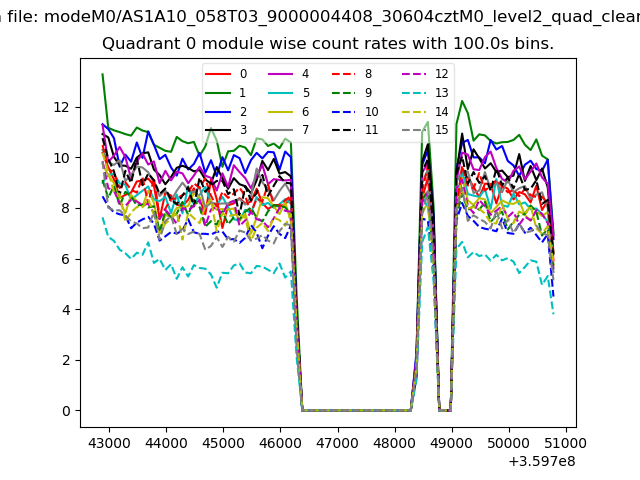 |
 |
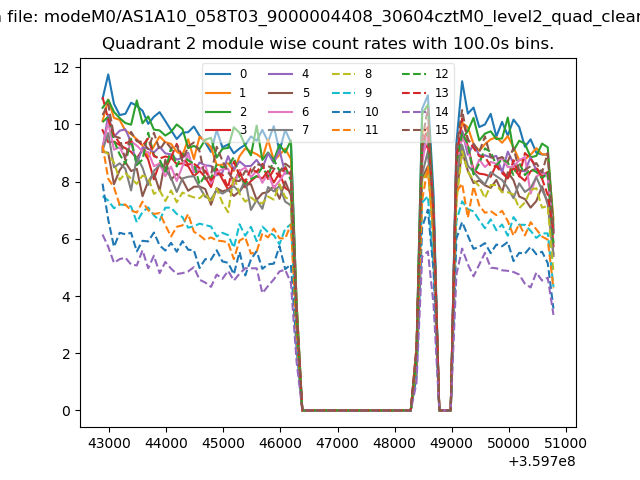
| Module-wise count rates for Quadrant B Data is divided into 100 sec bins |
 |
 |
| Module-wise count rates for Quadrant C Data is divided into 100 sec bins |
 |
 |
| Module-wise count rates for Quadrant D Data is divided into 100 sec bins |
 |
 |
| Parameter | Plot |
|---|---|
| CZT HV Monitor | 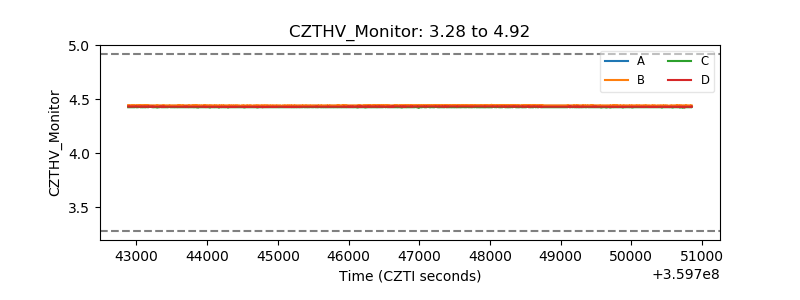 |
| D_VDD | 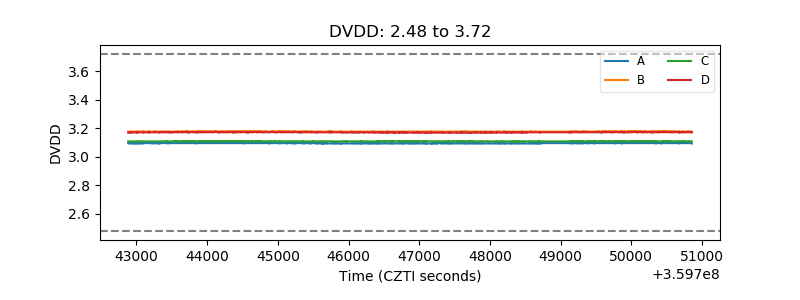 |
| Temperature 1 | 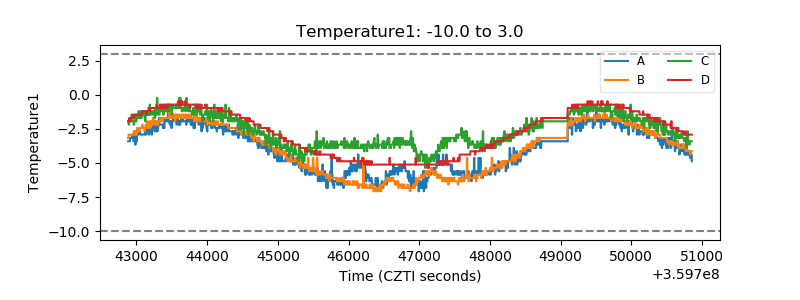 |
| Veto HV Monitor | 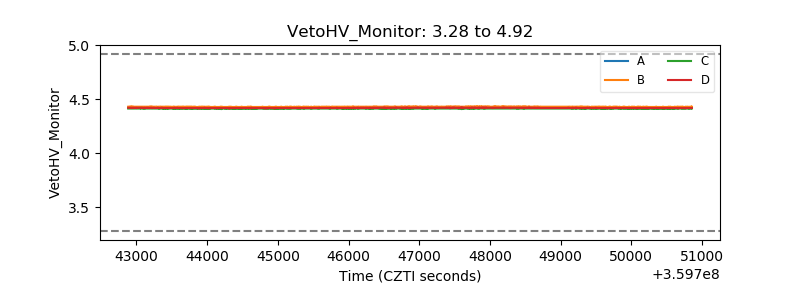 |
| Veto LLD | 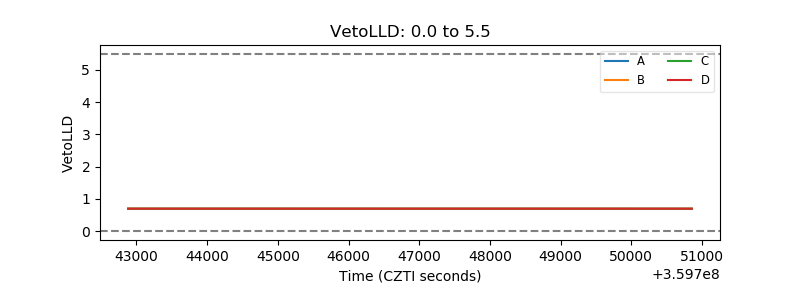 |
| Alpha Counter | 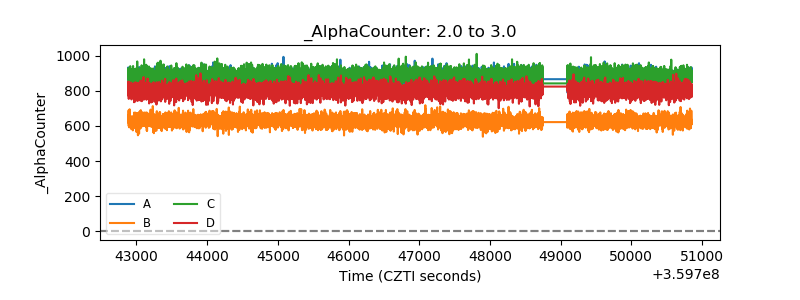 |
| _CPM_Rate | 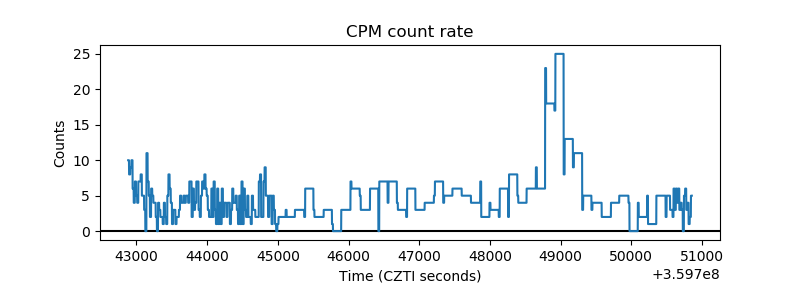 |
| CZT Counter | 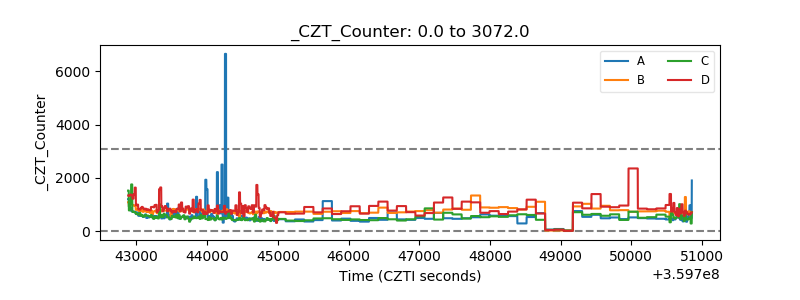 |
| +2.5 Volts monitor |  |
| +5 Volts monitor |  |
| _ROLL_ROT | 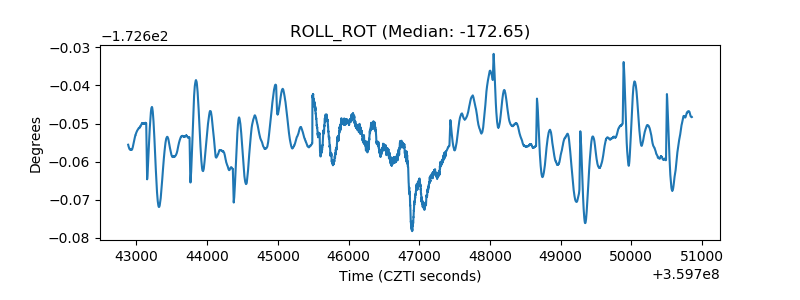 |
| _Roll_DEC | 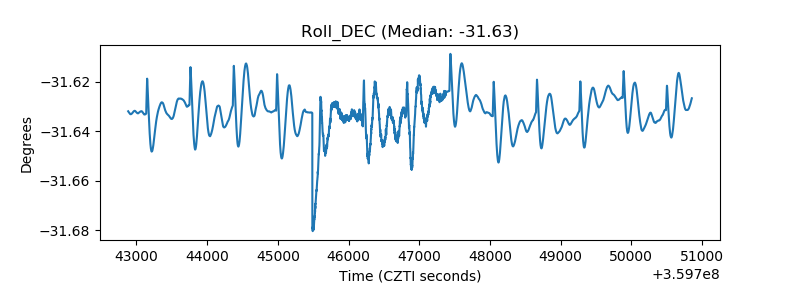 |
| _Roll_RA | 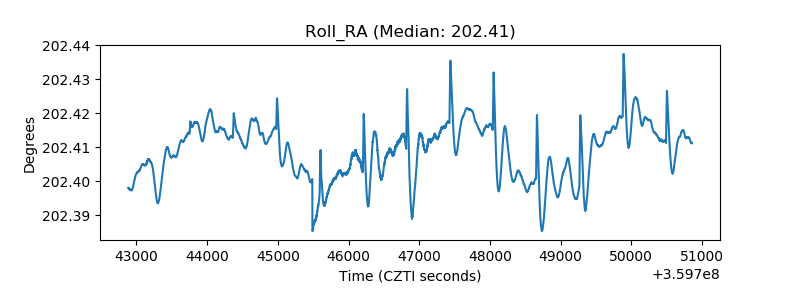 |
| Veto Counter | 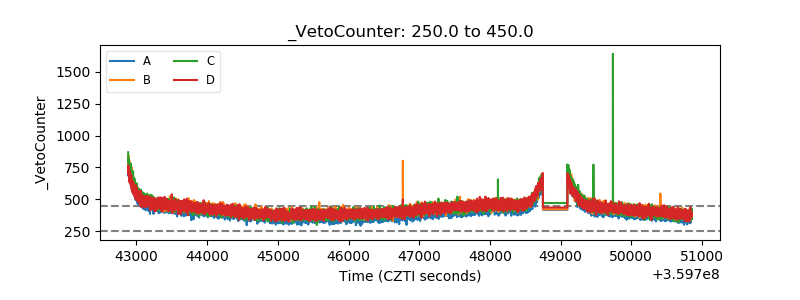 |