| Param | Original file | Final file |
|---|---|---|
| Filename | modeM0/AS1A10_058T03_9000004408_30605cztM0_level2.evt | modeM0/AS1A10_058T03_9000004408_30605cztM0_level2_quad_clean.evt |
| Size (bytes) | 708,791,040 | 102,902,400 |
| Size | 676.0 MB | 98.1 MB |
| Events in quadrant A | 3,738,179 | 689,630 |
| Events in quadrant B | 5,688,836 | 684,494 |
| Events in quadrant C | 4,104,932 | 651,203 |
| Events in quadrant D | 7,441,685 | 583,206 |
| Mode M0 | |||
|---|---|---|---|
| Quadrant | BADHDUFLAG | Total packets | Discarded packets |
| A | 0 | 15677 | 1 |
| B | 0 | 22304 | 1 |
| C | 0 | 16814 | 1 |
| D | 0 | 27507 | 4 |
| Mode SS | |||
|---|---|---|---|
| Quadrant | BADHDUFLAG | Total packets | Discarded packets |
| A | 0 | 148 | 0 |
| B | 0 | 148 | 0 |
| C | 0 | 148 | 0 |
| D | 0 | 148 | 0 |
| Mode M9 | |||
|---|---|---|---|
| Quadrant | BADHDUFLAG | Total packets | Discarded packets |
| A | 0 | 1 | 0 |
| B | 0 | 1 | 0 |
| C | 0 | 1 | 0 |
| D | 0 | 1 | 0 |
| Quadrant | Total seconds | Saturated seconds | Saturation percentage |
|---|---|---|---|
| A | 7286 | 75 | 1.029371% |
| B | 7287 | 188 | 2.579937% |
| C | 7287 | 191 | 2.621106% |
| D | 7286 | 863 | 11.844634% |
Noise dominated data is calculated using 1-second bins in cleaned event files. If a bin has >2000 counts, and if more than 50% of those come from <1% of pixels, then it is considered to be noise-dominated and hence unusable.
| Quadrant | # 1 sec bins | Bins with >0 counts | Bins with >2000 counts | High rate bins dominated by noise | Noise dominated (total time) | Noise dominated (detector-on time) | Marked lightcurve |
|---|---|---|---|---|---|---|---|
| A | 7376 | 7287 | 14 | 14 | 0.19% | 0.19% | 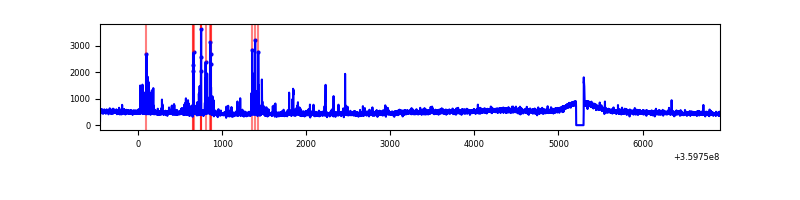 |
| B | 7377 | 7288 | 6 | 6 | 0.08% | 0.08% | 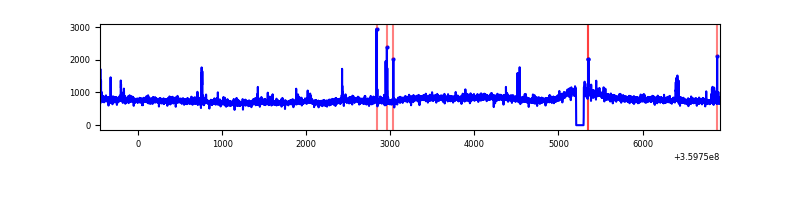 |
| C | 7377 | 7288 | 56 | 56 | 0.76% | 0.77% | 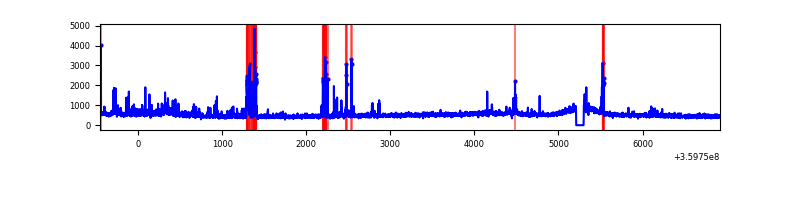 |
| D | 7376 | 7287 | 655 | 655 | 8.88% | 8.99% | 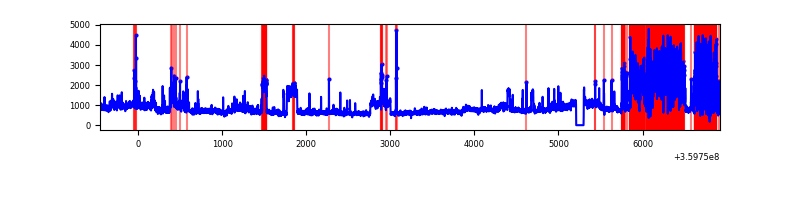 |
Top three noisy pixels from each quadrant. If the there are fewer than three noisy pixels in the level2.evt file, extra rows are filled as -1
| Pixel properties | Quadrant properties | ||||||
|---|---|---|---|---|---|---|---|
| Quadrant | DetID | PixID | Counts | Sigma | Mean | Median | Sigma |
| A | 0 | 13 | 199854 | 1083.75 | 913 | 896 | 183.6 |
| A | 13 | 254 | 12540 | 63.43 | 913 | 896 | 183.6 |
| A | 8 | 192 | 9927 | 49.19 | 913 | 896 | 183.6 |
| B | 6 | 159 | 2038902 | 11732.02 | 897 | 874 | 173.7 |
| B | 0 | 229 | 36469 | 204.9 | 897 | 874 | 173.7 |
| B | 5 | 172 | 28573 | 159.45 | 897 | 874 | 173.7 |
| C | 15 | 208 | 430679 | 2135.37 | 858 | 862 | 201.3 |
| C | 3 | 233 | 165044 | 815.67 | 858 | 862 | 201.3 |
| C | 14 | 238 | 136280 | 672.77 | 858 | 862 | 201.3 |
| D | 8 | 195 | 2205669 | 11186.87 | 827 | 803 | 197.1 |
| D | 12 | 218 | 1420518 | 7203.24 | 827 | 803 | 197.1 |
| D | 1 | 52 | 233164 | 1178.93 | 827 | 803 | 197.1 |
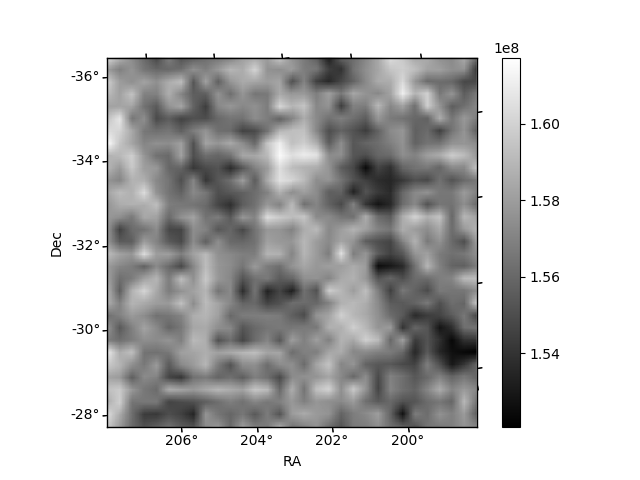
Histogram calculated using DETX and DETY for each event in the final _common_clean file
| Quadrant A | 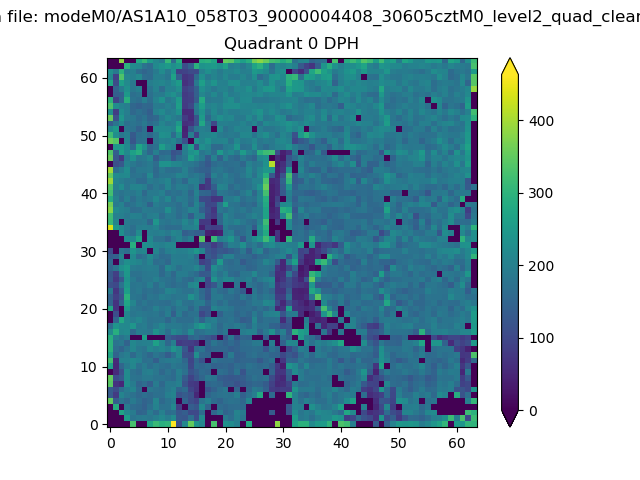 |
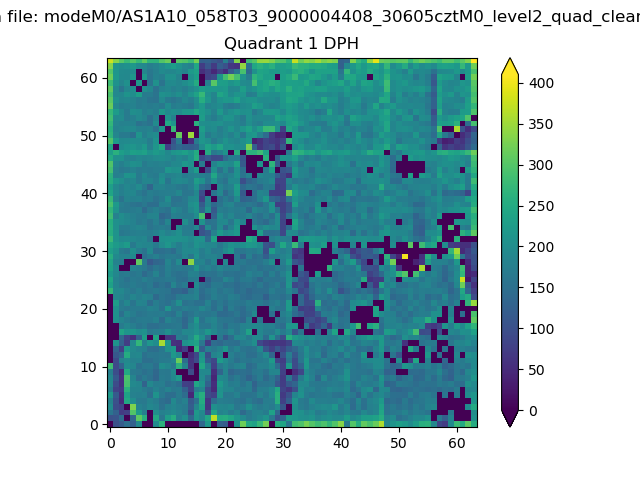 |
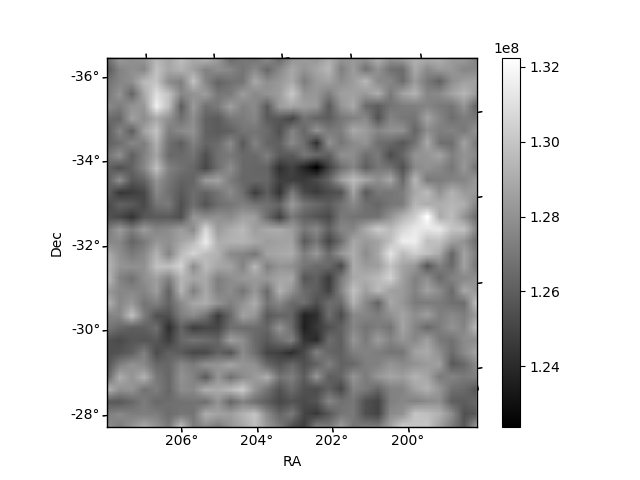
Quadrant B |
|---|---|---|---|
| Quadrant D | 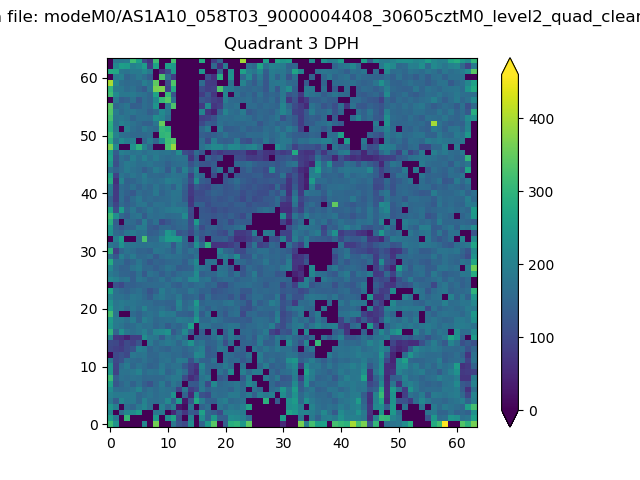 |
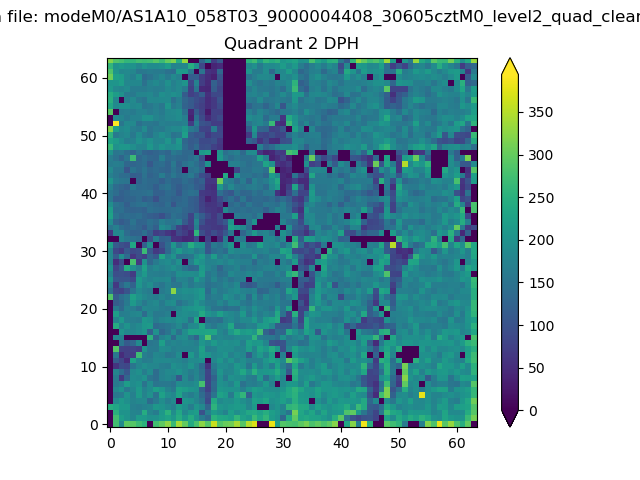 |
Quadrant C |
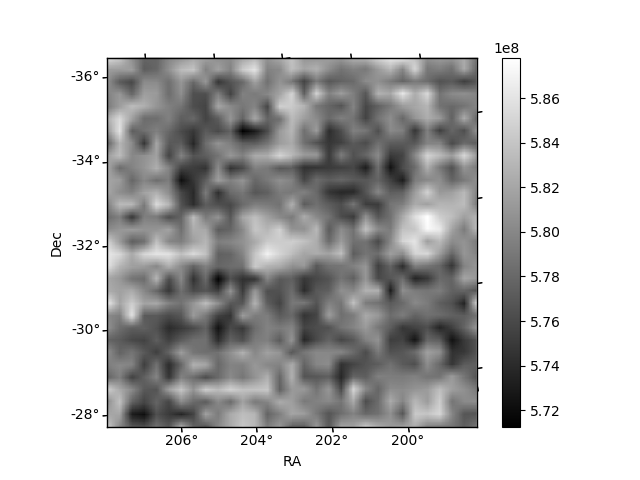
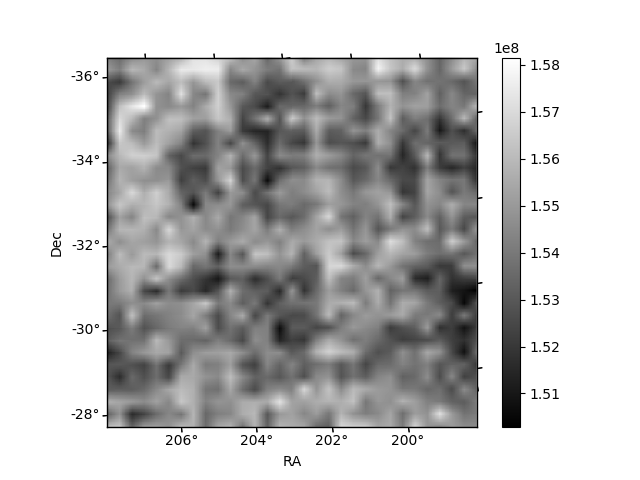
| Plot type | Count rate plots | Images |
|---|---|---|
| Comparison with Poisson distribution Blue bars denote a histogram of data divided into 1 sec bins. Red curve is a Poisson curve with rate = median count rate of data. |
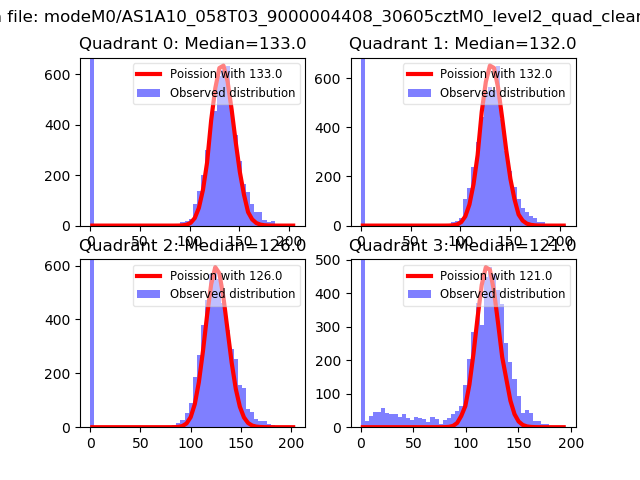 |
 |
| Quadrant-wise count rates Data is divided into 100 sec bins |
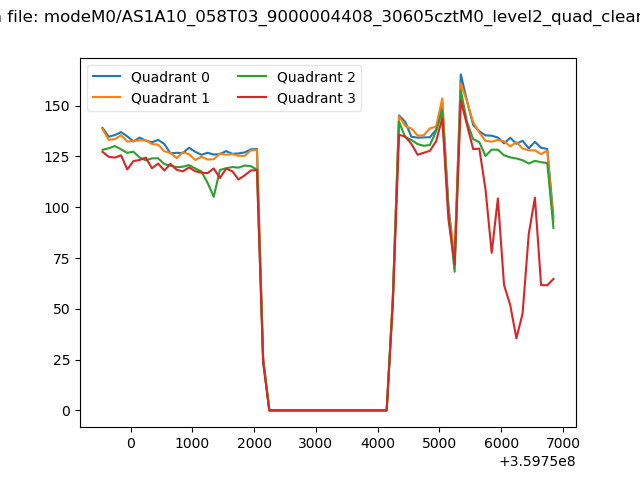 |
|
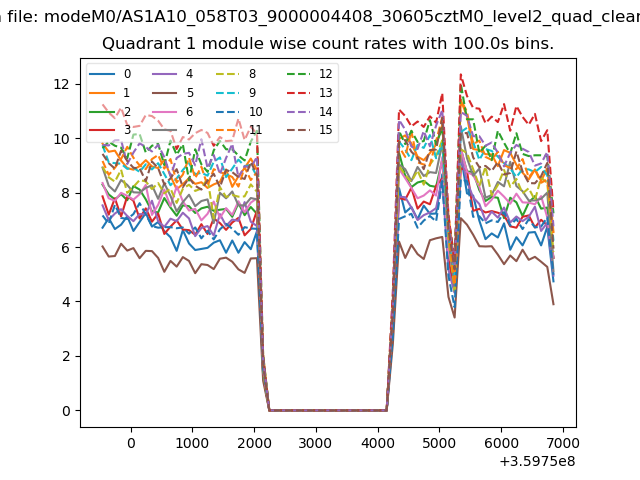
| Module-wise count rates for Quadrant A Data is divided into 100 sec bins |
 |
 |
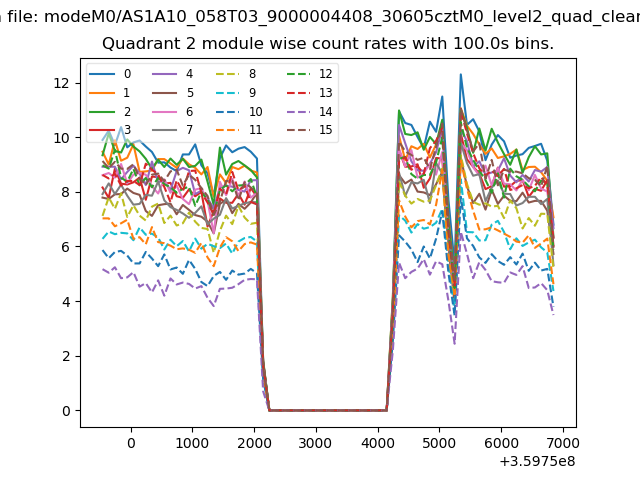
| Module-wise count rates for Quadrant B Data is divided into 100 sec bins |
 |
 |
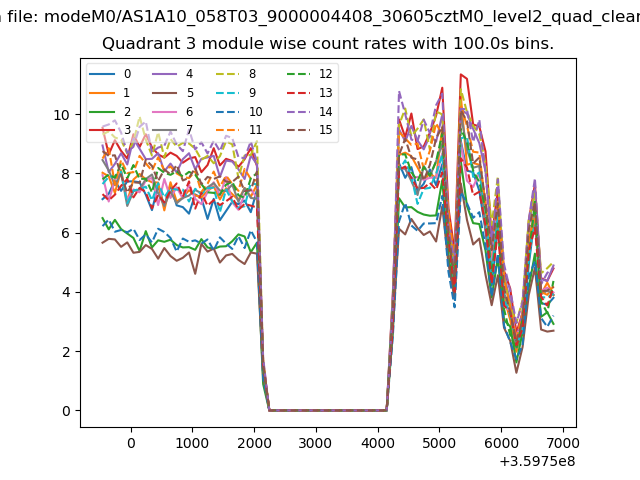
| Module-wise count rates for Quadrant C Data is divided into 100 sec bins |
 |
 |
| Module-wise count rates for Quadrant D Data is divided into 100 sec bins |
 |
 |
| Parameter | Plot |
|---|---|
| CZT HV Monitor | 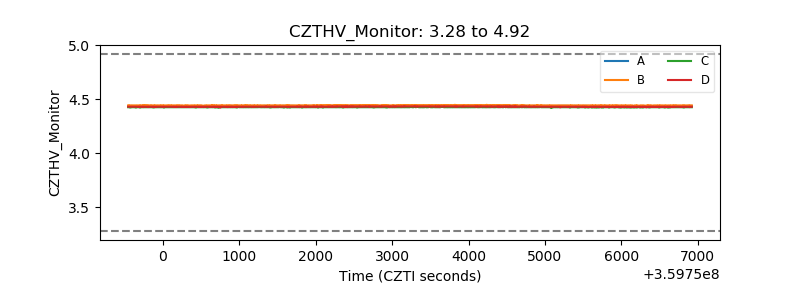 |
| D_VDD | 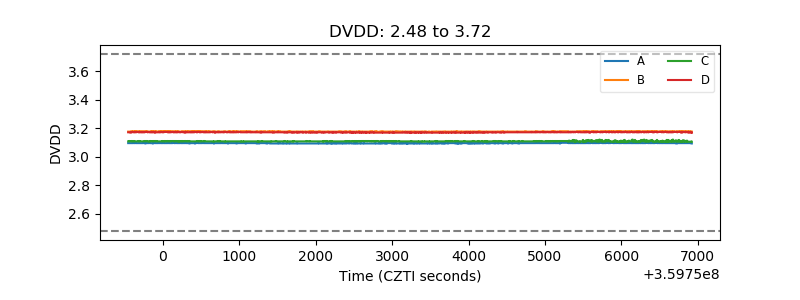 |
| Temperature 1 | 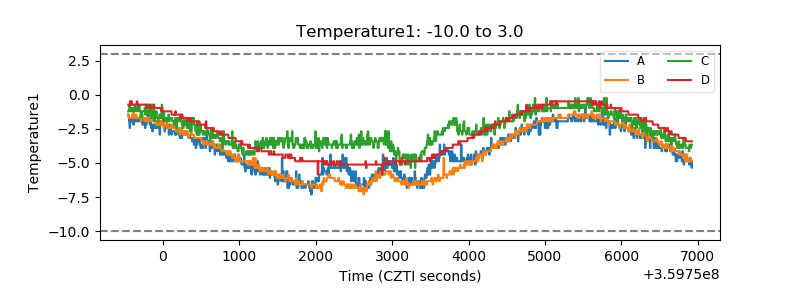 |
| Veto HV Monitor | 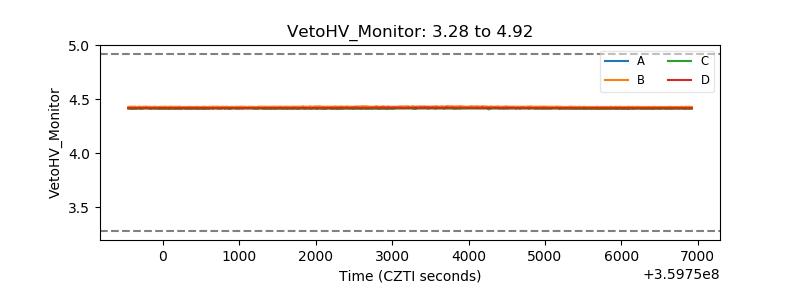 |
| Veto LLD | 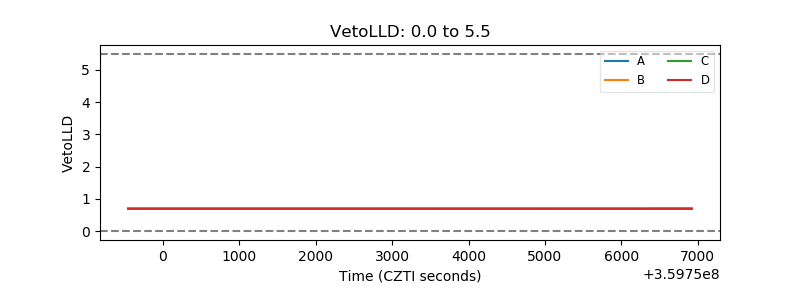 |
| Alpha Counter | 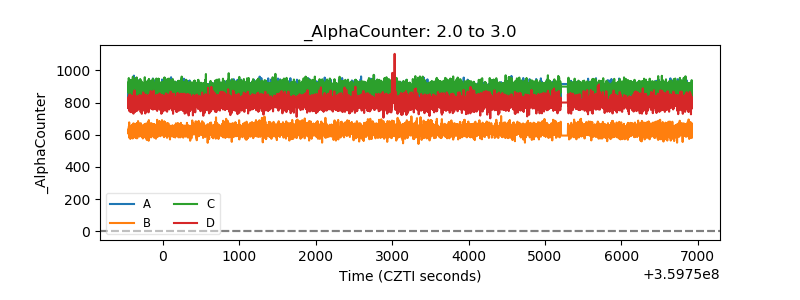 |
| _CPM_Rate | 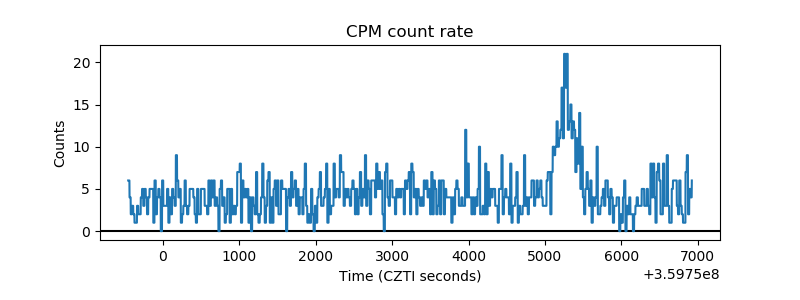 |
| CZT Counter | 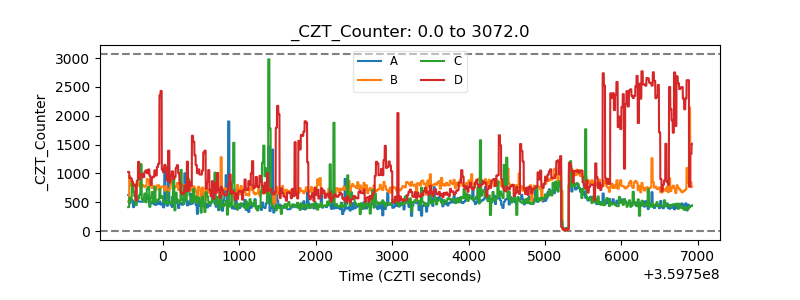 |
| +2.5 Volts monitor | 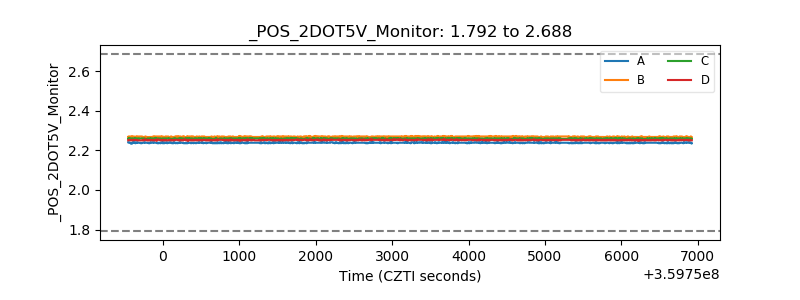 |
| +5 Volts monitor |  |
| _ROLL_ROT |  |
| _Roll_DEC | 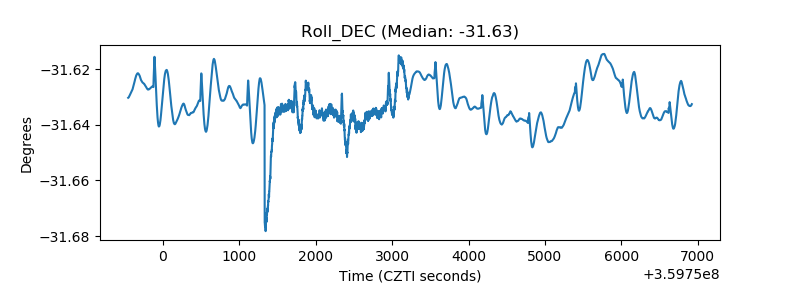 |
| _Roll_RA | 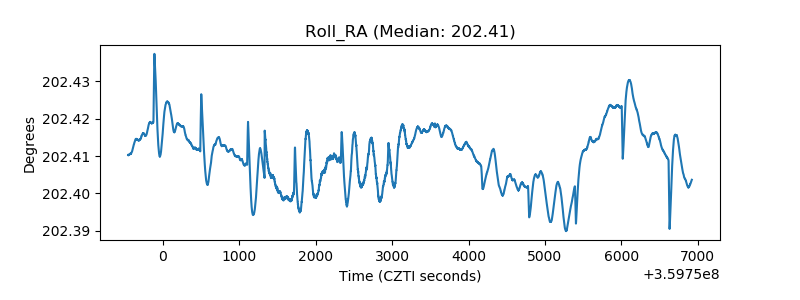 |
| Veto Counter | 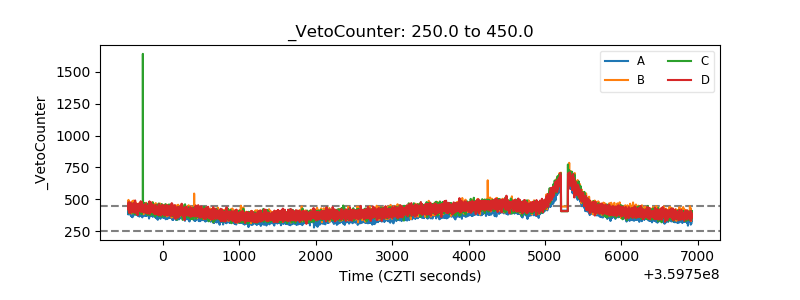 |