| Param | Original file | Final file |
|---|---|---|
| Filename | modeM0/AS1A10_058T03_9000004408_30606cztM0_level2.evt | modeM0/AS1A10_058T03_9000004408_30606cztM0_level2_quad_clean.evt |
| Size (bytes) | 644,137,920 | 92,113,920 |
| Size | 614.3 MB | 87.8 MB |
| Events in quadrant A | 3,229,798 | 619,084 |
| Events in quadrant B | 5,265,324 | 608,887 |
| Events in quadrant C | 3,607,458 | 583,568 |
| Events in quadrant D | 6,949,983 | 508,333 |
| Mode M0 | |||
|---|---|---|---|
| Quadrant | BADHDUFLAG | Total packets | Discarded packets |
| A | 0 | 13947 | 1 |
| B | 0 | 20450 | 1 |
| C | 0 | 14974 | 1 |
| D | 0 | 25381 | 1 |
| Mode SS | |||
|---|---|---|---|
| Quadrant | BADHDUFLAG | Total packets | Discarded packets |
| A | 0 | 138 | 0 |
| B | 0 | 138 | 0 |
| C | 0 | 138 | 0 |
| D | 0 | 138 | 0 |
| Mode M9 | |||
|---|---|---|---|
| Quadrant | BADHDUFLAG | Total packets | Discarded packets |
| A | 0 | 3 | 0 |
| B | 0 | 3 | 0 |
| C | 0 | 3 | 0 |
| D | 0 | 3 | 0 |
| Quadrant | Total seconds | Saturated seconds | Saturation percentage |
|---|---|---|---|
| A | 6728 | 25 | 0.371581% |
| B | 6729 | 91 | 1.352355% |
| C | 6729 | 138 | 2.050825% |
| D | 6729 | 940 | 13.969386% |
Noise dominated data is calculated using 1-second bins in cleaned event files. If a bin has >2000 counts, and if more than 50% of those come from <1% of pixels, then it is considered to be noise-dominated and hence unusable.
| Quadrant | # 1 sec bins | Bins with >0 counts | Bins with >2000 counts | High rate bins dominated by noise | Noise dominated (total time) | Noise dominated (detector-on time) | Marked lightcurve |
|---|---|---|---|---|---|---|---|
| A | 7088 | 6729 | 0 | 0 | 0.00% | 0.00% | 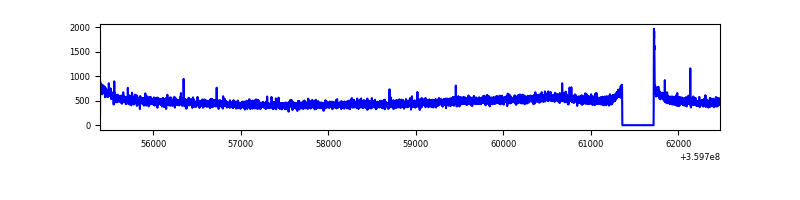 |
| B | 7089 | 6730 | 4 | 4 | 0.06% | 0.06% | 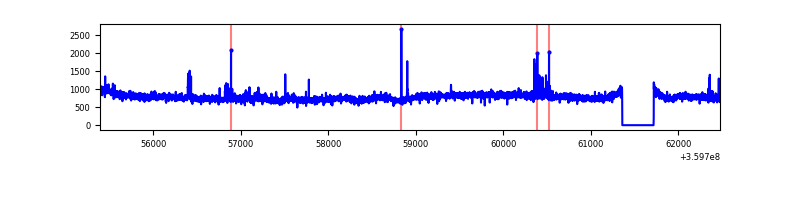 |
| C | 7089 | 6730 | 27 | 27 | 0.38% | 0.40% | 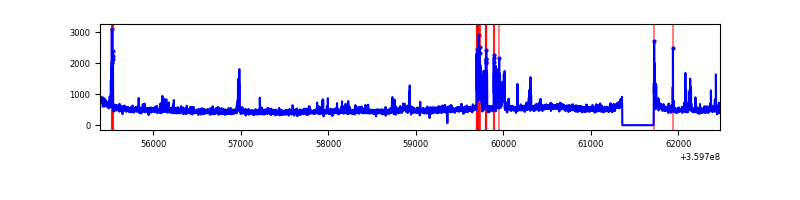 |
| D | 7089 | 6730 | 768 | 768 | 10.83% | 11.41% | 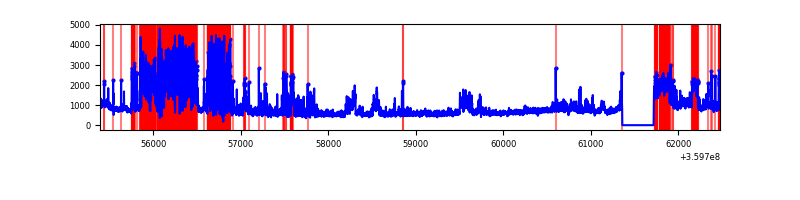 |
Top three noisy pixels from each quadrant. If the there are fewer than three noisy pixels in the level2.evt file, extra rows are filled as -1
| Pixel properties | Quadrant properties | ||||||
|---|---|---|---|---|---|---|---|
| Quadrant | DetID | PixID | Counts | Sigma | Mean | Median | Sigma |
| A | 8 | 192 | 12381 | 69.22 | 832 | 814 | 167.1 |
| A | 13 | 254 | 11818 | 65.85 | 832 | 814 | 167.1 |
| A | 3 | 137 | 8500 | 45.99 | 832 | 814 | 167.1 |
| B | 6 | 159 | 1920239 | 12185.55 | 819 | 799 | 157.5 |
| B | 6 | 36 | 43477 | 270.94 | 819 | 799 | 157.5 |
| B | 0 | 229 | 37326 | 231.89 | 819 | 799 | 157.5 |
| C | 15 | 208 | 303079 | 1623.0 | 785 | 789 | 186.3 |
| C | 14 | 238 | 126381 | 674.3 | 785 | 789 | 186.3 |
| C | 3 | 233 | 77835 | 413.66 | 785 | 789 | 186.3 |
| D | 8 | 195 | 2024037 | 11494.99 | 746 | 729 | 176.0 |
| D | 12 | 218 | 1482608 | 8418.98 | 746 | 729 | 176.0 |
| D | 1 | 52 | 233768 | 1323.96 | 746 | 729 | 176.0 |
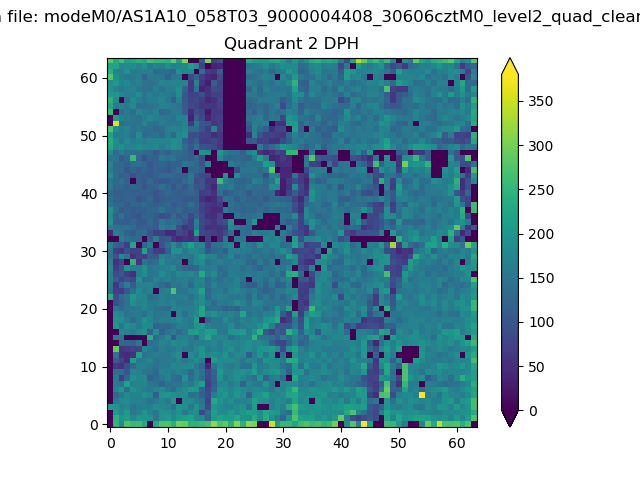
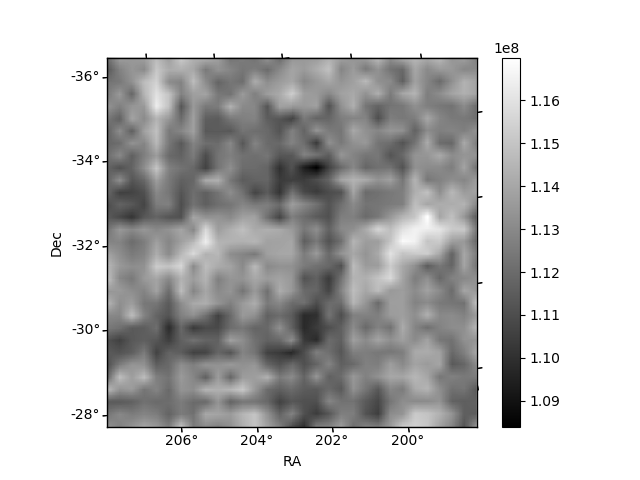
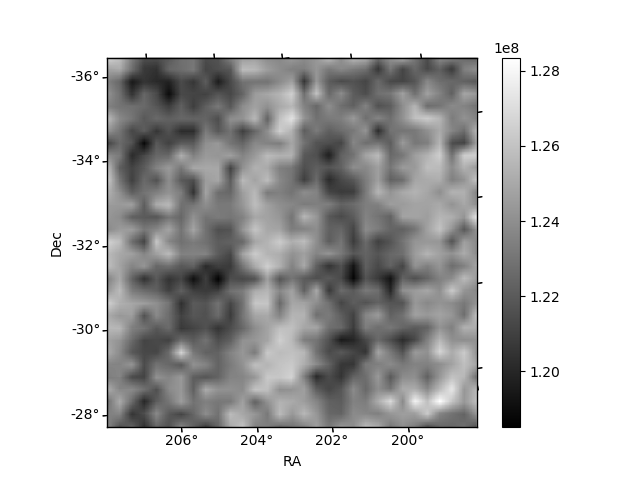
Histogram calculated using DETX and DETY for each event in the final _common_clean file
| Quadrant A | 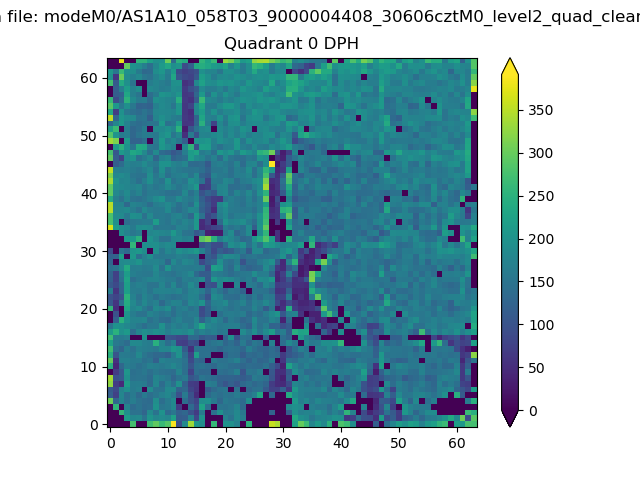 |
 |
Quadrant B |
|---|---|---|---|
| Quadrant D |  |
 |
Quadrant C |
| Plot type | Count rate plots | Images |
|---|---|---|
| Comparison with Poisson distribution Blue bars denote a histogram of data divided into 1 sec bins. Red curve is a Poisson curve with rate = median count rate of data. |
 |
 |
| Quadrant-wise count rates Data is divided into 100 sec bins |
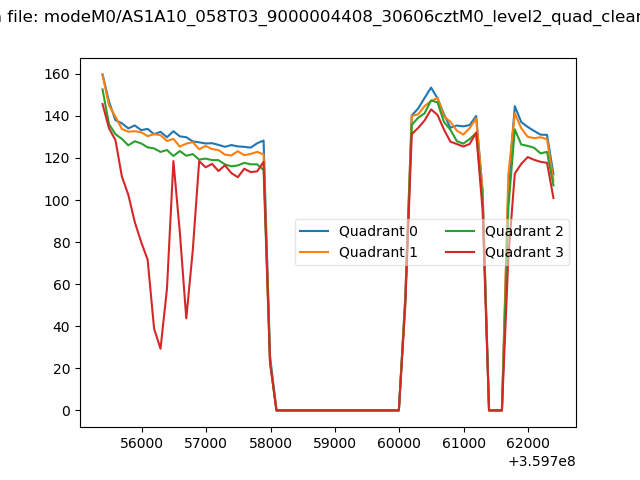 |
|
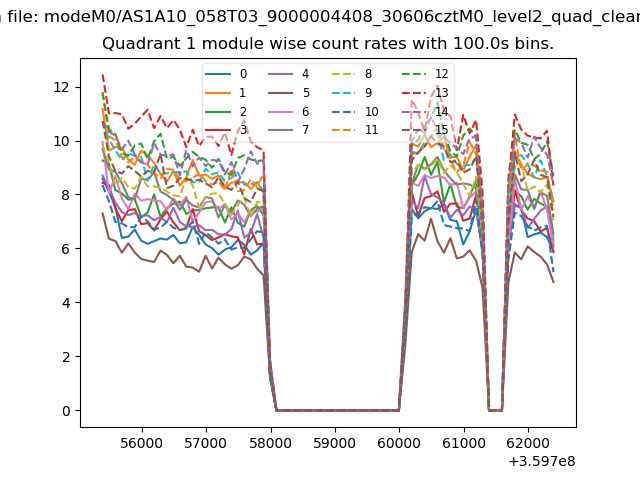
| Module-wise count rates for Quadrant A Data is divided into 100 sec bins |
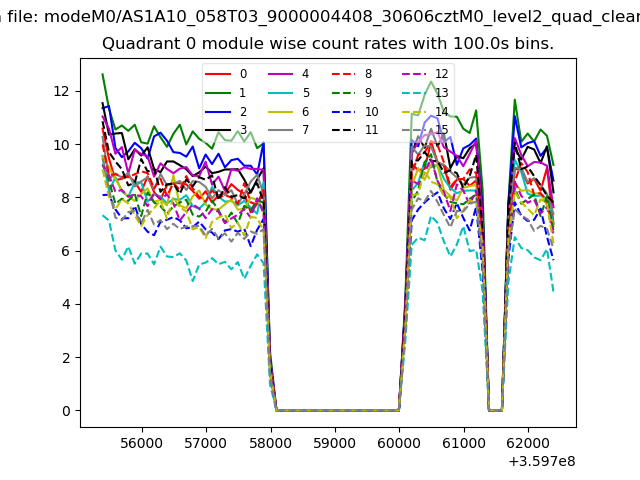 |
 |
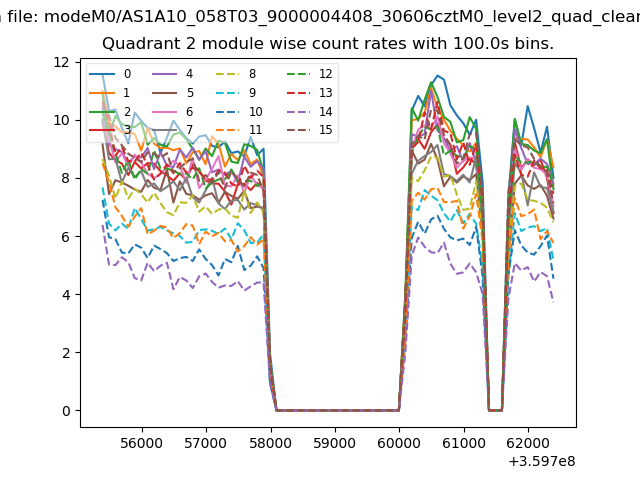
| Module-wise count rates for Quadrant B Data is divided into 100 sec bins |
 |
 |
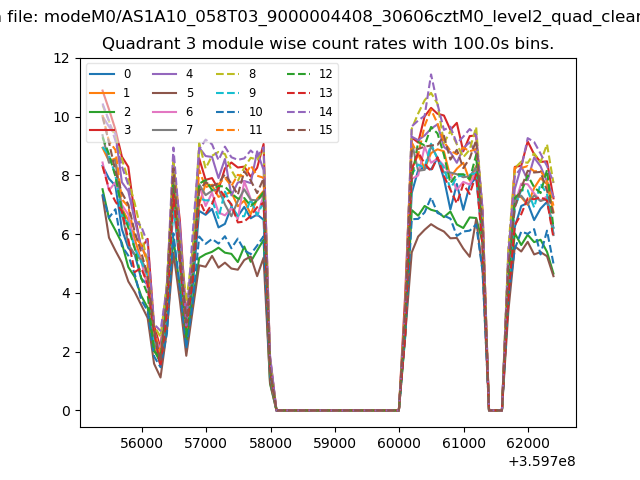
| Module-wise count rates for Quadrant C Data is divided into 100 sec bins |
 |
 |
| Module-wise count rates for Quadrant D Data is divided into 100 sec bins |
 |
 |
| Parameter | Plot |
|---|---|
| CZT HV Monitor | 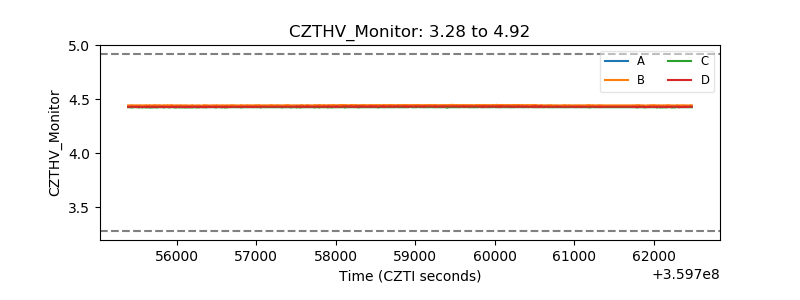 |
| D_VDD | 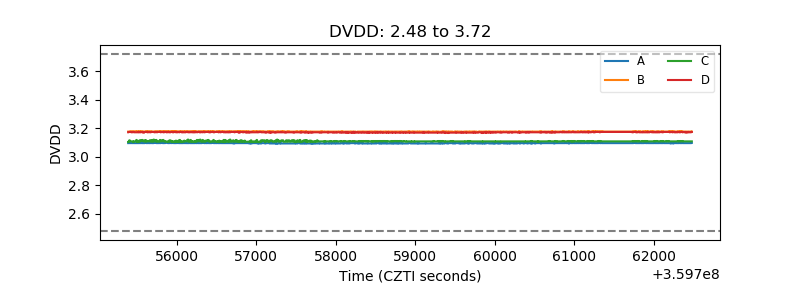 |
| Temperature 1 | 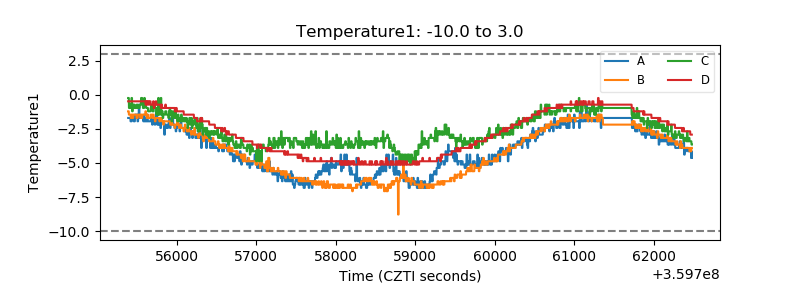 |
| Veto HV Monitor | 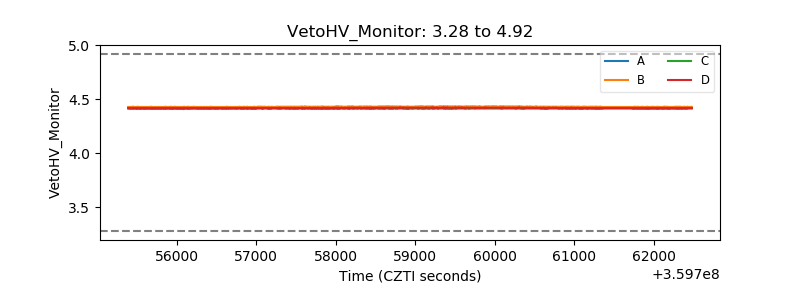 |
| Veto LLD | 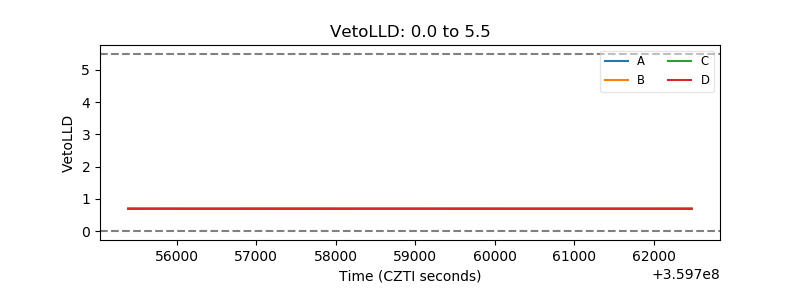 |
| Alpha Counter | 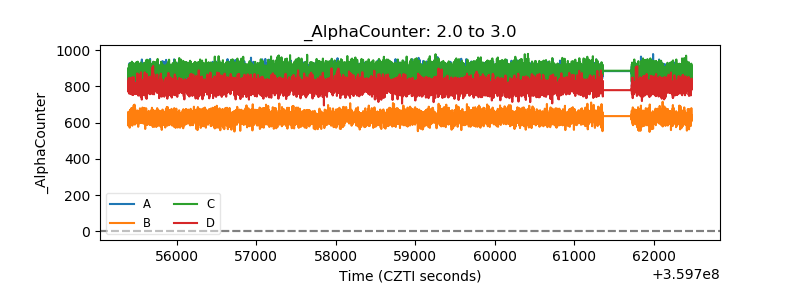 |
| _CPM_Rate | 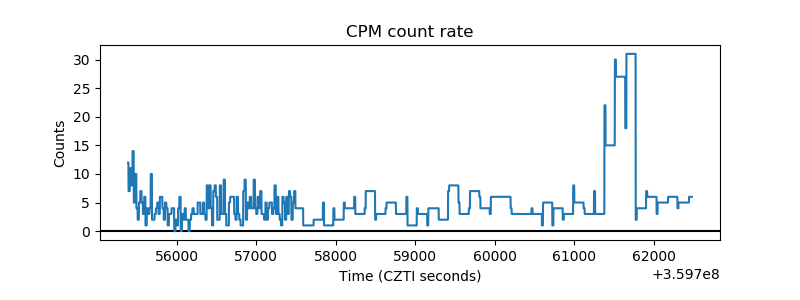 |
| CZT Counter |  |
| +2.5 Volts monitor |  |
| +5 Volts monitor |  |
| _ROLL_ROT |  |
| _Roll_DEC |  |
| _Roll_RA |  |
| Veto Counter | 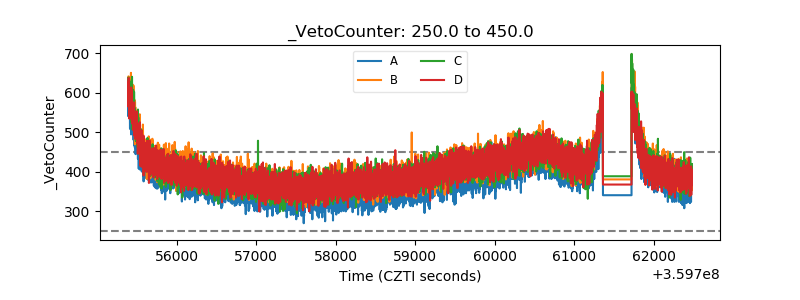 |