| Param | Original file | Final file |
|---|---|---|
| Filename | modeM0/AS1A10_058T03_9000004408_30608cztM0_level2.evt | modeM0/AS1A10_058T03_9000004408_30608cztM0_level2_quad_clean.evt |
| Size (bytes) | 105,546,240 | 19,558,080 |
| Size | 100.7 MB | 18.7 MB |
| Events in quadrant A | 521,935 | 135,365 |
| Events in quadrant B | 792,219 | 134,133 |
| Events in quadrant C | 563,795 | 126,914 |
| Events in quadrant D | 1,248,039 | 118,558 |
| Mode M0 | |||
|---|---|---|---|
| Quadrant | BADHDUFLAG | Total packets | Discarded packets |
| A | 0 | 2178 | 1 |
| B | 0 | 3038 | 1 |
| C | 0 | 2289 | 1 |
| D | 0 | 4411 | 1 |
| Mode SS | |||
|---|---|---|---|
| Quadrant | BADHDUFLAG | Total packets | Discarded packets |
| A | 0 | 24 | 0 |
| B | 0 | 24 | 0 |
| C | 0 | 24 | 0 |
| D | 0 | 24 | 0 |
| Mode M9 | |||
|---|---|---|---|
| Quadrant | BADHDUFLAG | Total packets | Discarded packets |
| A | 0 | 3 | 0 |
| B | 0 | 3 | 0 |
| C | 0 | 3 | 0 |
| D | 0 | 3 | 0 |
| Quadrant | Total seconds | Saturated seconds | Saturation percentage |
|---|---|---|---|
| A | 988 | 15 | 1.518219% |
| B | 989 | 34 | 3.437816% |
| C | 989 | 37 | 3.741153% |
| D | 989 | 164 | 16.582406% |
Noise dominated data is calculated using 1-second bins in cleaned event files. If a bin has >2000 counts, and if more than 50% of those come from <1% of pixels, then it is considered to be noise-dominated and hence unusable.
| Quadrant | # 1 sec bins | Bins with >0 counts | Bins with >2000 counts | High rate bins dominated by noise | Noise dominated (total time) | Noise dominated (detector-on time) | Marked lightcurve |
|---|---|---|---|---|---|---|---|
| A | 1348 | 989 | 0 | 0 | 0.00% | 0.00% | 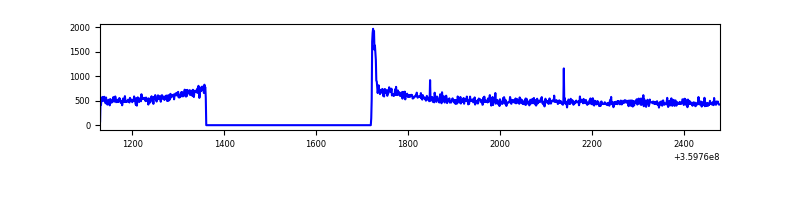 |
| B | 1349 | 990 | 0 | 0 | 0.00% | 0.00% | 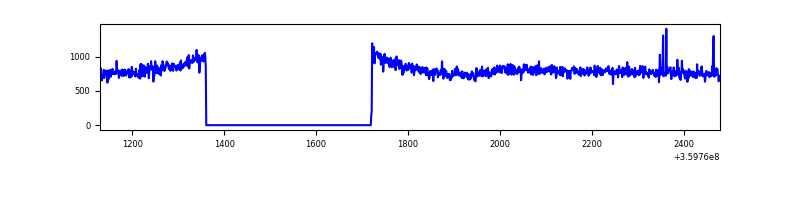 |
| C | 1349 | 990 | 2 | 2 | 0.15% | 0.20% | 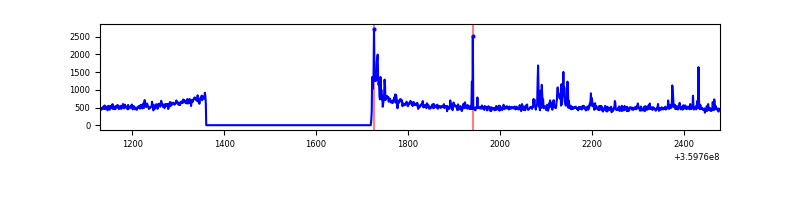 |
| D | 1349 | 990 | 135 | 135 | 10.01% | 13.64% | 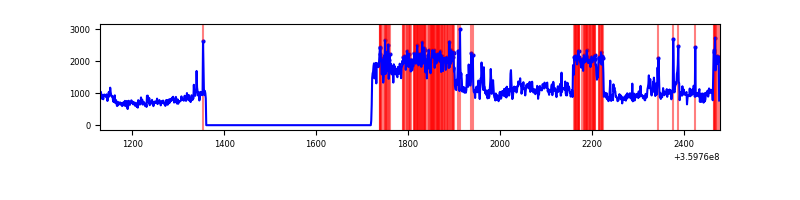 |
Top three noisy pixels from each quadrant. If the there are fewer than three noisy pixels in the level2.evt file, extra rows are filled as -1
| Pixel properties | Quadrant properties | ||||||
|---|---|---|---|---|---|---|---|
| Quadrant | DetID | PixID | Counts | Sigma | Mean | Median | Sigma |
| A | 8 | 192 | 11357 | 394.52 | 132 | 129 | 28.5 |
| A | 13 | 254 | 1778 | 57.94 | 132 | 129 | 28.5 |
| A | 3 | 137 | 1322 | 41.92 | 132 | 129 | 28.5 |
| B | 6 | 159 | 276463 | 10182.95 | 129 | 125 | 27.1 |
| B | 0 | 229 | 5476 | 197.18 | 129 | 125 | 27.1 |
| B | 12 | 111 | 3044 | 107.56 | 129 | 125 | 27.1 |
| C | 15 | 208 | 39488 | 1303.4 | 122 | 122 | 30.2 |
| C | 14 | 238 | 19232 | 632.73 | 122 | 122 | 30.2 |
| C | 0 | 10 | 15786 | 518.63 | 122 | 122 | 30.2 |
| D | 8 | 195 | 629502 | 20698.28 | 120 | 116 | 30.4 |
| D | 1 | 52 | 75232 | 2470.3 | 120 | 116 | 30.4 |
| D | 13 | 249 | 37207 | 1219.79 | 120 | 116 | 30.4 |
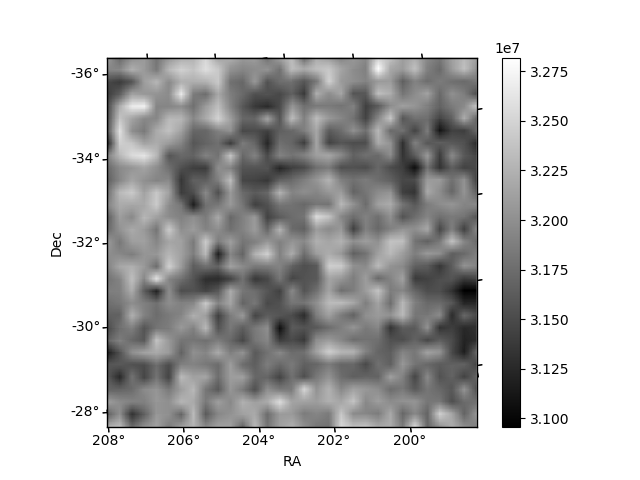
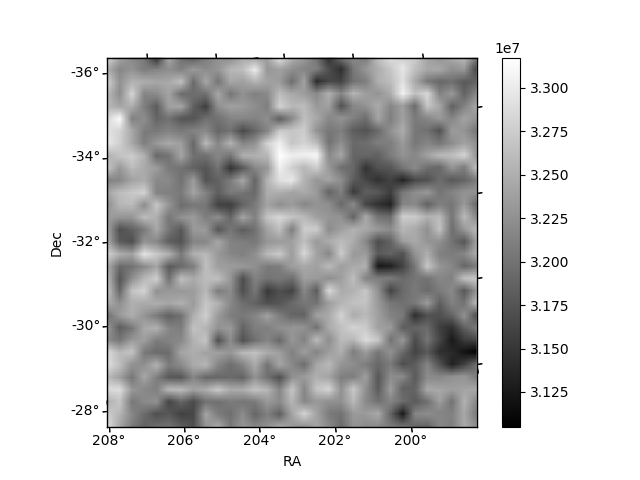
Histogram calculated using DETX and DETY for each event in the final _common_clean file
| Quadrant A | 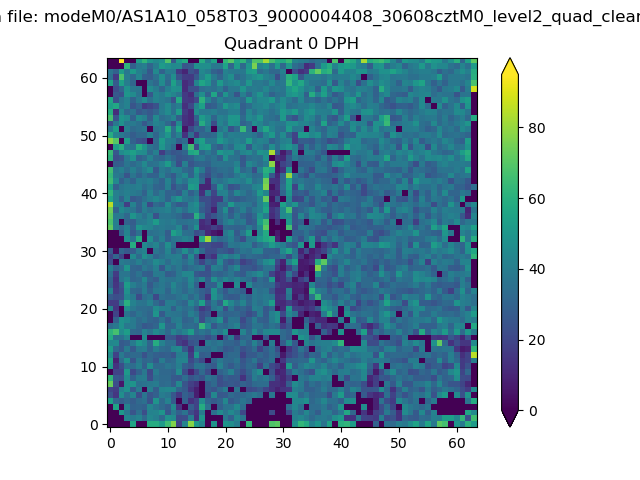 |
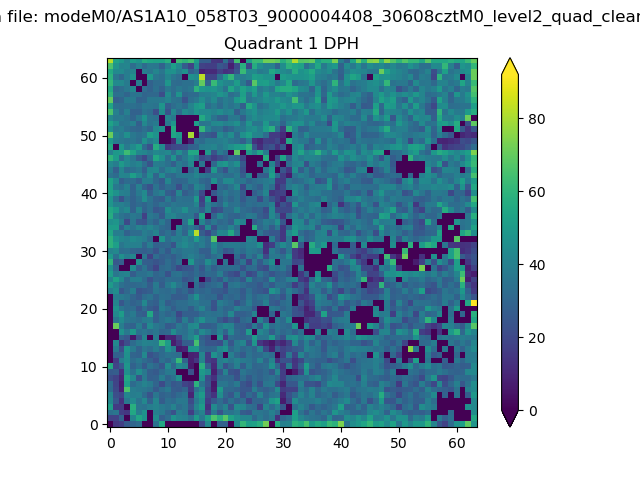 |
Quadrant B |
|---|---|---|---|
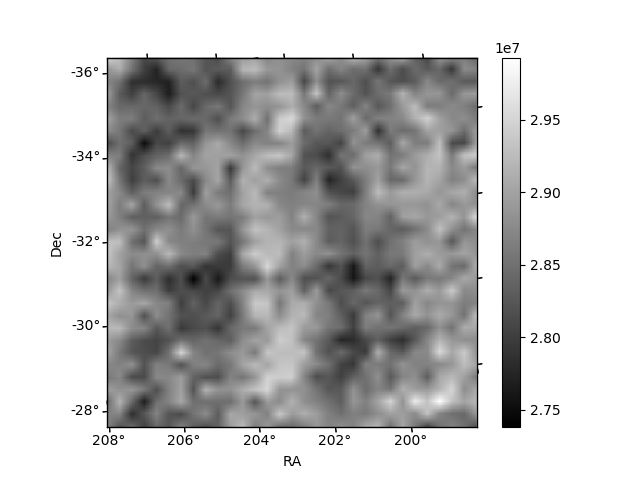
| Quadrant D | 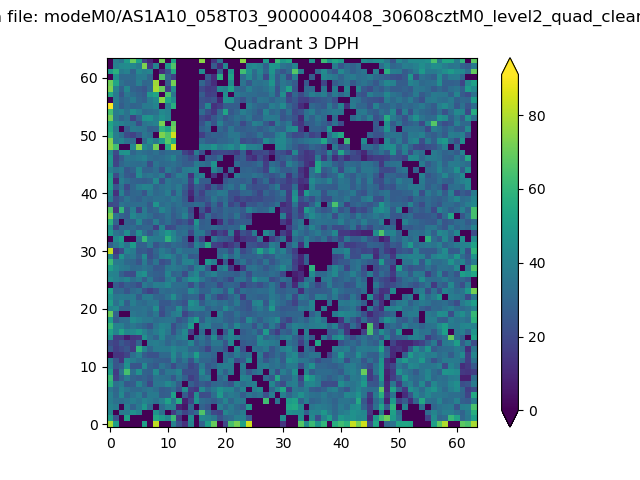 |
 |
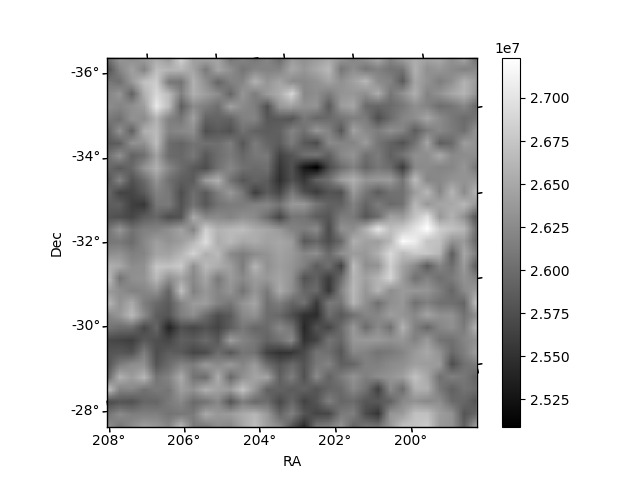
Quadrant C |
| Plot type | Count rate plots | Images |
|---|---|---|
| Comparison with Poisson distribution Blue bars denote a histogram of data divided into 1 sec bins. Red curve is a Poisson curve with rate = median count rate of data. |
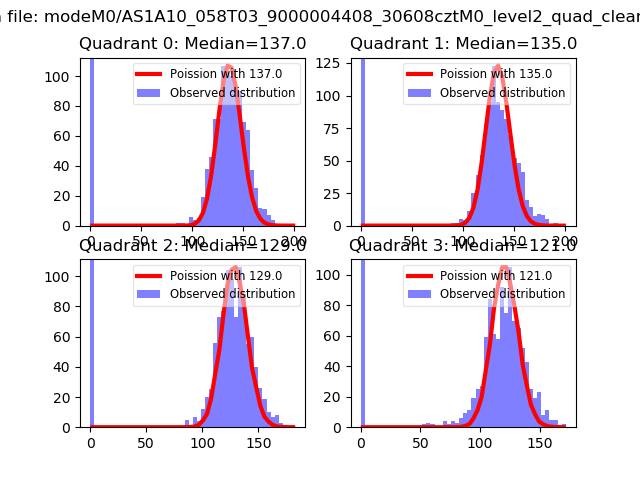 |
 |
| Quadrant-wise count rates Data is divided into 100 sec bins |
 |
|
| Module-wise count rates for Quadrant A Data is divided into 100 sec bins |
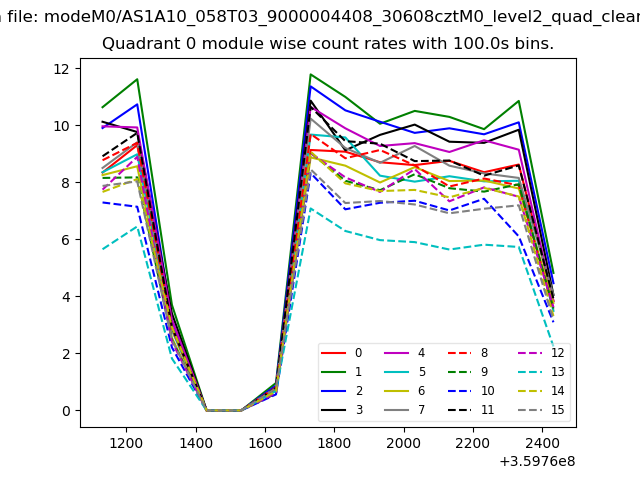 |
 |
| Module-wise count rates for Quadrant B Data is divided into 100 sec bins |
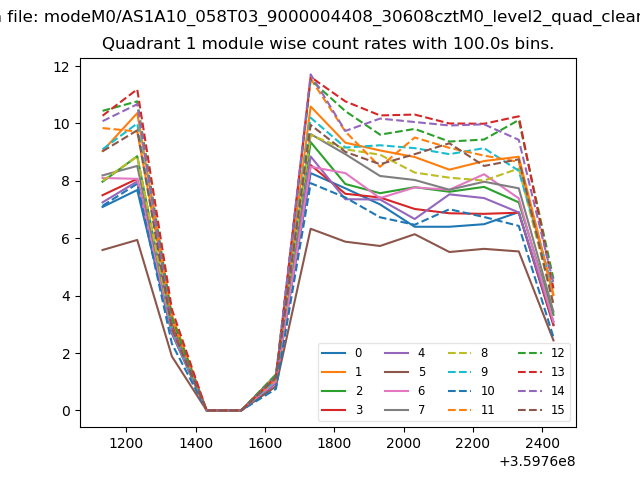 |
 |
| Module-wise count rates for Quadrant C Data is divided into 100 sec bins |
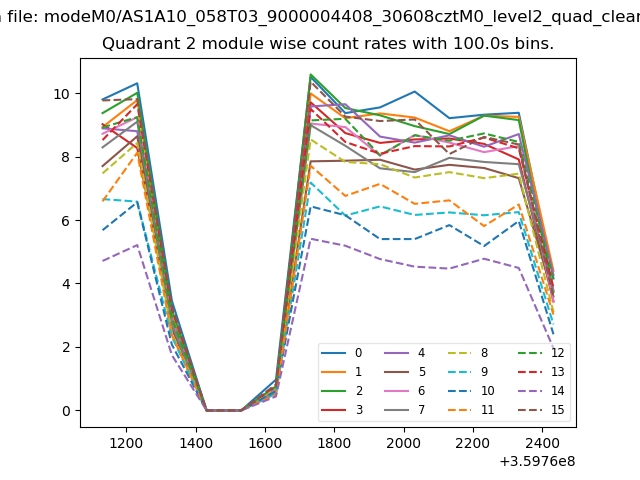 |
 |
| Module-wise count rates for Quadrant D Data is divided into 100 sec bins |
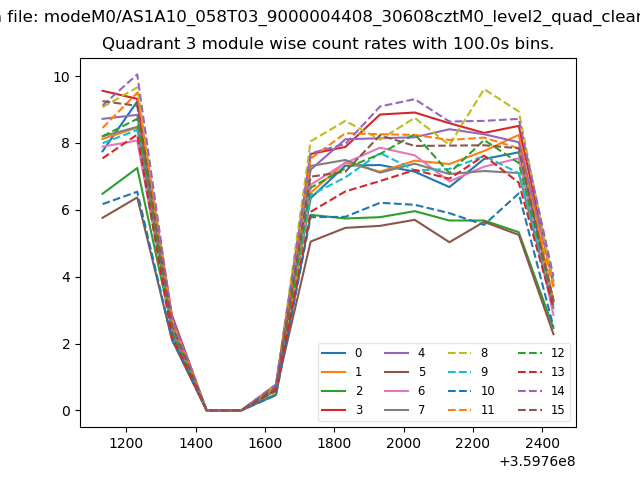 |
 |
| Parameter | Plot |
|---|---|
| CZT HV Monitor | 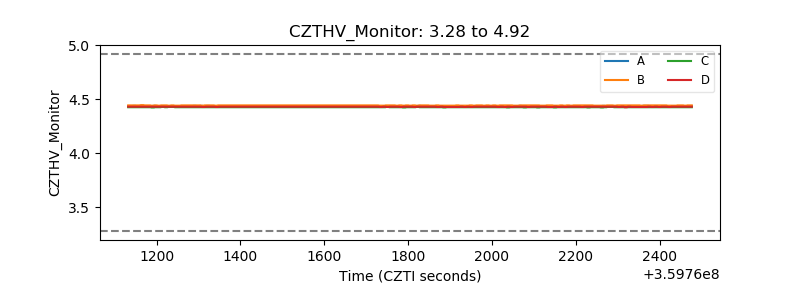 |
| D_VDD | 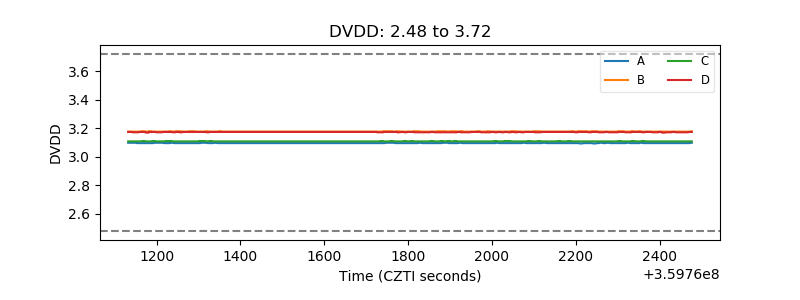 |
| Temperature 1 |  |
| Veto HV Monitor | 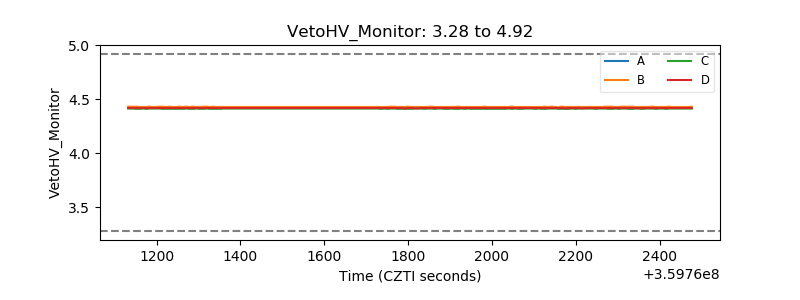 |
| Veto LLD | 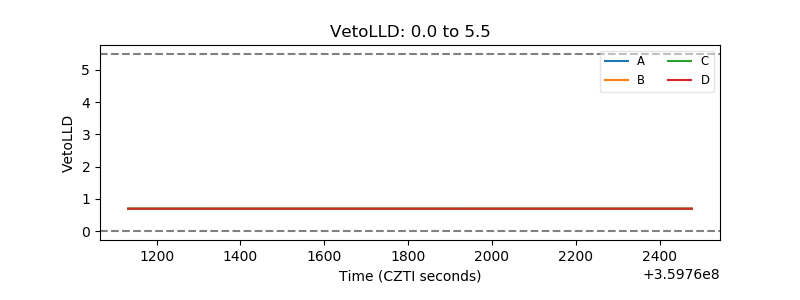 |
| Alpha Counter | 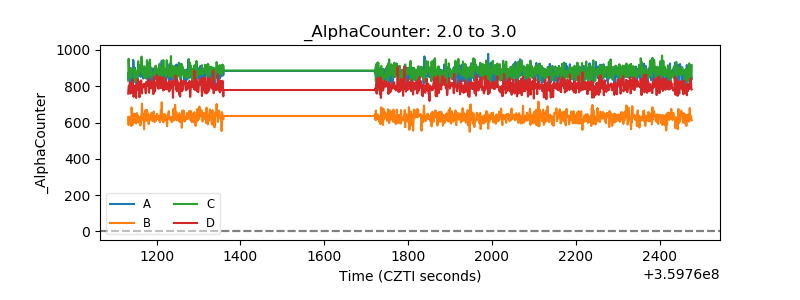 |
| _CPM_Rate | 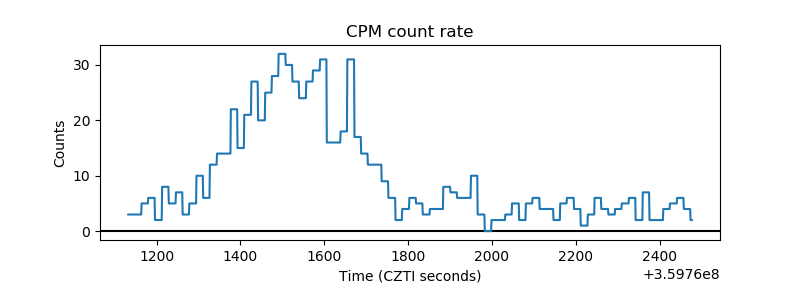 |
| CZT Counter |  |
| +2.5 Volts monitor |  |
| +5 Volts monitor |  |
| _ROLL_ROT | 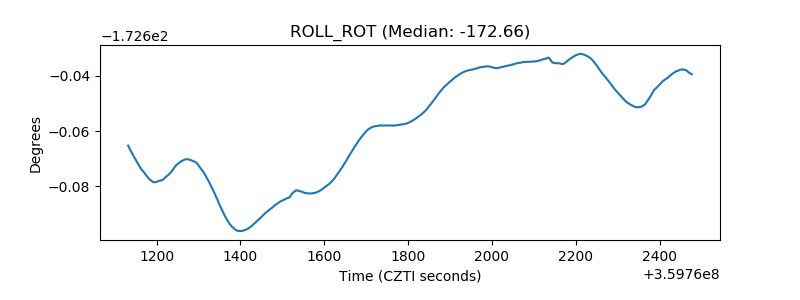 |
| _Roll_DEC | 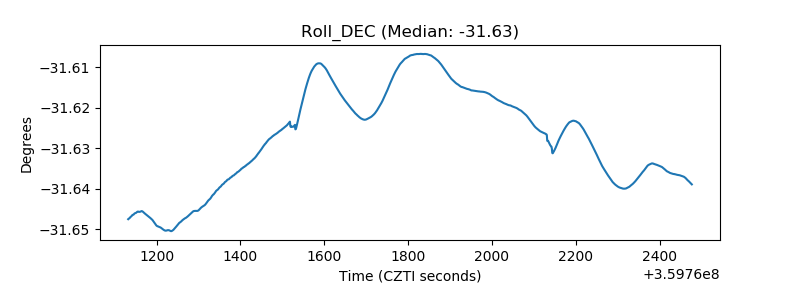 |
| _Roll_RA |  |
| Veto Counter | 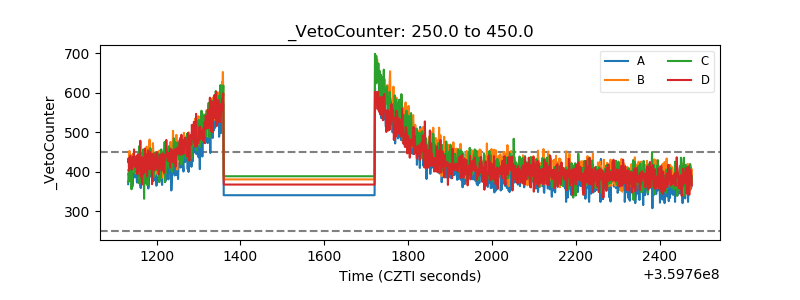 |