| Param | Original file | Final file |
|---|---|---|
| Filename | modeM0/AS1A10_021T09_9000004410_30608cztM0_level2.evt | modeM0/AS1A10_021T09_9000004410_30608cztM0_level2_quad_clean.evt |
| Size (bytes) | 1,143,740,160 | 142,323,840 |
| Size | 1.1 GB | 135.7 MB |
| Events in quadrant A | 6,590,131 | 901,718 |
| Events in quadrant B | 9,072,686 | 905,647 |
| Events in quadrant C | 6,587,078 | 860,579 |
| Events in quadrant D | 11,598,998 | 829,940 |
| Mode M0 | |||
|---|---|---|---|
| Quadrant | BADHDUFLAG | Total packets | Discarded packets |
| A | 0 | 27334 | 2 |
| B | 0 | 35532 | 4 |
| C | 0 | 26999 | 2 |
| D | 0 | 43126 | 2 |
| Mode M9 | |||
|---|---|---|---|
| Quadrant | BADHDUFLAG | Total packets | Discarded packets |
| A | 0 | 12 | 0 |
| B | 0 | 12 | 0 |
| C | 0 | 12 | 0 |
| D | 0 | 12 | 0 |
| Mode SS | |||
|---|---|---|---|
| Quadrant | BADHDUFLAG | Total packets | Discarded packets |
| A | 0 | 240 | 0 |
| B | 0 | 240 | 0 |
| C | 0 | 240 | 0 |
| D | 0 | 240 | 0 |
| Quadrant | Total seconds | Saturated seconds | Saturation percentage |
|---|---|---|---|
| A | 11736 | 217 | 1.849012% |
| B | 11735 | 137 | 1.167448% |
| C | 11735 | 248 | 2.113336% |
| D | 11735 | 388 | 3.306349% |
Noise dominated data is calculated using 1-second bins in cleaned event files. If a bin has >2000 counts, and if more than 50% of those come from <1% of pixels, then it is considered to be noise-dominated and hence unusable.
| Quadrant | # 1 sec bins | Bins with >0 counts | Bins with >2000 counts | High rate bins dominated by noise | Noise dominated (total time) | Noise dominated (detector-on time) | Marked lightcurve |
|---|---|---|---|---|---|---|---|
| A | 12966 | 11738 | 109 | 109 | 0.84% | 0.93% | 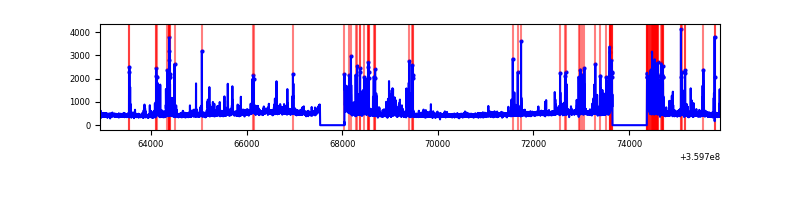 |
| B | 12965 | 11737 | 7 | 7 | 0.05% | 0.06% | 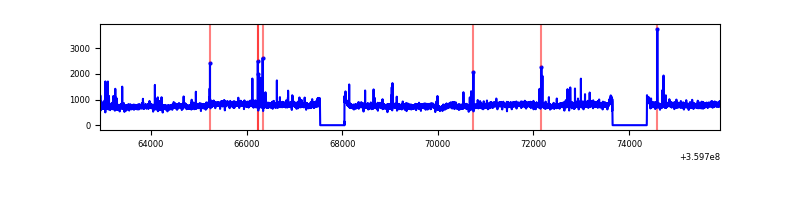 |
| C | 12965 | 11737 | 45 | 45 | 0.35% | 0.38% | 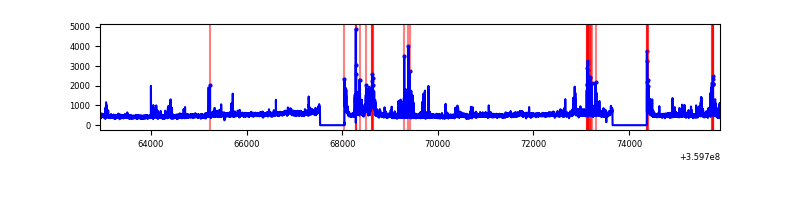 |
| D | 12965 | 11737 | 274 | 274 | 2.11% | 2.33% | 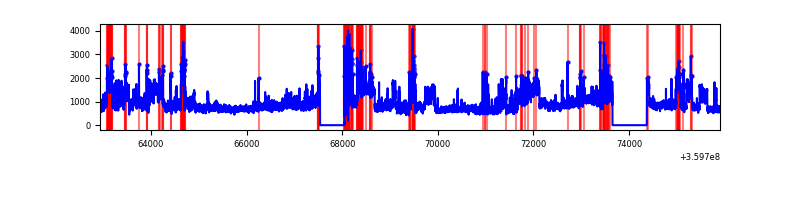 |
Top three noisy pixels from each quadrant. If the there are fewer than three noisy pixels in the level2.evt file, extra rows are filled as -1
| Pixel properties | Quadrant properties | ||||||
|---|---|---|---|---|---|---|---|
| Quadrant | DetID | PixID | Counts | Sigma | Mean | Median | Sigma |
| A | 0 | 13 | 1107774 | 3886.41 | 1415 | 1385 | 284.7 |
| A | 8 | 192 | 23365 | 77.21 | 1415 | 1385 | 284.7 |
| A | 13 | 254 | 21561 | 70.87 | 1415 | 1385 | 284.7 |
| B | 6 | 159 | 3365161 | 12431.8 | 1405 | 1367 | 270.6 |
| B | 0 | 229 | 103394 | 377.07 | 1405 | 1367 | 270.6 |
| B | 12 | 111 | 34354 | 121.91 | 1405 | 1367 | 270.6 |
| C | 15 | 208 | 831911 | 2625.26 | 1346 | 1355 | 316.4 |
| C | 14 | 238 | 216079 | 678.71 | 1346 | 1355 | 316.4 |
| C | 3 | 233 | 186427 | 584.98 | 1346 | 1355 | 316.4 |
| D | 8 | 195 | 5076529 | 15793.71 | 1349 | 1313 | 321.3 |
| D | 1 | 52 | 658973 | 2046.59 | 1349 | 1313 | 321.3 |
| D | 5 | 222 | 213575 | 660.54 | 1349 | 1313 | 321.3 |
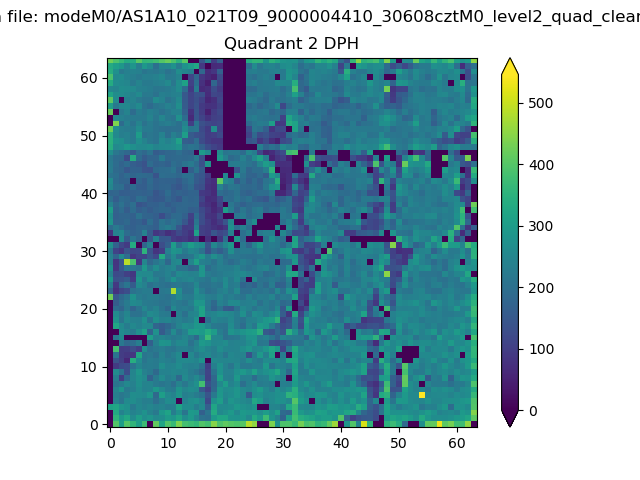
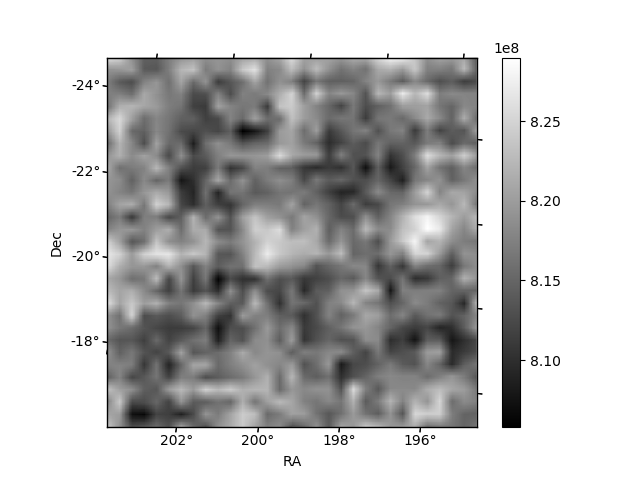
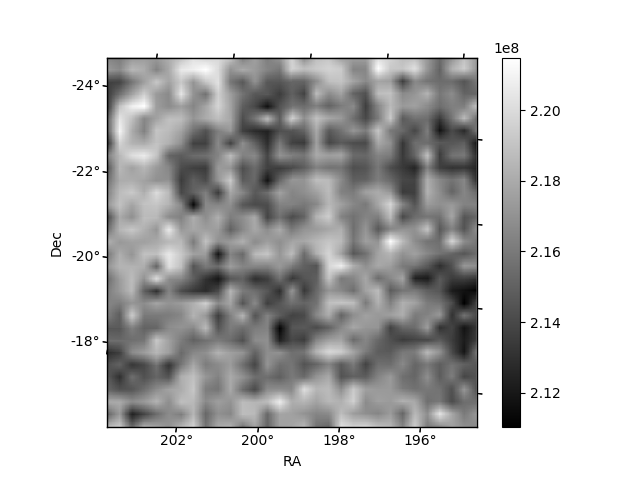
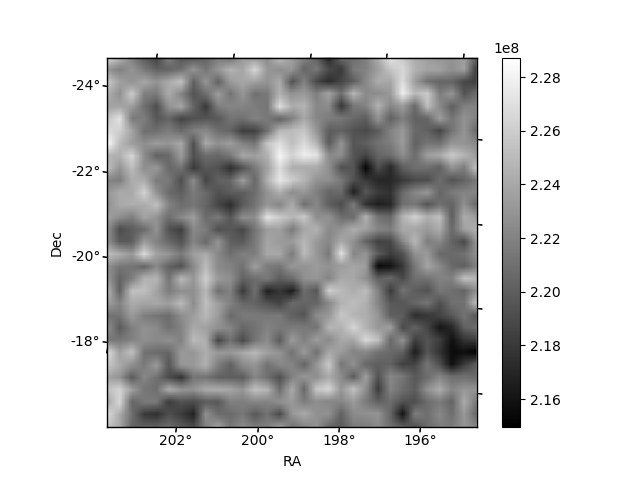
Histogram calculated using DETX and DETY for each event in the final _common_clean file
| Quadrant A | 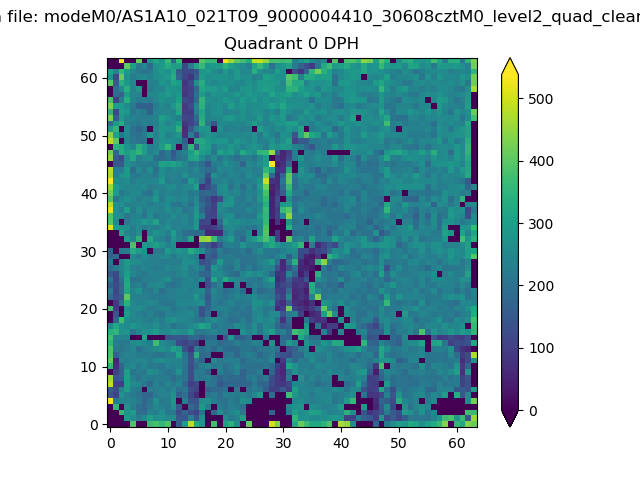 |
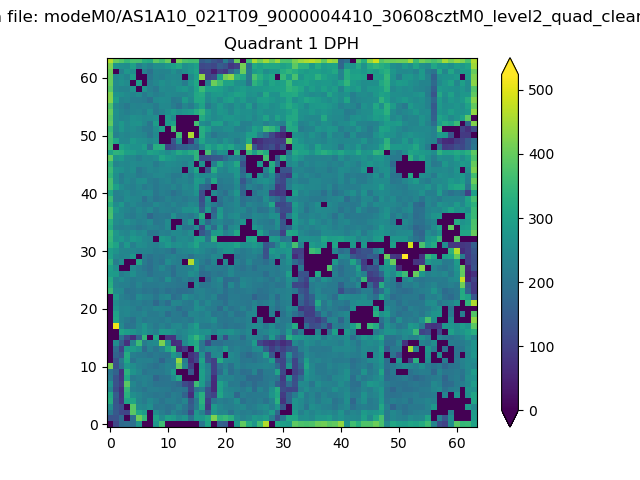 |
Quadrant B |
|---|---|---|---|
| Quadrant D | 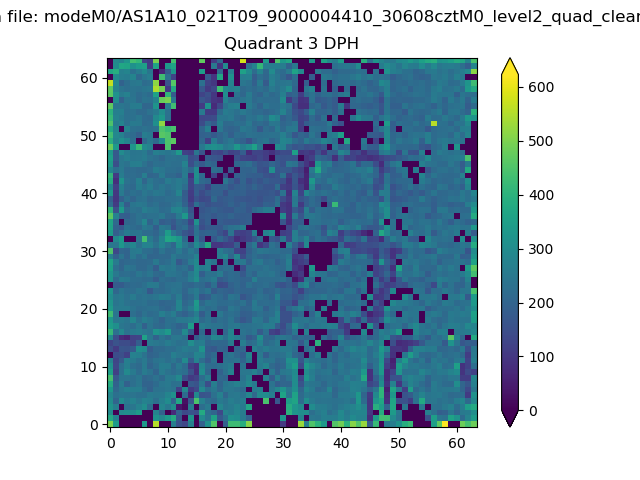 |
 |
Quadrant C |
| Plot type | Count rate plots | Images |
|---|---|---|
| Comparison with Poisson distribution Blue bars denote a histogram of data divided into 1 sec bins. Red curve is a Poisson curve with rate = median count rate of data. |
 |
 |
| Quadrant-wise count rates Data is divided into 100 sec bins |
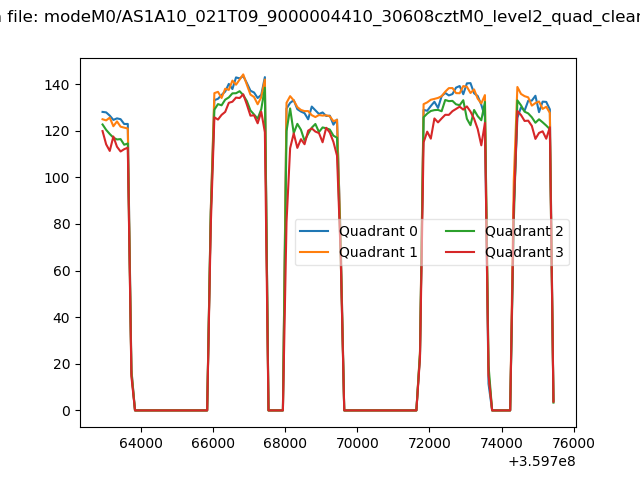 |
|
| Module-wise count rates for Quadrant A Data is divided into 100 sec bins |
 |
 |
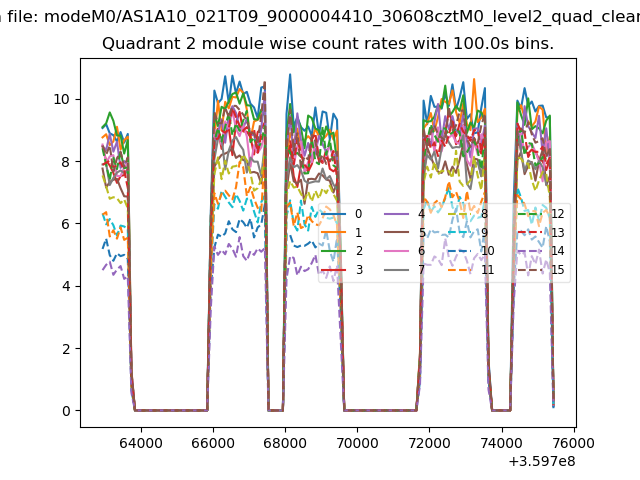
| Module-wise count rates for Quadrant B Data is divided into 100 sec bins |
 |
 |
| Module-wise count rates for Quadrant C Data is divided into 100 sec bins |
 |
 |
| Module-wise count rates for Quadrant D Data is divided into 100 sec bins |
 |
 |
| Parameter | Plot |
|---|---|
| CZT HV Monitor |  |
| D_VDD | 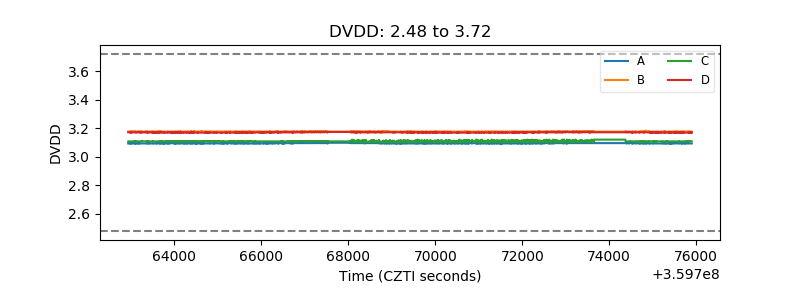 |
| Temperature 1 |  |
| Veto HV Monitor | 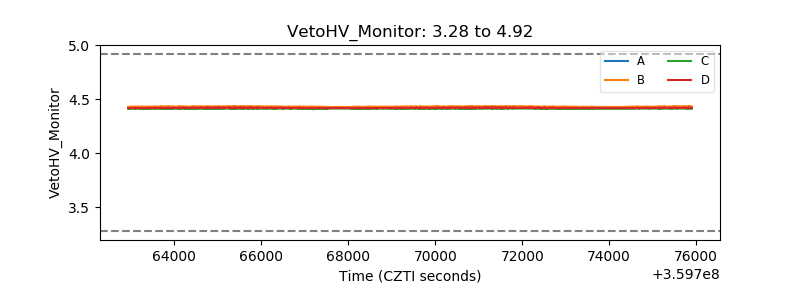 |
| Veto LLD | 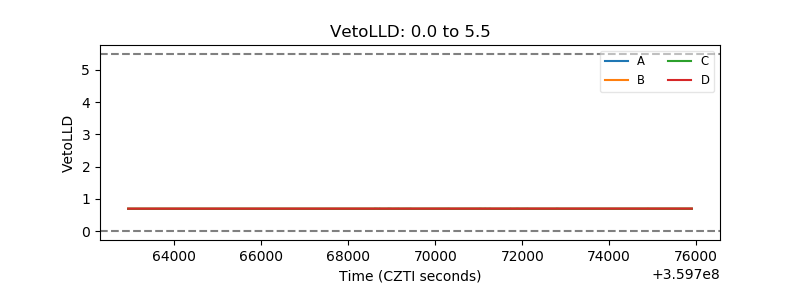 |
| Alpha Counter | 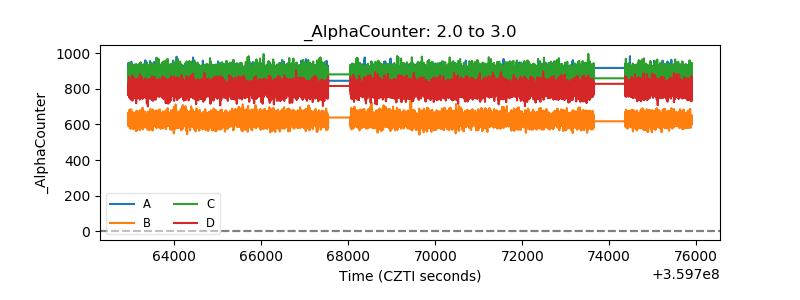 |
| _CPM_Rate | 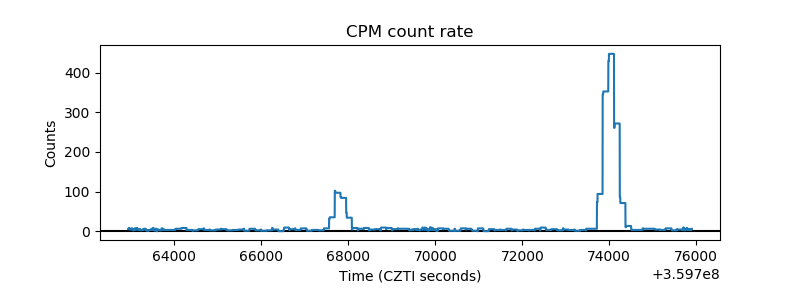 |
| CZT Counter | 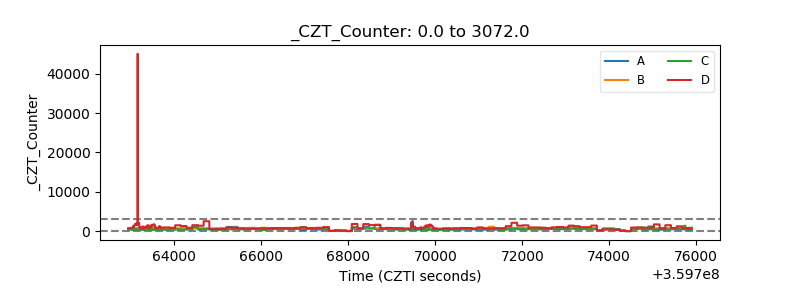 |
| +2.5 Volts monitor |  |
| +5 Volts monitor |  |
| _ROLL_ROT |  |
| _Roll_DEC |  |
| _Roll_RA | 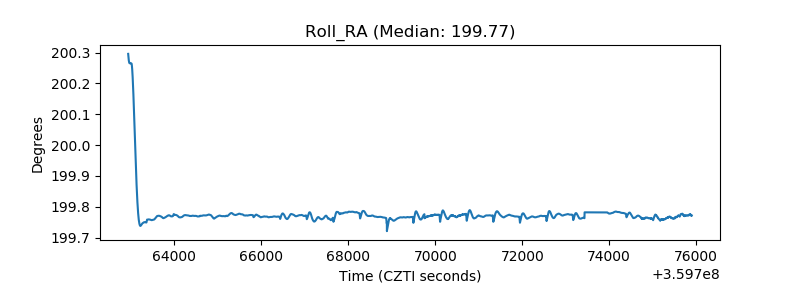 |
| Veto Counter |  |