| Param | Original file | Final file |
|---|---|---|
| Filename | modeM0/AS1A10_021T09_9000004410_30609cztM0_level2.evt | modeM0/AS1A10_021T09_9000004410_30609cztM0_level2_quad_clean.evt |
| Size (bytes) | 689,247,360 | 78,960,960 |
| Size | 657.3 MB | 75.3 MB |
| Events in quadrant A | 3,704,450 | 510,541 |
| Events in quadrant B | 5,230,932 | 511,808 |
| Events in quadrant C | 3,678,674 | 486,764 |
| Events in quadrant D | 7,810,003 | 416,761 |
| Mode M0 | |||
|---|---|---|---|
| Quadrant | BADHDUFLAG | Total packets | Discarded packets |
| A | 0 | 15231 | 2 |
| B | 0 | 20263 | 2 |
| C | 0 | 14880 | 2 |
| D | 0 | 28045 | 2 |
| Mode M9 | |||
|---|---|---|---|
| Quadrant | BADHDUFLAG | Total packets | Discarded packets |
| A | 0 | 9 | 0 |
| B | 0 | 9 | 0 |
| C | 0 | 9 | 0 |
| D | 0 | 9 | 0 |
| Mode SS | |||
|---|---|---|---|
| Quadrant | BADHDUFLAG | Total packets | Discarded packets |
| A | 0 | 136 | 0 |
| B | 0 | 136 | 0 |
| C | 0 | 136 | 0 |
| D | 0 | 136 | 0 |
| Quadrant | Total seconds | Saturated seconds | Saturation percentage |
|---|---|---|---|
| A | 6664 | 124 | 1.860744% |
| B | 6665 | 82 | 1.230308% |
| C | 6665 | 128 | 1.920480% |
| D | 6665 | 899 | 13.488372% |
Noise dominated data is calculated using 1-second bins in cleaned event files. If a bin has >2000 counts, and if more than 50% of those come from <1% of pixels, then it is considered to be noise-dominated and hence unusable.
| Quadrant | # 1 sec bins | Bins with >0 counts | Bins with >2000 counts | High rate bins dominated by noise | Noise dominated (total time) | Noise dominated (detector-on time) | Marked lightcurve |
|---|---|---|---|---|---|---|---|
| A | 7554 | 6665 | 63 | 63 | 0.83% | 0.95% | 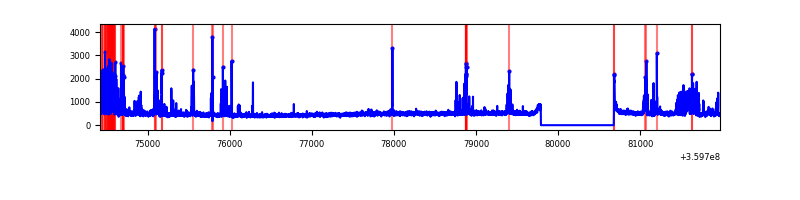 |
| B | 7555 | 6666 | 6 | 6 | 0.08% | 0.09% | 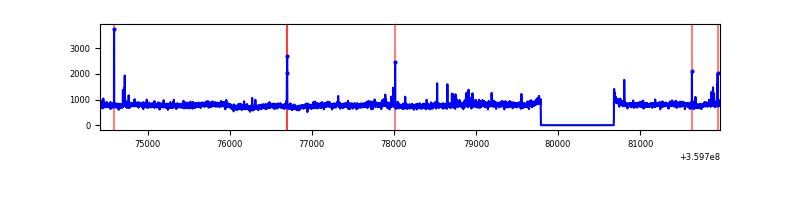 |
| C | 7555 | 6666 | 31 | 31 | 0.41% | 0.47% | 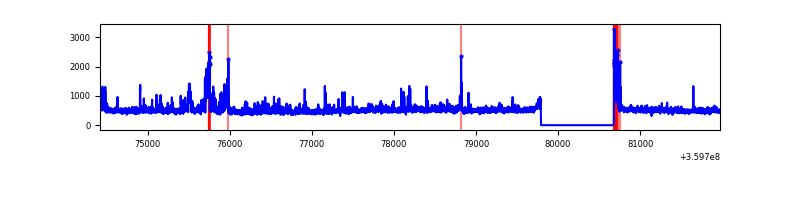 |
| D | 7555 | 6666 | 709 | 709 | 9.38% | 10.64% | 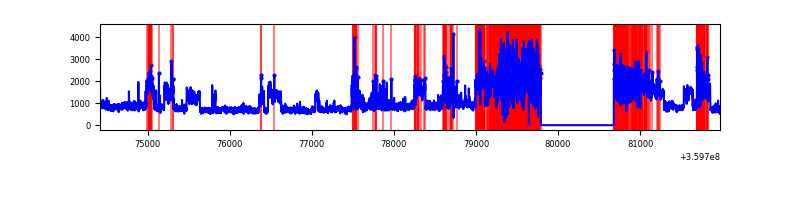 |
Top three noisy pixels from each quadrant. If the there are fewer than three noisy pixels in the level2.evt file, extra rows are filled as -1
| Pixel properties | Quadrant properties | ||||||
|---|---|---|---|---|---|---|---|
| Quadrant | DetID | PixID | Counts | Sigma | Mean | Median | Sigma |
| A | 0 | 13 | 542376 | 3286.13 | 814 | 798 | 164.8 |
| A | 8 | 192 | 14028 | 80.28 | 814 | 798 | 164.8 |
| A | 13 | 254 | 12442 | 70.65 | 814 | 798 | 164.8 |
| B | 6 | 159 | 1925527 | 12412.29 | 810 | 791 | 155.1 |
| B | 0 | 229 | 74886 | 477.82 | 810 | 791 | 155.1 |
| B | 0 | 190 | 27629 | 173.07 | 810 | 791 | 155.1 |
| C | 15 | 208 | 375582 | 2056.76 | 774 | 778 | 182.2 |
| C | 14 | 238 | 124108 | 676.78 | 774 | 778 | 182.2 |
| C | 0 | 10 | 91129 | 495.81 | 774 | 778 | 182.2 |
| D | 8 | 195 | 3073998 | 17738.7 | 728 | 708 | 173.3 |
| D | 12 | 218 | 1376006 | 7938.07 | 728 | 708 | 173.3 |
| D | 13 | 249 | 190853 | 1097.5 | 728 | 708 | 173.3 |
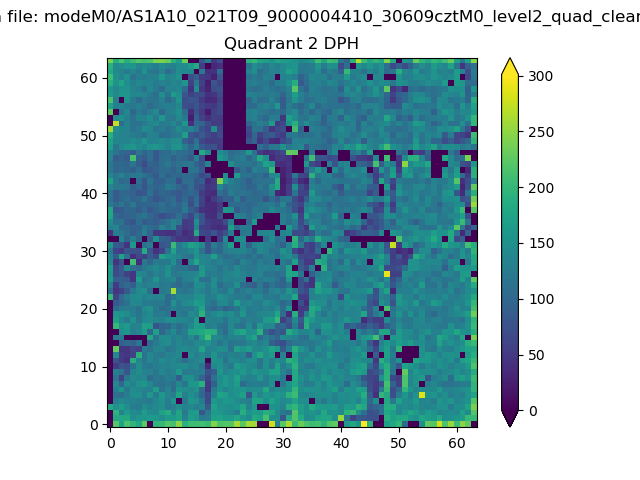
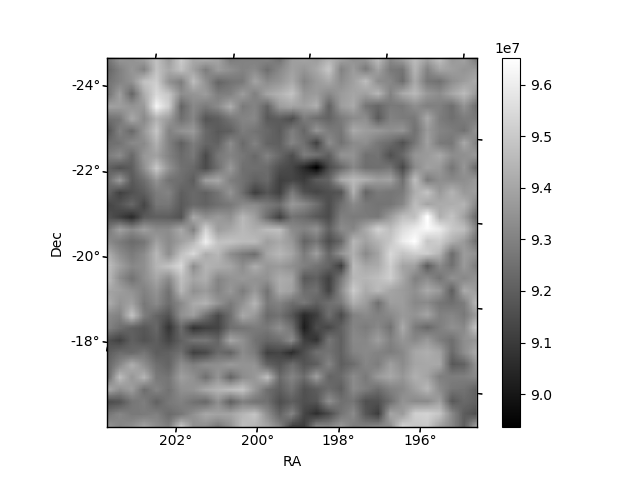
Histogram calculated using DETX and DETY for each event in the final _common_clean file
| Quadrant A | 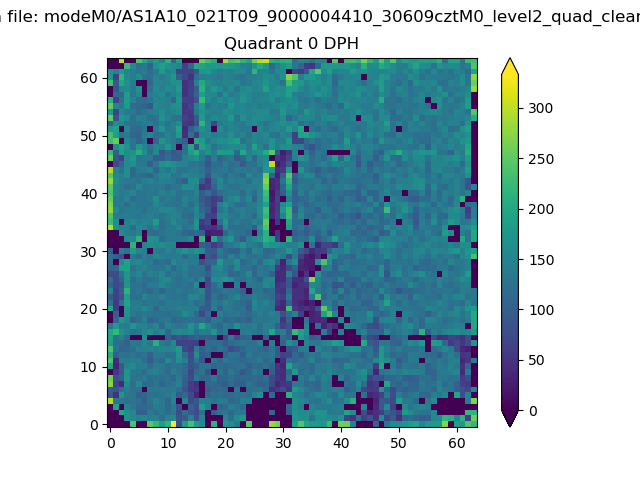 |
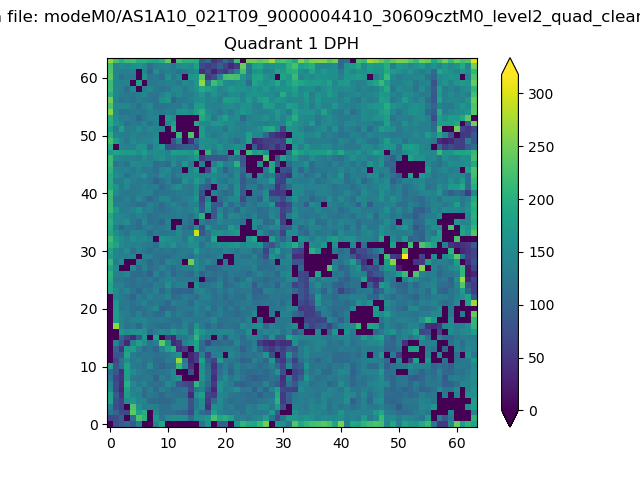 |
Quadrant B |
|---|---|---|---|
| Quadrant D | 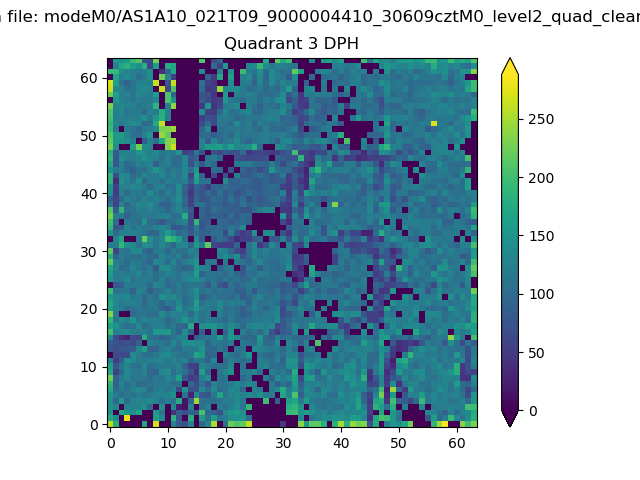 |
 |
Quadrant C |
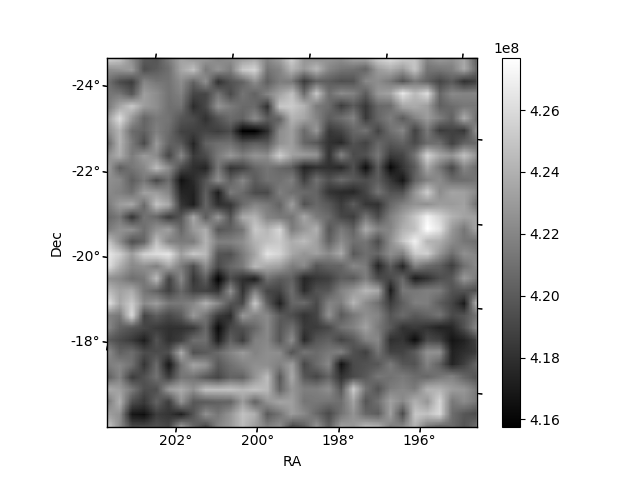
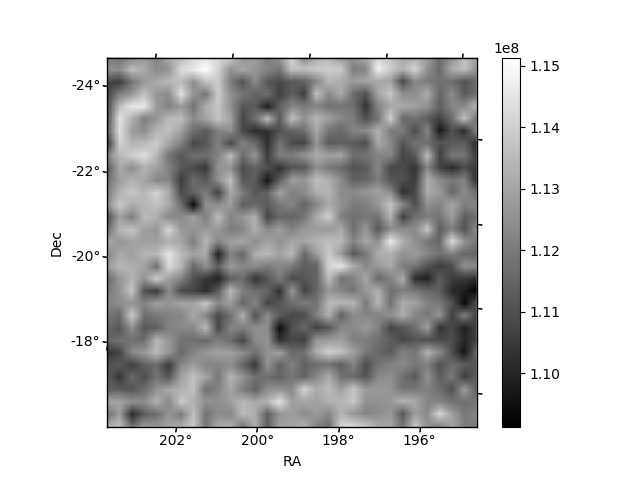
| Plot type | Count rate plots | Images |
|---|---|---|
| Comparison with Poisson distribution Blue bars denote a histogram of data divided into 1 sec bins. Red curve is a Poisson curve with rate = median count rate of data. |
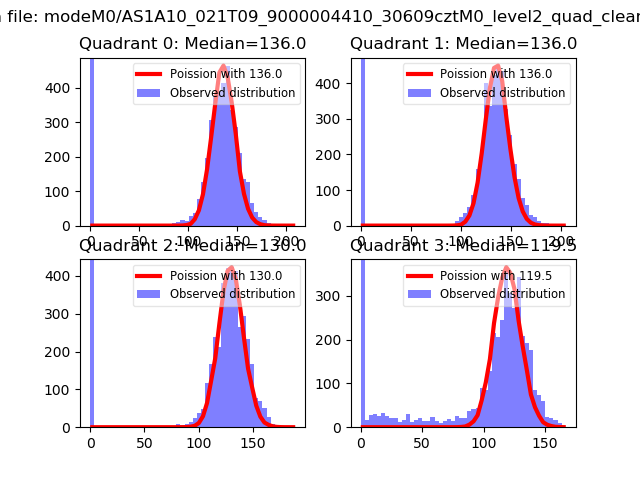 |
 |
| Quadrant-wise count rates Data is divided into 100 sec bins |
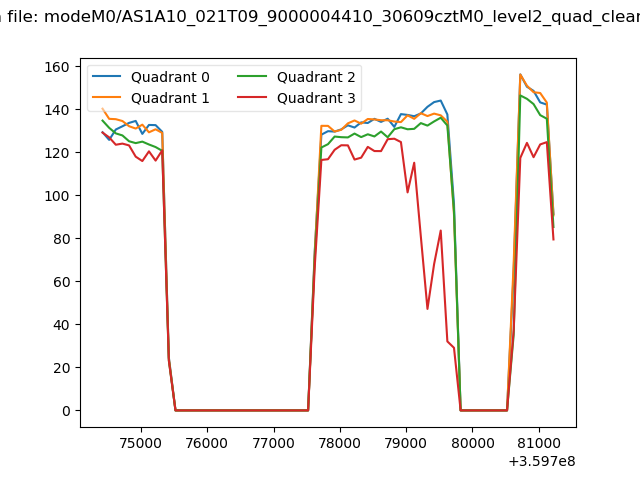 |
|
| Module-wise count rates for Quadrant A Data is divided into 100 sec bins |
 |
 |
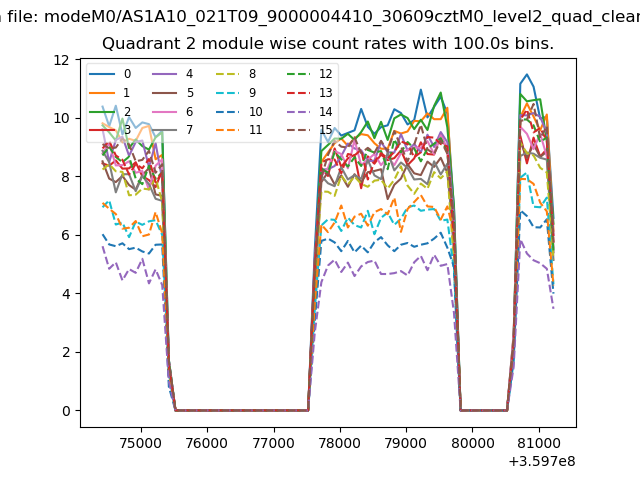
| Module-wise count rates for Quadrant B Data is divided into 100 sec bins |
 |
 |
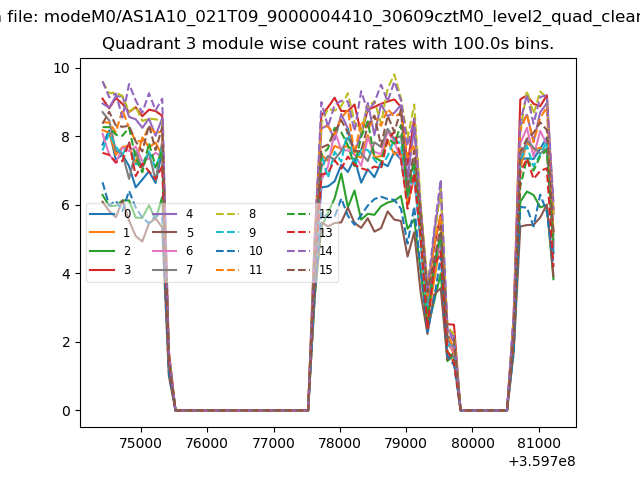
| Module-wise count rates for Quadrant C Data is divided into 100 sec bins |
 |
 |
| Module-wise count rates for Quadrant D Data is divided into 100 sec bins |
 |
 |
| Parameter | Plot |
|---|---|
| CZT HV Monitor | 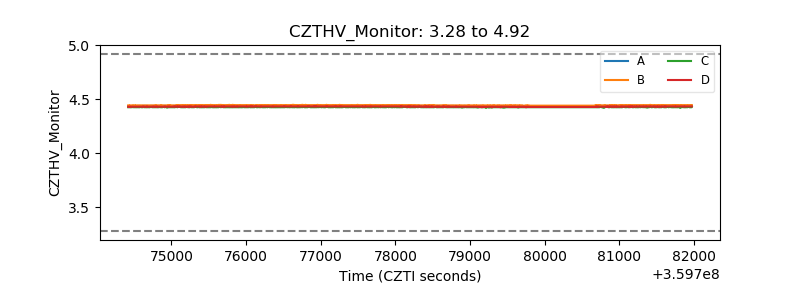 |
| D_VDD | 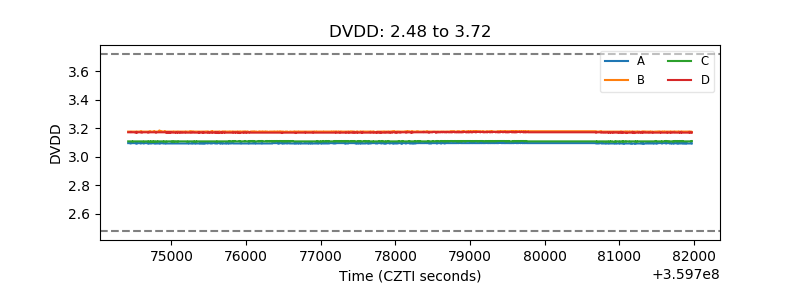 |
| Temperature 1 | 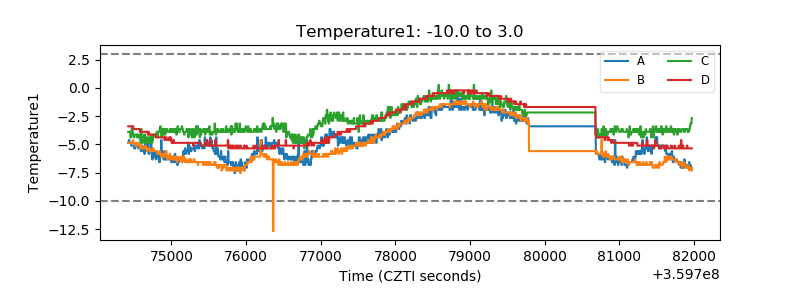 |
| Veto HV Monitor |  |
| Veto LLD | 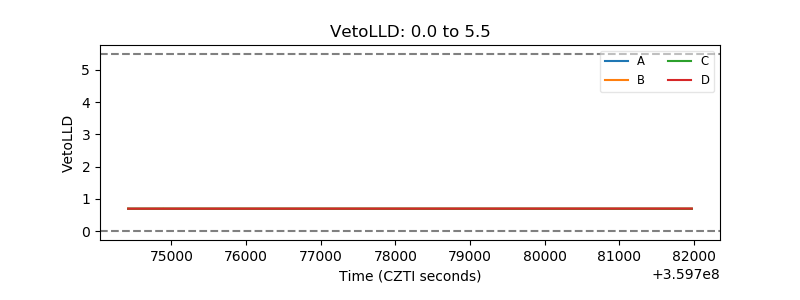 |
| Alpha Counter | 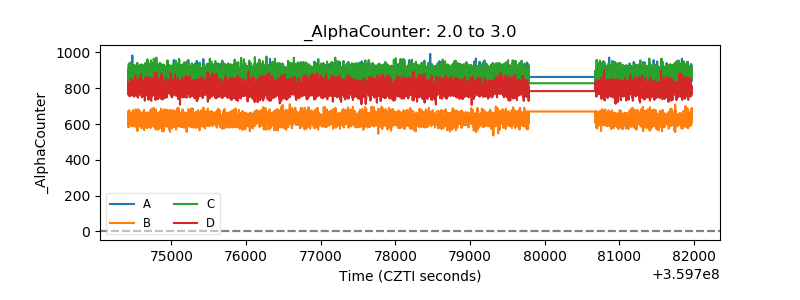 |
| _CPM_Rate | 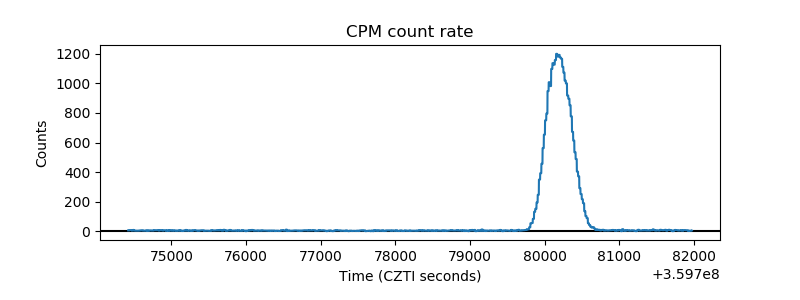 |
| CZT Counter | 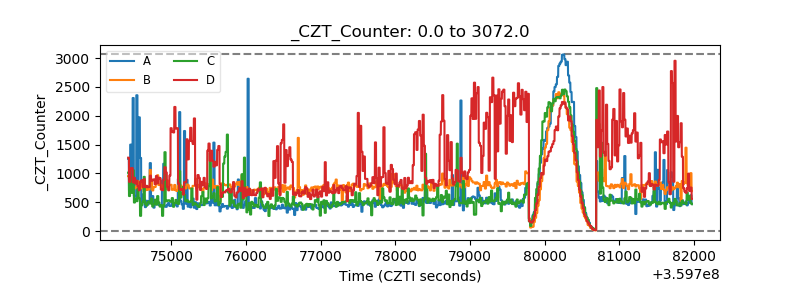 |
| +2.5 Volts monitor | 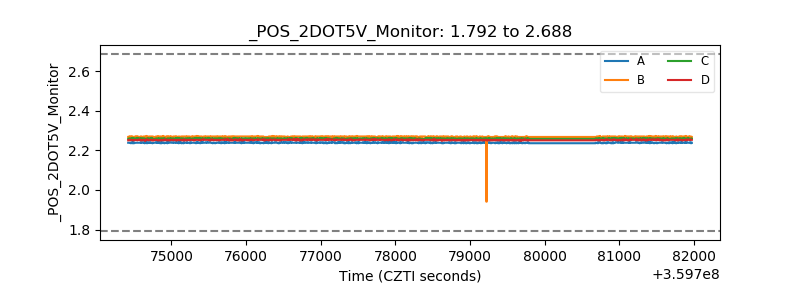 |
| +5 Volts monitor |  |
| _ROLL_ROT | 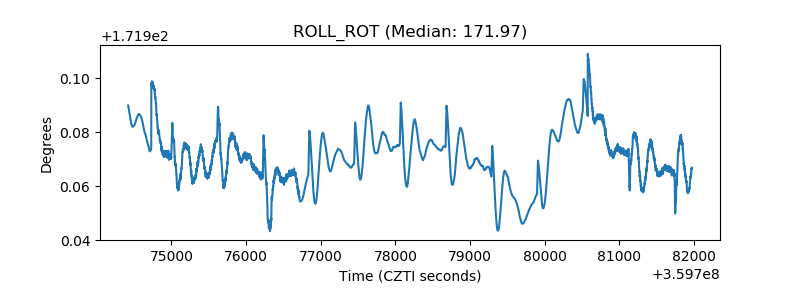 |
| _Roll_DEC |  |
| _Roll_RA | 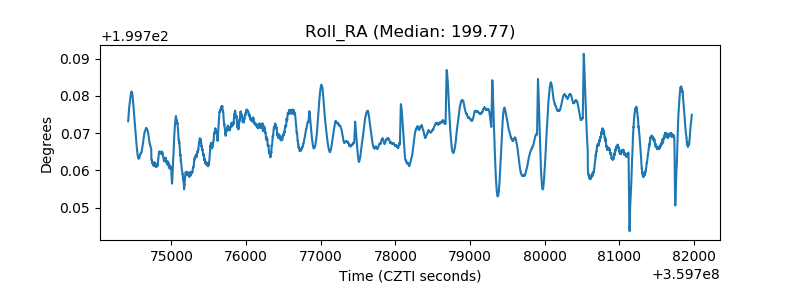 |
| Veto Counter | 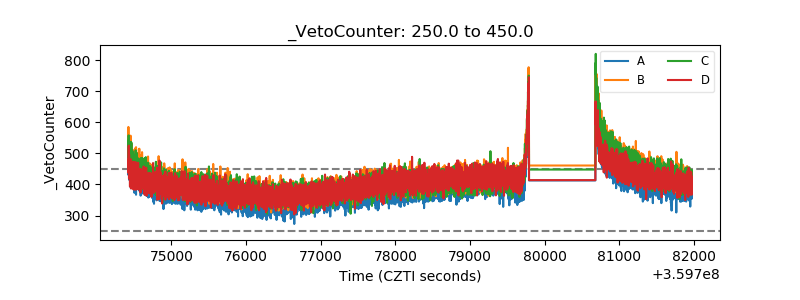 |