| Param | Original file | Final file |
|---|---|---|
| Filename | modeM0/AS1A10_021T09_9000004410_30610cztM0_level2.evt | modeM0/AS1A10_021T09_9000004410_30610cztM0_level2_quad_clean.evt |
| Size (bytes) | 716,639,040 | 76,152,960 |
| Size | 683.4 MB | 72.6 MB |
| Events in quadrant A | 3,705,970 | 502,180 |
| Events in quadrant B | 5,368,286 | 475,756 |
| Events in quadrant C | 3,814,617 | 462,919 |
| Events in quadrant D | 8,361,652 | 396,308 |
| Mode M0 | |||
|---|---|---|---|
| Quadrant | BADHDUFLAG | Total packets | Discarded packets |
| A | 0 | 15223 | 2 |
| B | 0 | 20554 | 2 |
| C | 0 | 15406 | 2 |
| D | 0 | 29752 | 2 |
| Mode M9 | |||
|---|---|---|---|
| Quadrant | BADHDUFLAG | Total packets | Discarded packets |
| A | 0 | 17 | 0 |
| B | 0 | 18 | 0 |
| C | 0 | 18 | 0 |
| D | 0 | 18 | 0 |
| Mode SS | |||
|---|---|---|---|
| Quadrant | BADHDUFLAG | Total packets | Discarded packets |
| A | 0 | 136 | 0 |
| B | 0 | 136 | 0 |
| C | 0 | 136 | 0 |
| D | 0 | 136 | 0 |
| Quadrant | Total seconds | Saturated seconds | Saturation percentage |
|---|---|---|---|
| A | 6717 | 78 | 1.161233% |
| B | 6717 | 74 | 1.101682% |
| C | 6717 | 168 | 2.501117% |
| D | 6717 | 1174 | 17.478041% |
Noise dominated data is calculated using 1-second bins in cleaned event files. If a bin has >2000 counts, and if more than 50% of those come from <1% of pixels, then it is considered to be noise-dominated and hence unusable.
| Quadrant | # 1 sec bins | Bins with >0 counts | Bins with >2000 counts | High rate bins dominated by noise | Noise dominated (total time) | Noise dominated (detector-on time) | Marked lightcurve |
|---|---|---|---|---|---|---|---|
| A | 7782 | 6718 | 31 | 31 | 0.40% | 0.46% | 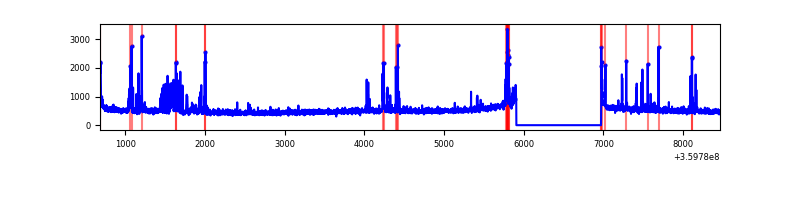 |
| B | 7782 | 6718 | 9 | 9 | 0.12% | 0.13% | 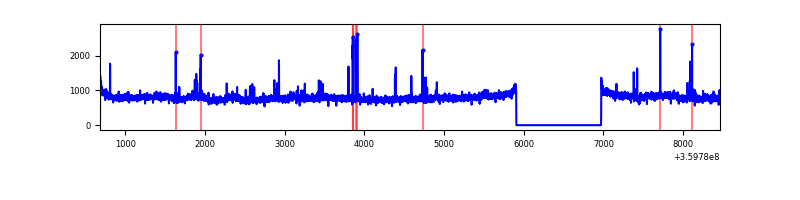 |
| C | 7782 | 6718 | 38 | 38 | 0.49% | 0.57% | 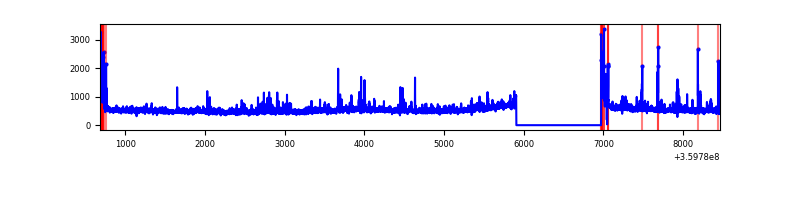 |
| D | 7782 | 6718 | 1047 | 1047 | 13.45% | 15.58% | 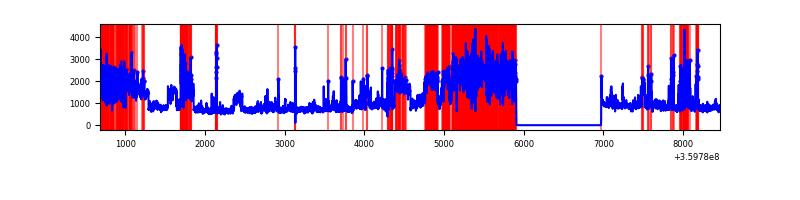 |
Top three noisy pixels from each quadrant. If the there are fewer than three noisy pixels in the level2.evt file, extra rows are filled as -1
| Pixel properties | Quadrant properties | ||||||
|---|---|---|---|---|---|---|---|
| Quadrant | DetID | PixID | Counts | Sigma | Mean | Median | Sigma |
| A | 0 | 13 | 335874 | 1934.57 | 868 | 855 | 173.2 |
| A | 8 | 192 | 24935 | 139.05 | 868 | 855 | 173.2 |
| A | 13 | 254 | 12383 | 66.57 | 868 | 855 | 173.2 |
| B | 6 | 159 | 1902188 | 11748.85 | 852 | 832 | 161.8 |
| B | 0 | 229 | 84770 | 518.67 | 852 | 832 | 161.8 |
| B | 12 | 111 | 19797 | 117.19 | 852 | 832 | 161.8 |
| C | 15 | 208 | 286466 | 1476.41 | 817 | 824 | 193.5 |
| C | 14 | 238 | 143594 | 737.94 | 817 | 824 | 193.5 |
| C | 0 | 10 | 135200 | 694.56 | 817 | 824 | 193.5 |
| D | 8 | 195 | 3264185 | 17725.24 | 774 | 756 | 184.1 |
| D | 12 | 218 | 1425580 | 7738.9 | 774 | 756 | 184.1 |
| D | 1 | 52 | 374014 | 2027.34 | 774 | 756 | 184.1 |
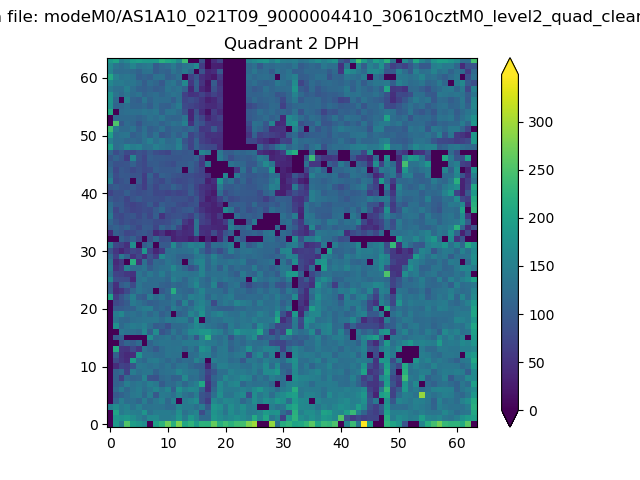
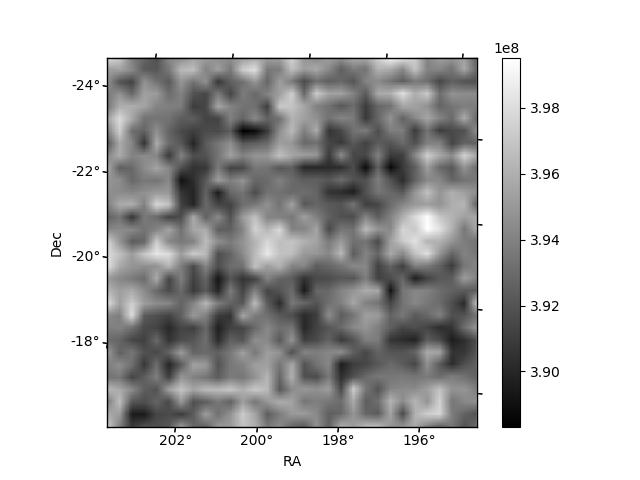
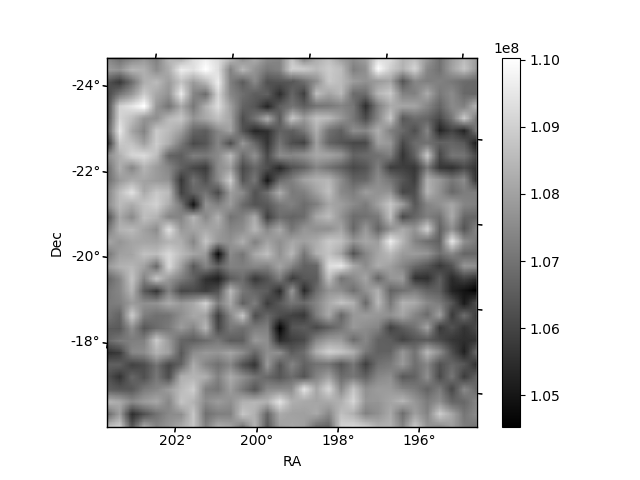
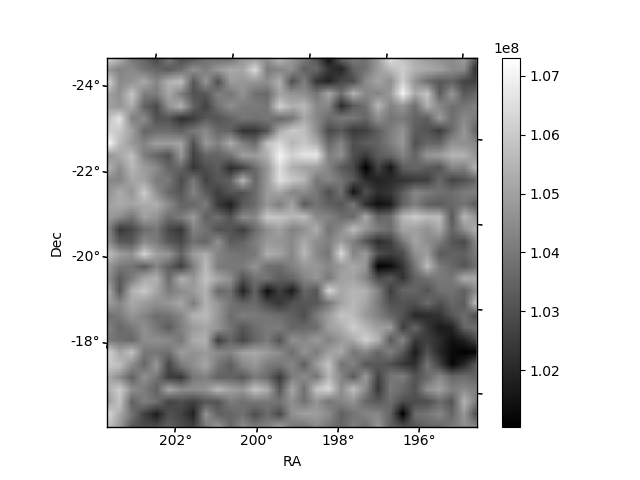
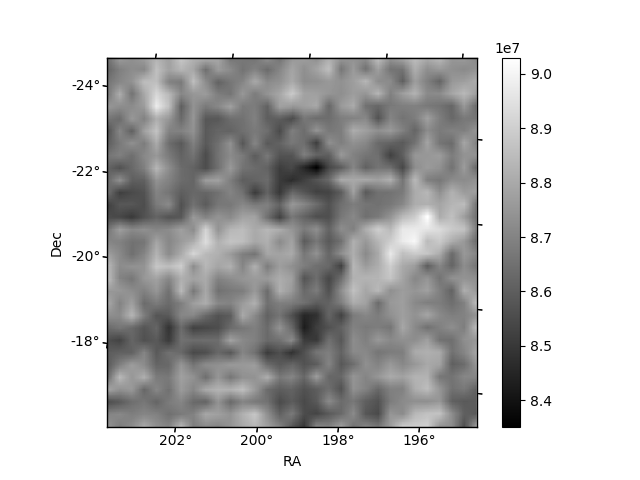
Histogram calculated using DETX and DETY for each event in the final _common_clean file
| Quadrant A | 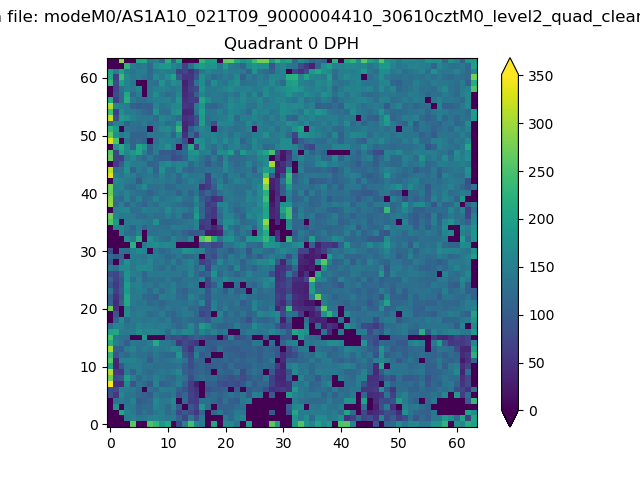 |
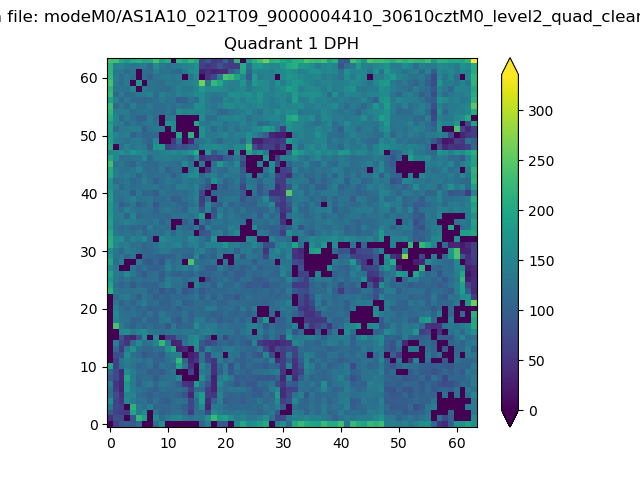 |
Quadrant B |
|---|---|---|---|
| Quadrant D | 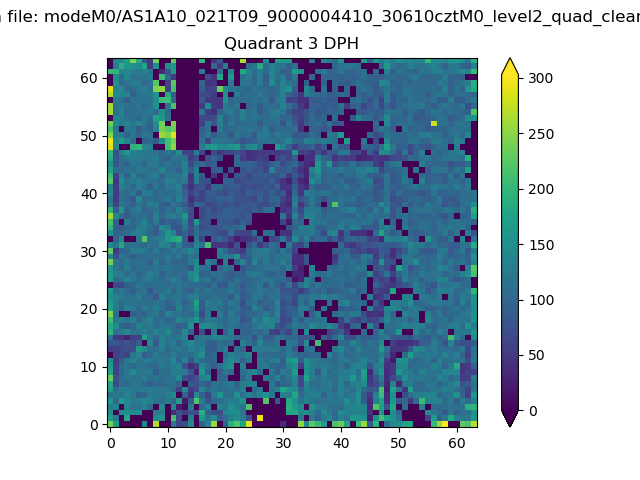 |
 |
Quadrant C |
| Plot type | Count rate plots | Images |
|---|---|---|
| Comparison with Poisson distribution Blue bars denote a histogram of data divided into 1 sec bins. Red curve is a Poisson curve with rate = median count rate of data. |
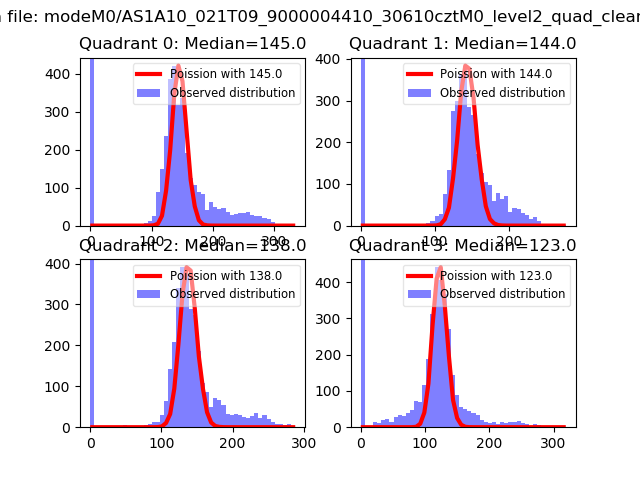 |
 |
| Quadrant-wise count rates Data is divided into 100 sec bins |
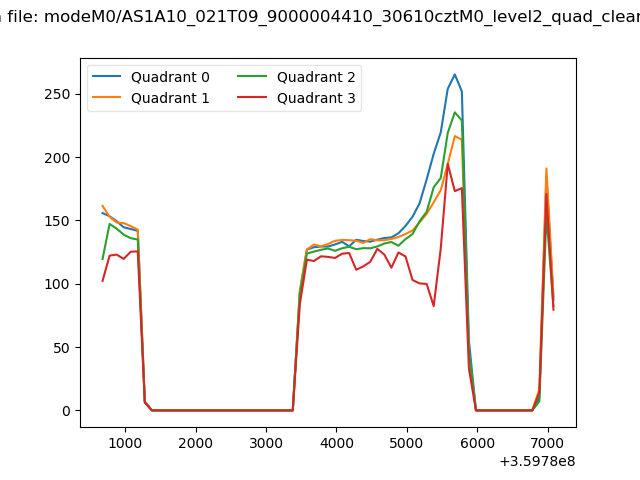 |
|
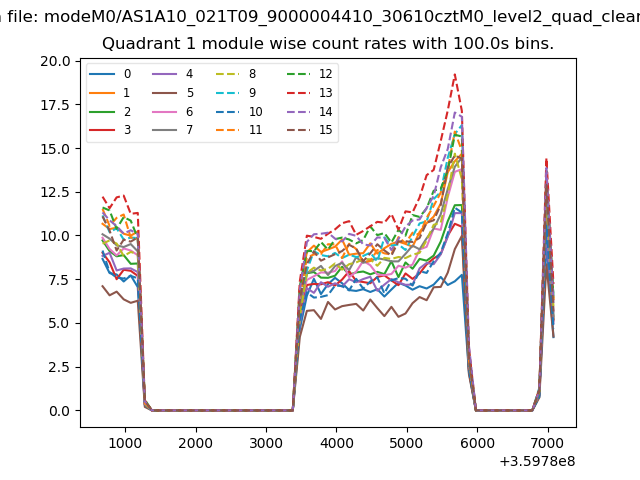
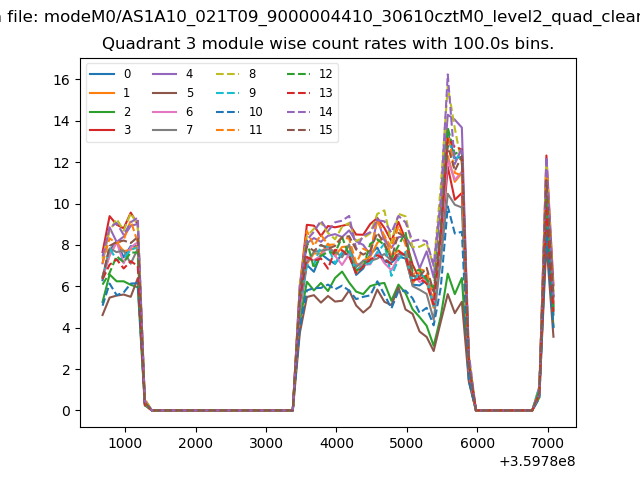
| Module-wise count rates for Quadrant A Data is divided into 100 sec bins |
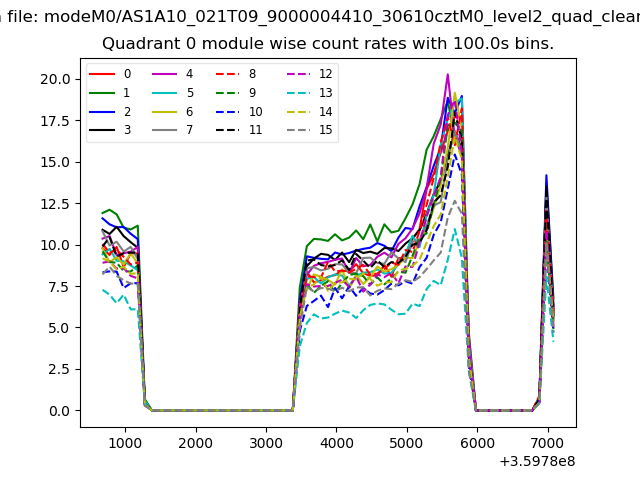 |
 |
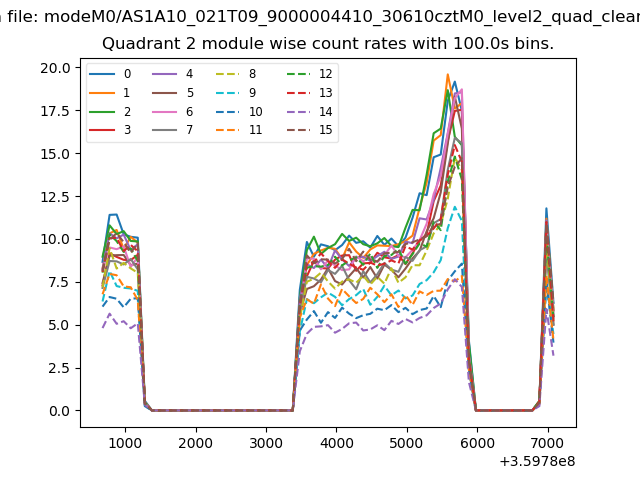
| Module-wise count rates for Quadrant B Data is divided into 100 sec bins |
 |
 |
| Module-wise count rates for Quadrant C Data is divided into 100 sec bins |
 |
 |
| Module-wise count rates for Quadrant D Data is divided into 100 sec bins |
 |
 |
| Parameter | Plot |
|---|---|
| CZT HV Monitor | 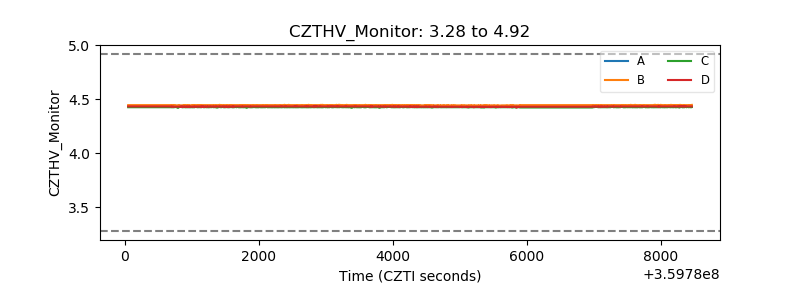 |
| D_VDD | 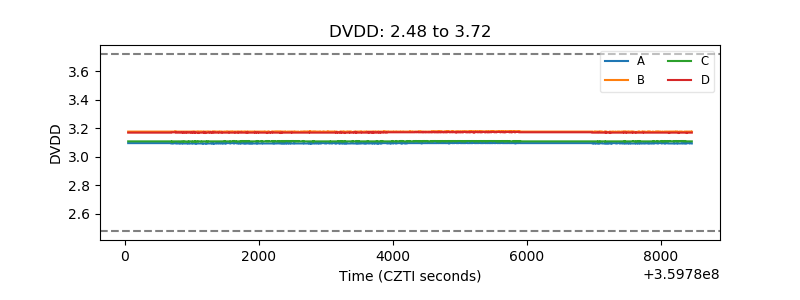 |
| Temperature 1 | 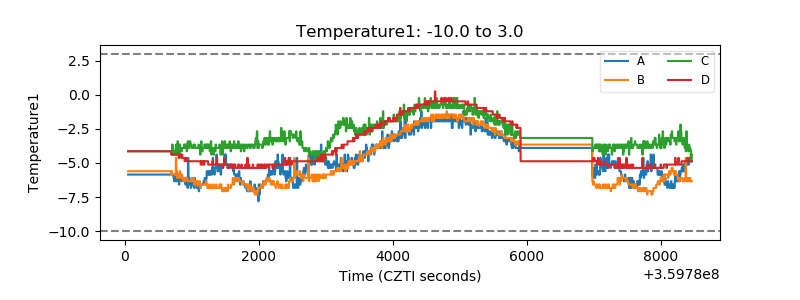 |
| Veto HV Monitor | 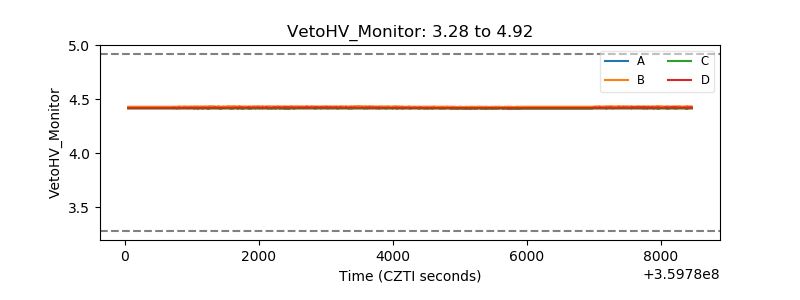 |
| Veto LLD | 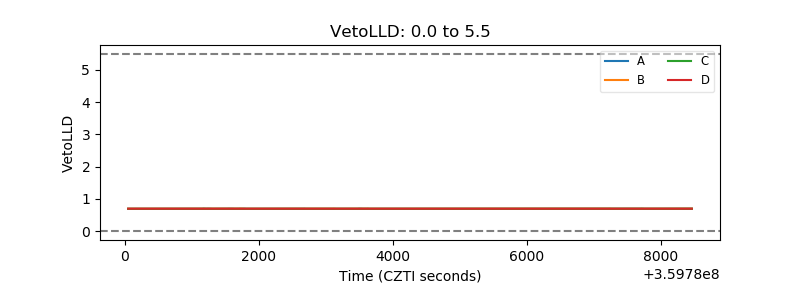 |
| Alpha Counter | 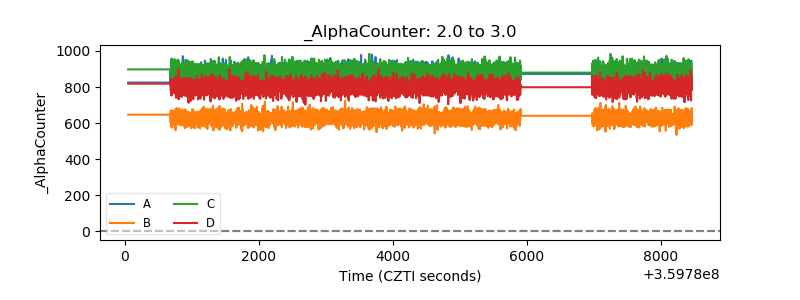 |
| _CPM_Rate | 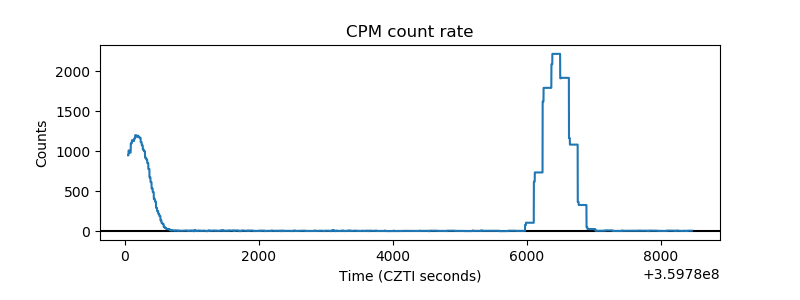 |
| CZT Counter |  |
| +2.5 Volts monitor |  |
| +5 Volts monitor |  |
| _ROLL_ROT | 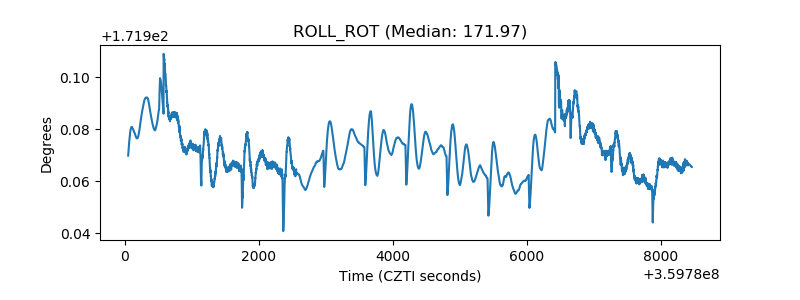 |
| _Roll_DEC | 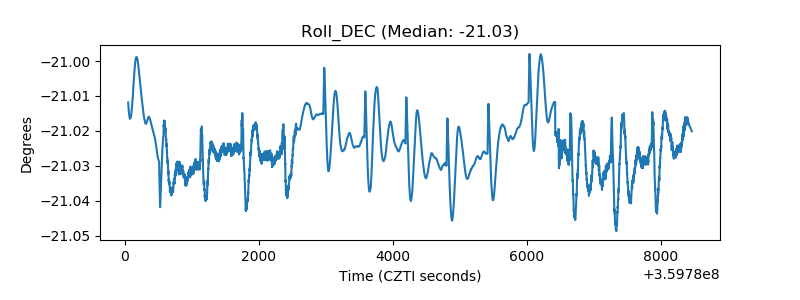 |
| _Roll_RA | 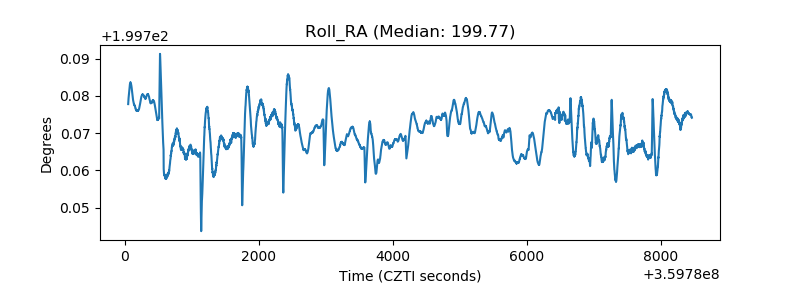 |
| Veto Counter | 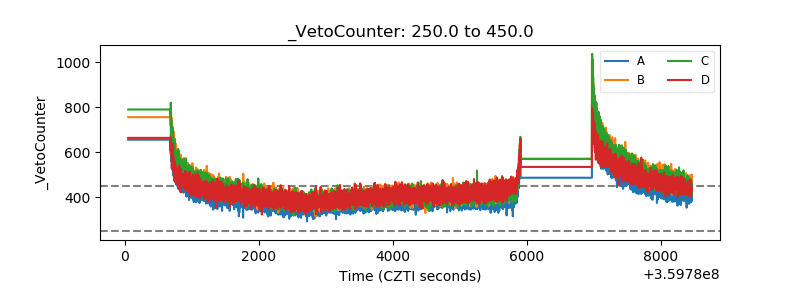 |