| Param | Original file | Final file |
|---|---|---|
| Filename | modeM0/AS1A10_021T09_9000004410_30612cztM0_level2.evt | modeM0/AS1A10_021T09_9000004410_30612cztM0_level2_quad_clean.evt |
| Size (bytes) | 681,932,160 | 68,644,800 |
| Size | 650.3 MB | 65.5 MB |
| Events in quadrant A | 4,023,606 | 426,981 |
| Events in quadrant B | 5,391,164 | 420,852 |
| Events in quadrant C | 3,968,047 | 400,569 |
| Events in quadrant D | 6,824,782 | 370,014 |
| Mode M0 | |||
|---|---|---|---|
| Quadrant | BADHDUFLAG | Total packets | Discarded packets |
| A | 0 | 16048 | 2 |
| B | 0 | 20338 | 4 |
| C | 0 | 15854 | 2 |
| D | 0 | 25002 | 2 |
| Mode M9 | |||
|---|---|---|---|
| Quadrant | BADHDUFLAG | Total packets | Discarded packets |
| A | 0 | 14 | 0 |
| B | 0 | 15 | 0 |
| C | 0 | 15 | 0 |
| D | 0 | 15 | 0 |
| Mode SS | |||
|---|---|---|---|
| Quadrant | BADHDUFLAG | Total packets | Discarded packets |
| A | 0 | 136 | 0 |
| B | 0 | 136 | 0 |
| C | 0 | 136 | 0 |
| D | 0 | 136 | 0 |
| Quadrant | Total seconds | Saturated seconds | Saturation percentage |
|---|---|---|---|
| A | 6588 | 149 | 2.261688% |
| B | 6587 | 106 | 1.609230% |
| C | 6587 | 250 | 3.795354% |
| D | 6587 | 546 | 8.289054% |
Noise dominated data is calculated using 1-second bins in cleaned event files. If a bin has >2000 counts, and if more than 50% of those come from <1% of pixels, then it is considered to be noise-dominated and hence unusable.
| Quadrant | # 1 sec bins | Bins with >0 counts | Bins with >2000 counts | High rate bins dominated by noise | Noise dominated (total time) | Noise dominated (detector-on time) | Marked lightcurve |
|---|---|---|---|---|---|---|---|
| A | 7778 | 6589 | 75 | 75 | 0.96% | 1.14% | 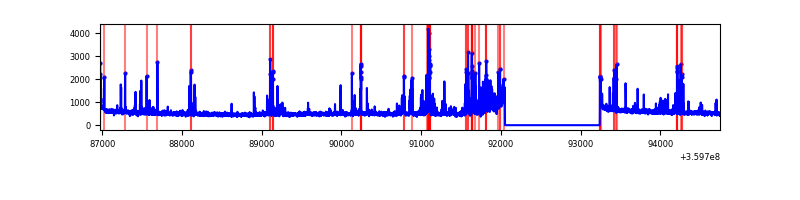 |
| B | 7777 | 6588 | 8 | 8 | 0.10% | 0.12% | 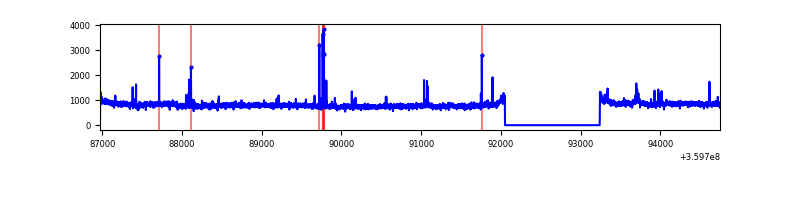 |
| C | 7777 | 6587 | 60 | 60 | 0.77% | 0.91% | 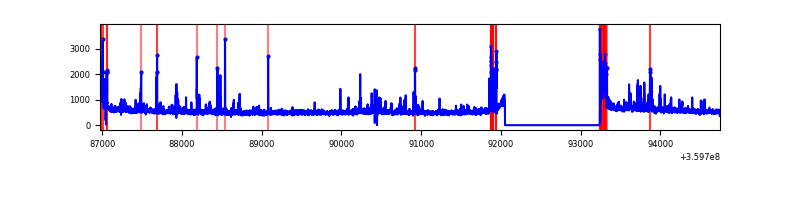 |
| D | 7777 | 6588 | 489 | 489 | 6.29% | 7.42% | 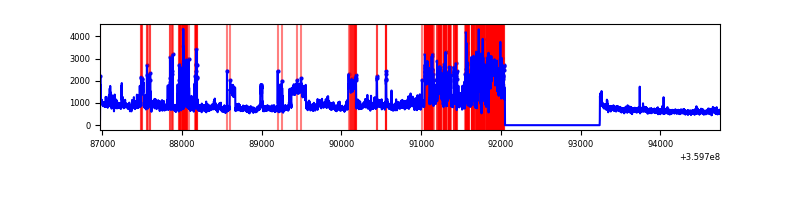 |
Top three noisy pixels from each quadrant. If the there are fewer than three noisy pixels in the level2.evt file, extra rows are filled as -1
| Pixel properties | Quadrant properties | ||||||
|---|---|---|---|---|---|---|---|
| Quadrant | DetID | PixID | Counts | Sigma | Mean | Median | Sigma |
| A | 0 | 13 | 586579 | 3357.13 | 885 | 871 | 174.5 |
| A | 8 | 192 | 21192 | 116.47 | 885 | 871 | 174.5 |
| A | 13 | 254 | 11932 | 63.4 | 885 | 871 | 174.5 |
| B | 6 | 159 | 1823723 | 10999.68 | 878 | 860 | 165.7 |
| B | 0 | 229 | 59273 | 352.48 | 878 | 860 | 165.7 |
| B | 4 | 171 | 30750 | 180.36 | 878 | 860 | 165.7 |
| C | 15 | 208 | 324440 | 1661.43 | 834 | 841 | 194.8 |
| C | 0 | 10 | 172115 | 879.36 | 834 | 841 | 194.8 |
| C | 14 | 238 | 147208 | 751.48 | 834 | 841 | 194.8 |
| D | 8 | 195 | 2581446 | 13121.98 | 828 | 810 | 196.7 |
| D | 12 | 218 | 562494 | 2856.04 | 828 | 810 | 196.7 |
| D | 1 | 52 | 326099 | 1654.02 | 828 | 810 | 196.7 |
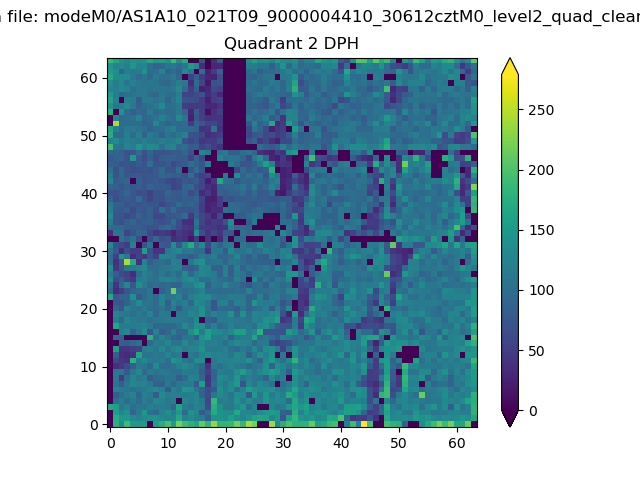
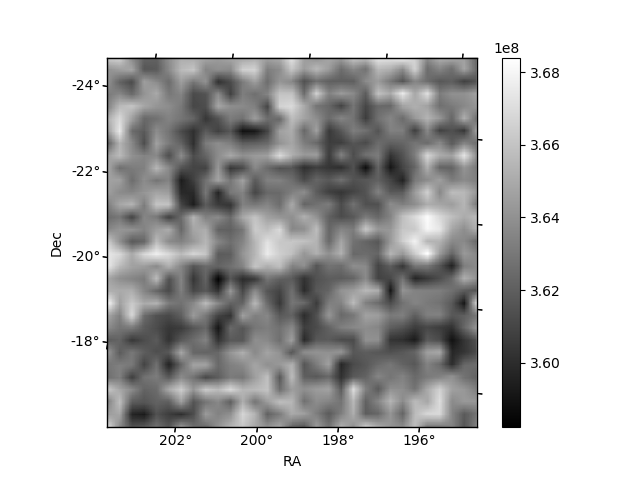
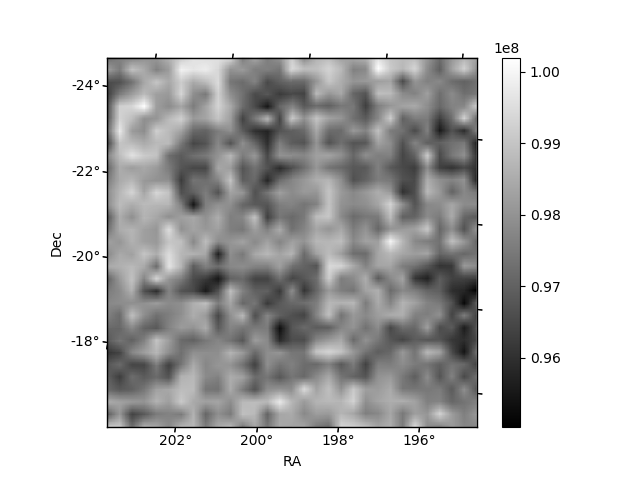
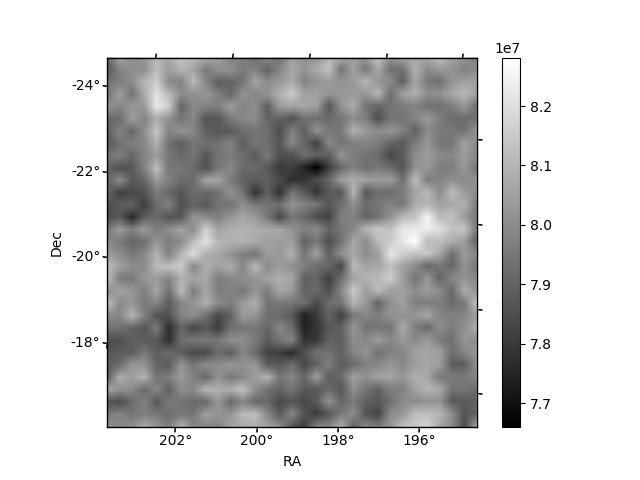
Histogram calculated using DETX and DETY for each event in the final _common_clean file
| Quadrant A | 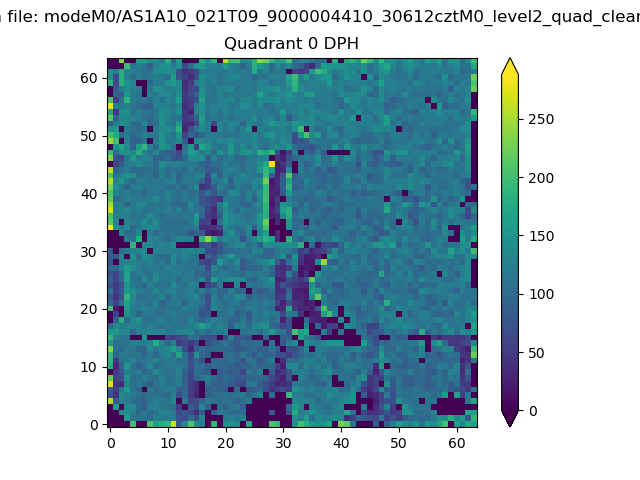 |
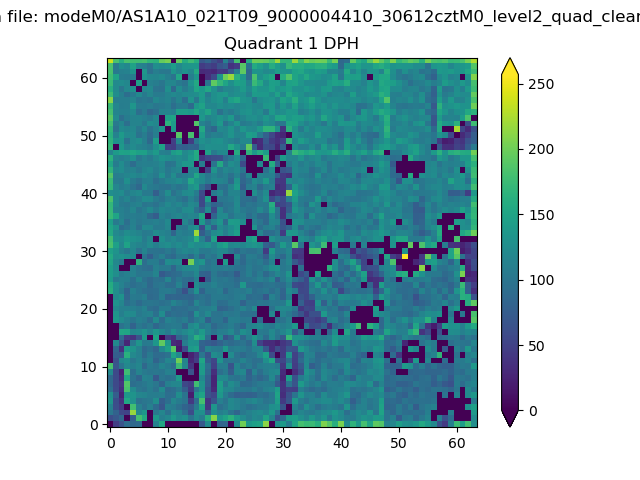 |
Quadrant B |
|---|---|---|---|
| Quadrant D | 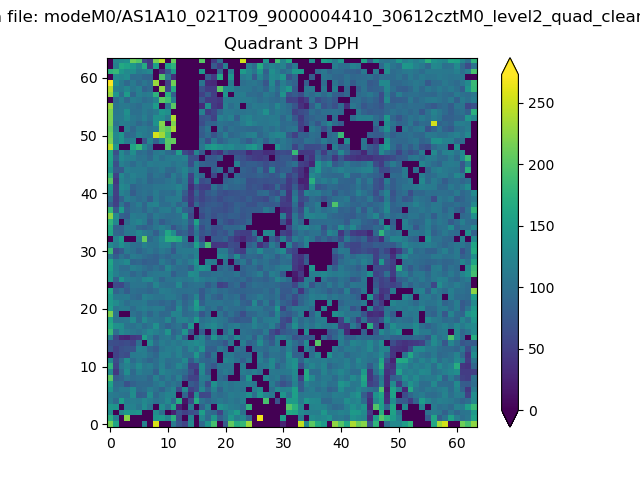 |
 |
Quadrant C |
| Plot type | Count rate plots | Images |
|---|---|---|
| Comparison with Poisson distribution Blue bars denote a histogram of data divided into 1 sec bins. Red curve is a Poisson curve with rate = median count rate of data. |
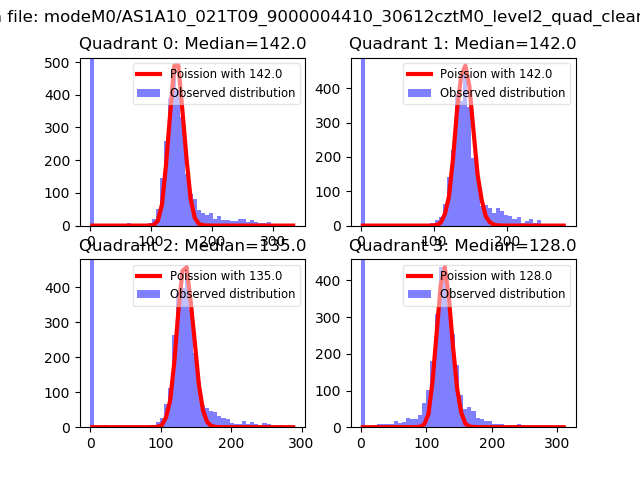 |
 |
| Quadrant-wise count rates Data is divided into 100 sec bins |
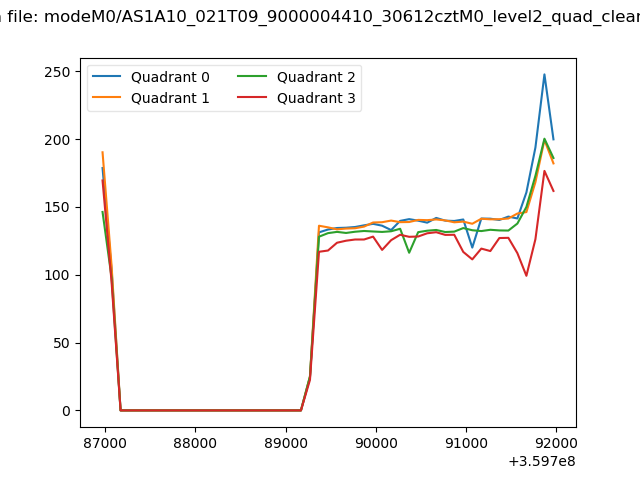 |
|
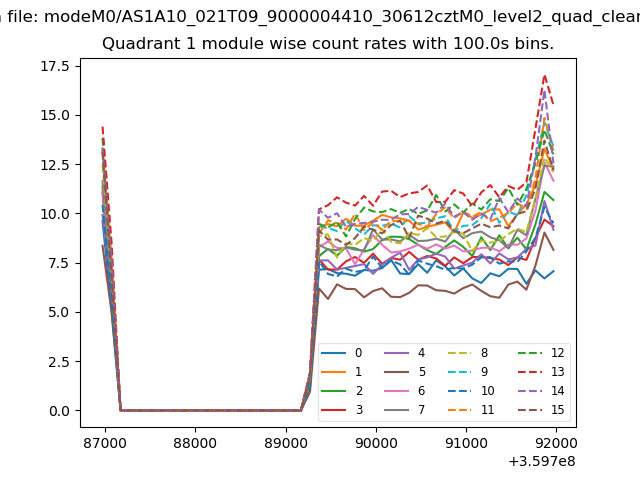
| Module-wise count rates for Quadrant A Data is divided into 100 sec bins |
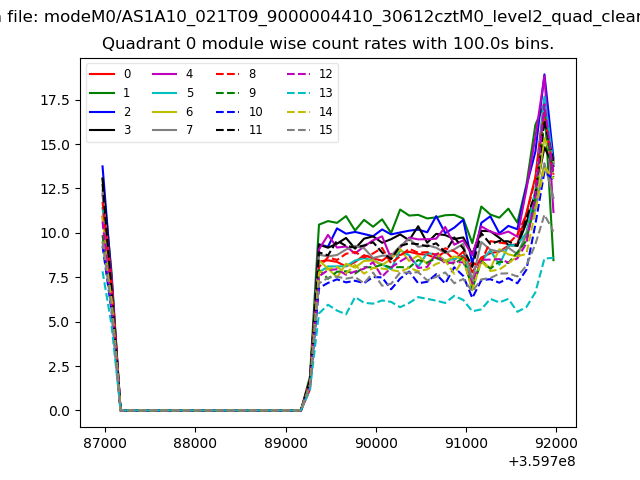 |
 |
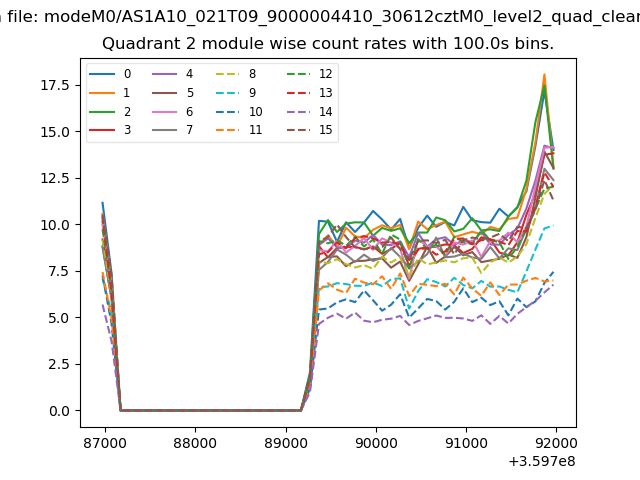
| Module-wise count rates for Quadrant B Data is divided into 100 sec bins |
 |
 |
| Module-wise count rates for Quadrant C Data is divided into 100 sec bins |
 |
 |
| Module-wise count rates for Quadrant D Data is divided into 100 sec bins |
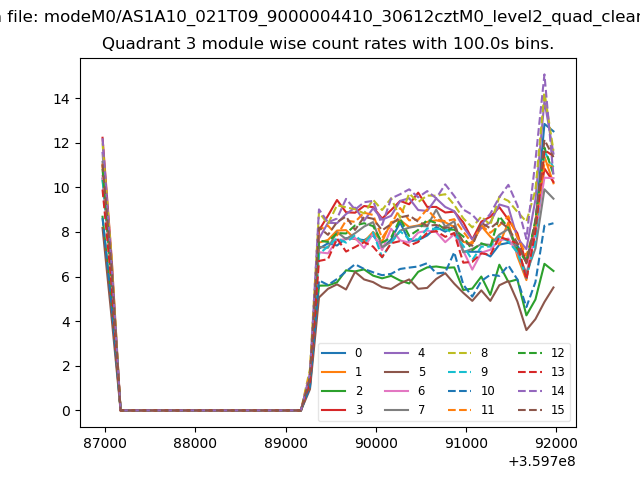 |
 |
| Parameter | Plot |
|---|---|
| CZT HV Monitor | 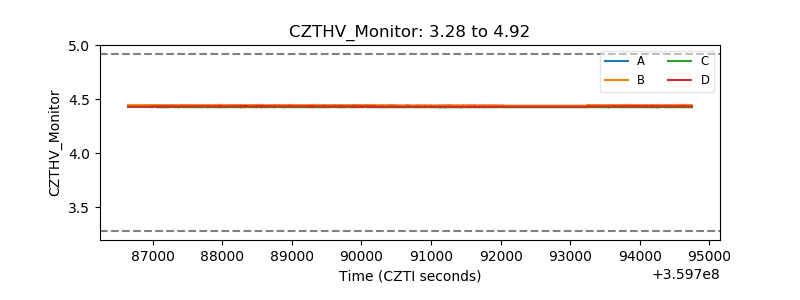 |
| D_VDD | 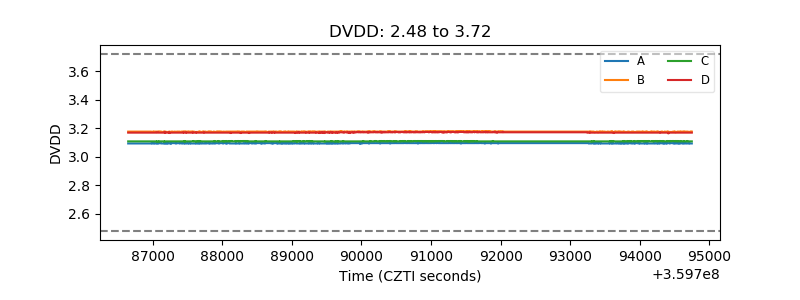 |
| Temperature 1 | 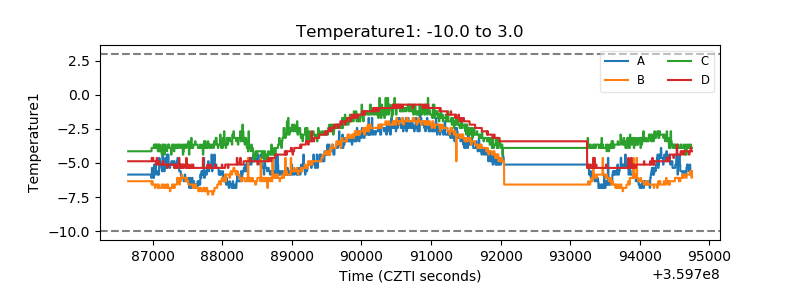 |
| Veto HV Monitor | 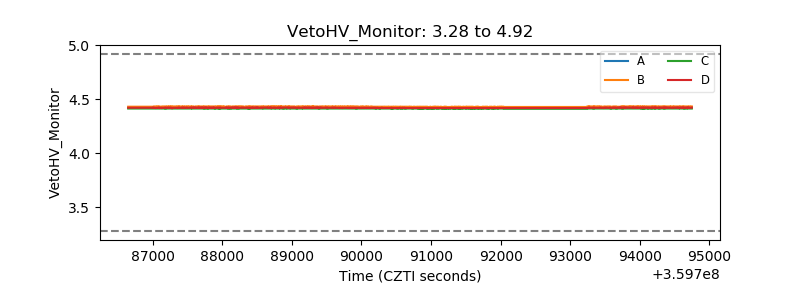 |
| Veto LLD | 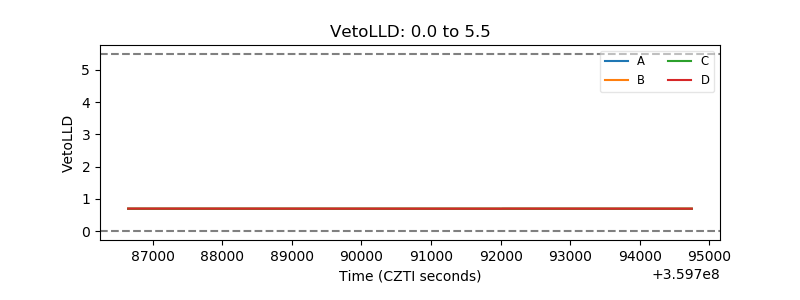 |
| Alpha Counter | 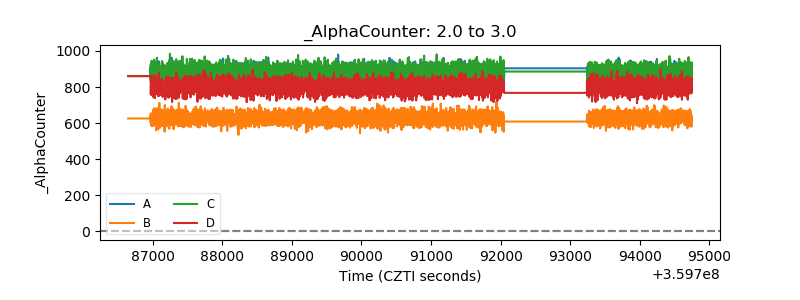 |
| _CPM_Rate | 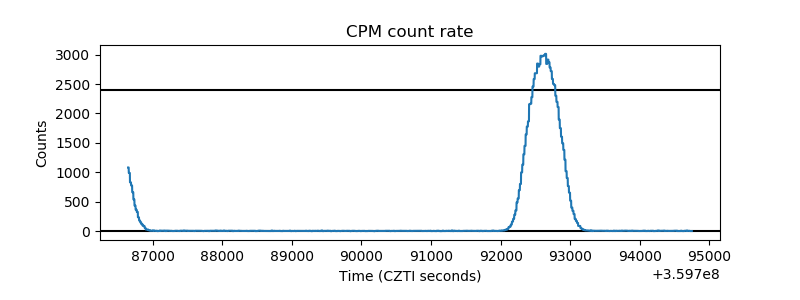 |
| CZT Counter | 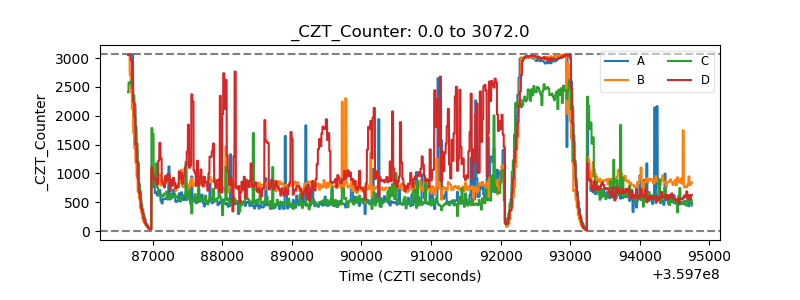 |
| +2.5 Volts monitor |  |
| +5 Volts monitor |  |
| _ROLL_ROT | 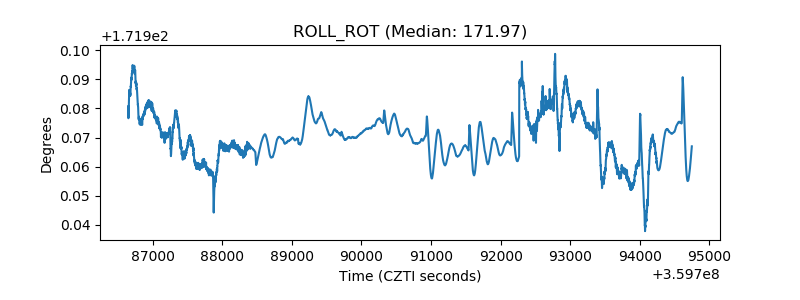 |
| _Roll_DEC | 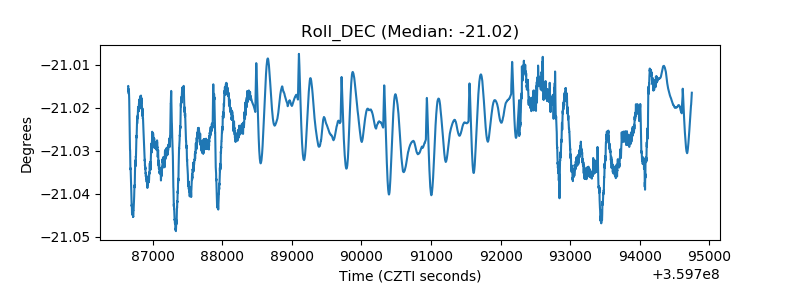 |
| _Roll_RA | 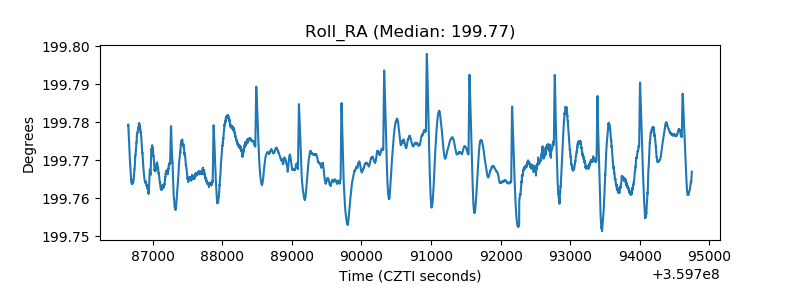 |
| Veto Counter | 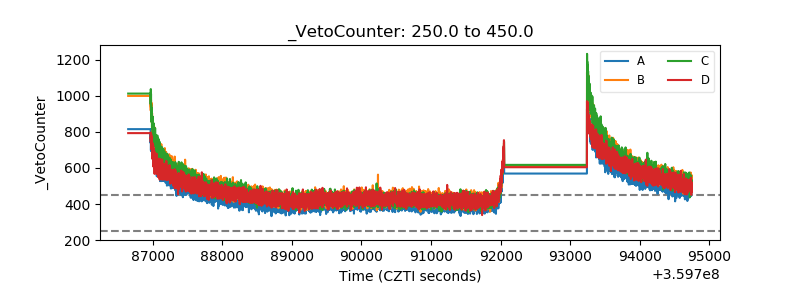 |