| Param | Original file | Final file |
|---|---|---|
| Filename | modeM0/AS1A10_021T09_9000004410_30613cztM0_level2.evt | modeM0/AS1A10_021T09_9000004410_30613cztM0_level2_quad_clean.evt |
| Size (bytes) | 587,646,720 | 72,224,640 |
| Size | 560.4 MB | 68.9 MB |
| Events in quadrant A | 3,720,079 | 455,841 |
| Events in quadrant B | 5,255,674 | 448,611 |
| Events in quadrant C | 3,954,650 | 428,620 |
| Events in quadrant D | 4,444,424 | 418,014 |
| Mode M0 | |||
|---|---|---|---|
| Quadrant | BADHDUFLAG | Total packets | Discarded packets |
| A | 0 | 14910 | 2 |
| B | 0 | 19587 | 2 |
| C | 0 | 15805 | 2 |
| D | 0 | 17655 | 2 |
| Mode M9 | |||
|---|---|---|---|
| Quadrant | BADHDUFLAG | Total packets | Discarded packets |
| A | 0 | 13 | 0 |
| B | 0 | 14 | 0 |
| C | 0 | 14 | 0 |
| D | 0 | 14 | 0 |
| Mode SS | |||
|---|---|---|---|
| Quadrant | BADHDUFLAG | Total packets | Discarded packets |
| A | 0 | 128 | 0 |
| B | 0 | 128 | 0 |
| C | 0 | 128 | 0 |
| D | 0 | 128 | 0 |
| Quadrant | Total seconds | Saturated seconds | Saturation percentage |
|---|---|---|---|
| A | 6238 | 139 | 2.228278% |
| B | 6237 | 138 | 2.212602% |
| C | 6237 | 307 | 4.922238% |
| D | 6237 | 216 | 3.463203% |
Noise dominated data is calculated using 1-second bins in cleaned event files. If a bin has >2000 counts, and if more than 50% of those come from <1% of pixels, then it is considered to be noise-dominated and hence unusable.
| Quadrant | # 1 sec bins | Bins with >0 counts | Bins with >2000 counts | High rate bins dominated by noise | Noise dominated (total time) | Noise dominated (detector-on time) | Marked lightcurve |
|---|---|---|---|---|---|---|---|
| A | 7513 | 6239 | 49 | 49 | 0.65% | 0.79% | 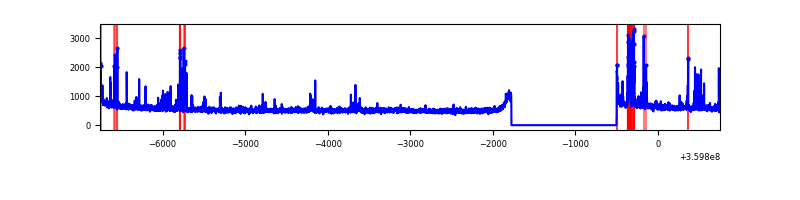 |
| B | 7512 | 6238 | 2 | 2 | 0.03% | 0.03% | 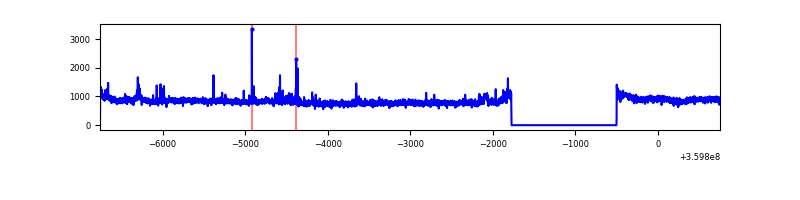 |
| C | 7512 | 6238 | 57 | 57 | 0.76% | 0.91% | 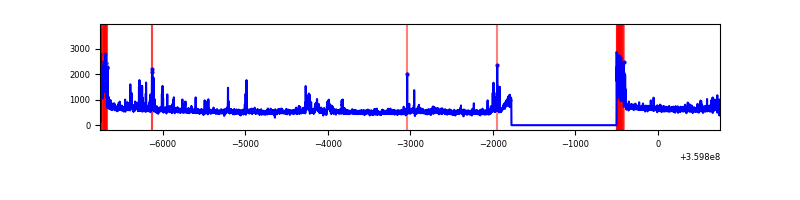 |
| D | 7512 | 6238 | 140 | 140 | 1.86% | 2.24% | 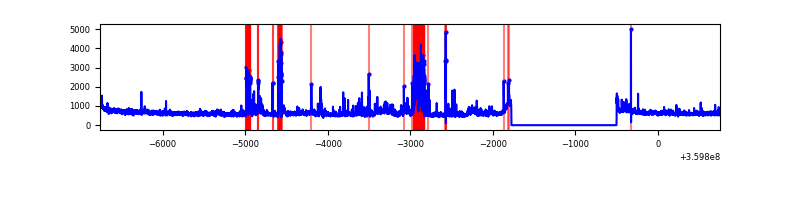 |
Top three noisy pixels from each quadrant. If the there are fewer than three noisy pixels in the level2.evt file, extra rows are filled as -1
| Pixel properties | Quadrant properties | ||||||
|---|---|---|---|---|---|---|---|
| Quadrant | DetID | PixID | Counts | Sigma | Mean | Median | Sigma |
| A | 0 | 13 | 281277 | 1614.78 | 887 | 873 | 173.6 |
| A | 8 | 192 | 21179 | 116.94 | 887 | 873 | 173.6 |
| A | 13 | 254 | 11203 | 59.49 | 887 | 873 | 173.6 |
| B | 6 | 159 | 1687114 | 10297.57 | 878 | 859 | 163.8 |
| B | 0 | 229 | 102934 | 623.35 | 878 | 859 | 163.8 |
| B | 12 | 111 | 18966 | 110.58 | 878 | 859 | 163.8 |
| C | 0 | 10 | 246888 | 1296.57 | 832 | 843 | 189.8 |
| C | 14 | 238 | 157969 | 828.0 | 832 | 843 | 189.8 |
| C | 3 | 233 | 123295 | 645.28 | 832 | 843 | 189.8 |
| D | 8 | 195 | 547572 | 2772.87 | 847 | 826 | 197.2 |
| D | 1 | 52 | 312770 | 1582.05 | 847 | 826 | 197.2 |
| D | 12 | 218 | 242396 | 1225.14 | 847 | 826 | 197.2 |
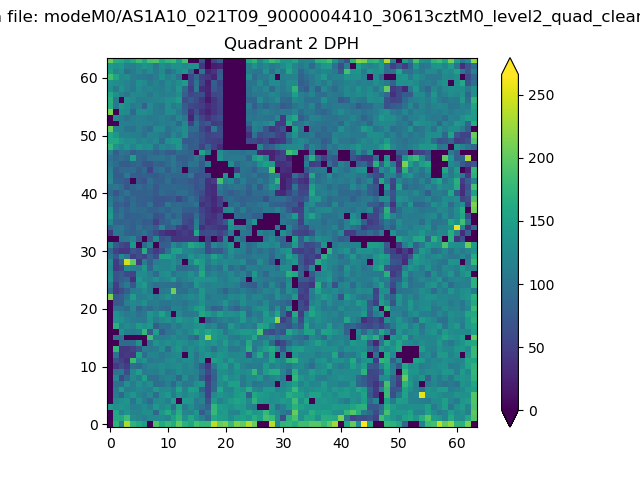
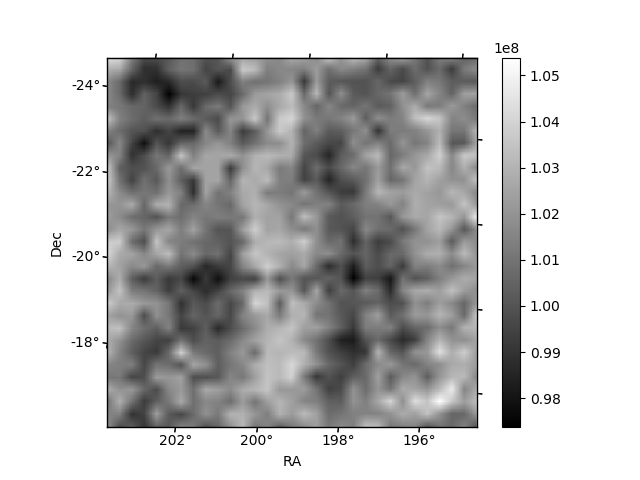
Histogram calculated using DETX and DETY for each event in the final _common_clean file
| Quadrant A | 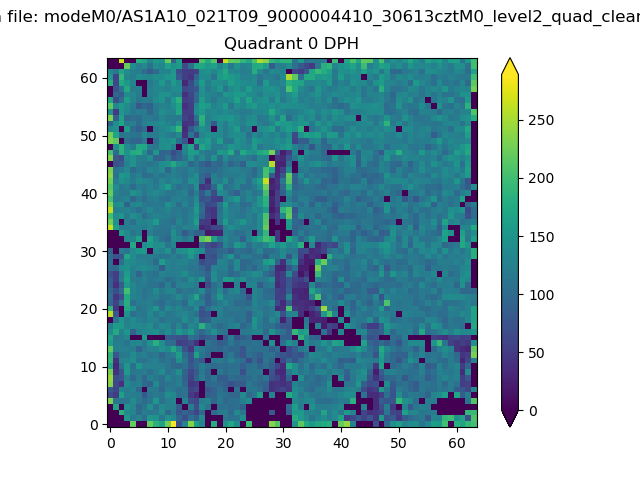 |
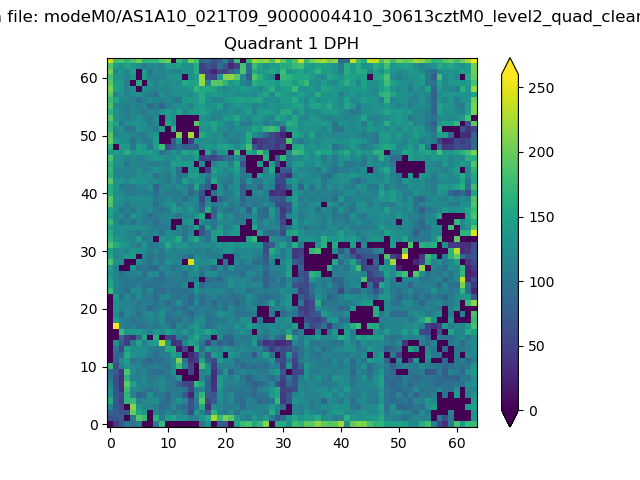 |
Quadrant B |
|---|---|---|---|
| Quadrant D | 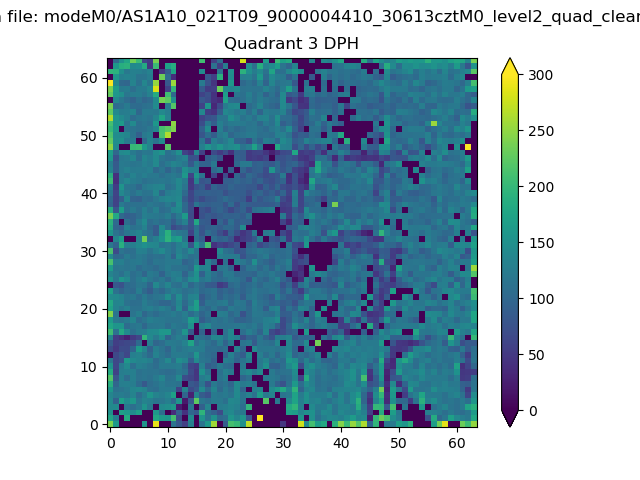 |
 |
Quadrant C |
| Plot type | Count rate plots | Images |
|---|---|---|
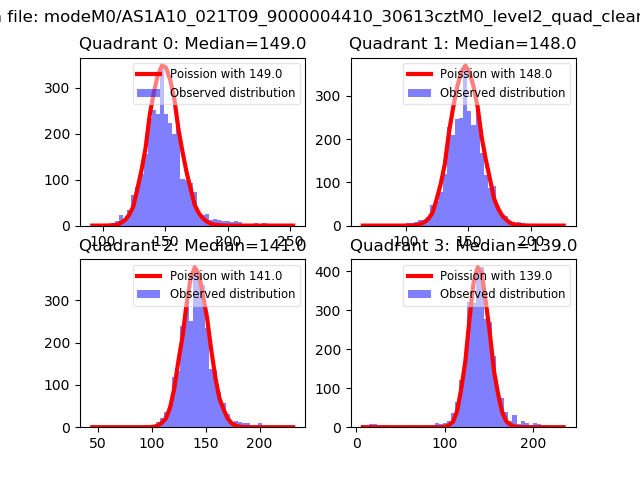
| Comparison with Poisson distribution Blue bars denote a histogram of data divided into 1 sec bins. Red curve is a Poisson curve with rate = median count rate of data. |
 |
 |
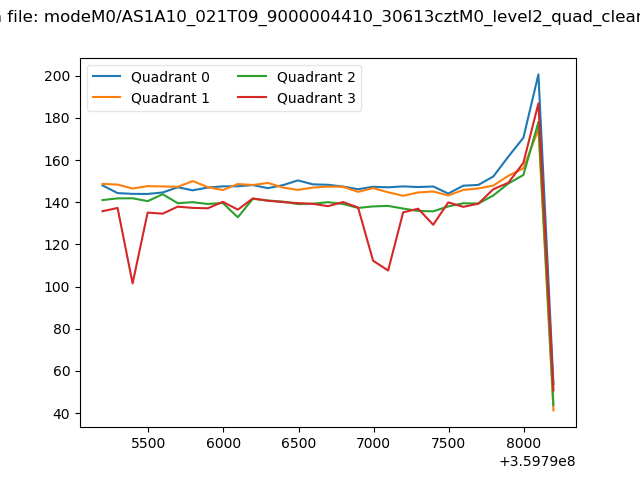
| Quadrant-wise count rates Data is divided into 100 sec bins |
 |
|
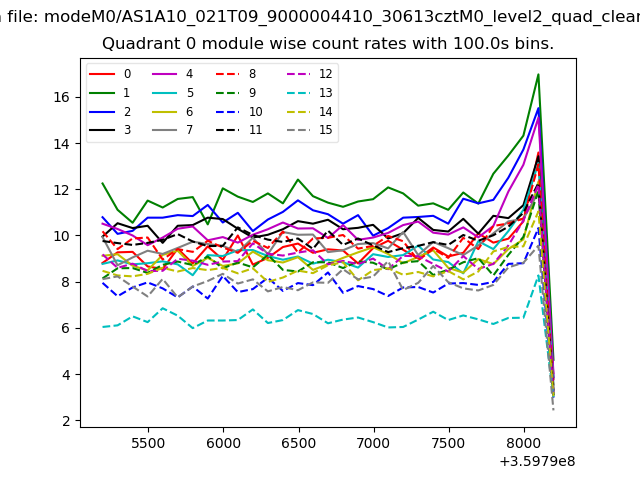
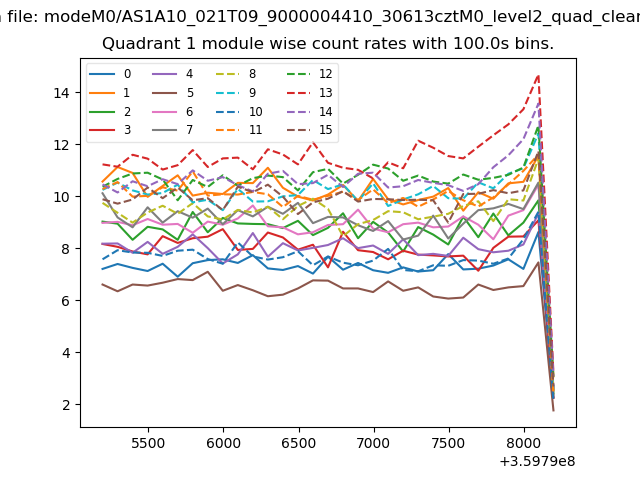
| Module-wise count rates for Quadrant A Data is divided into 100 sec bins |
 |
 |
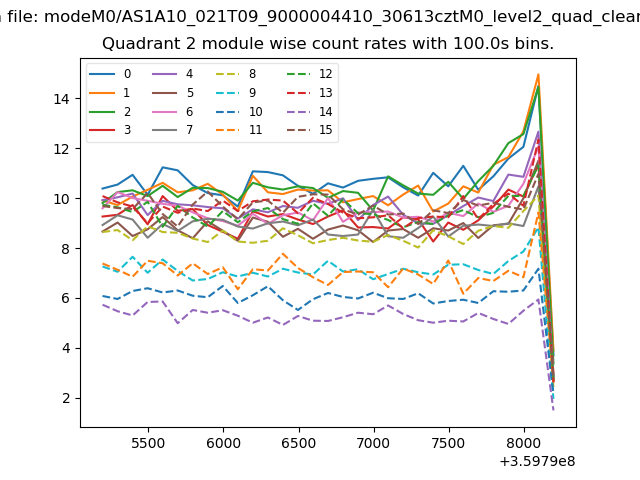
| Module-wise count rates for Quadrant B Data is divided into 100 sec bins |
 |
 |
| Module-wise count rates for Quadrant C Data is divided into 100 sec bins |
 |
 |
| Module-wise count rates for Quadrant D Data is divided into 100 sec bins |
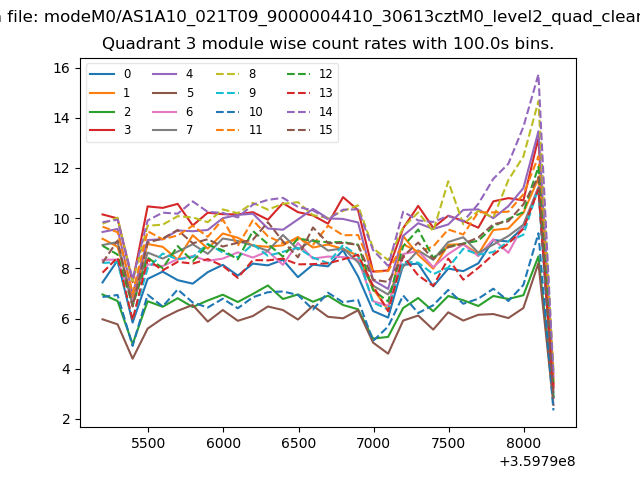 |
 |
| Parameter | Plot |
|---|---|
| CZT HV Monitor |  |
| D_VDD | 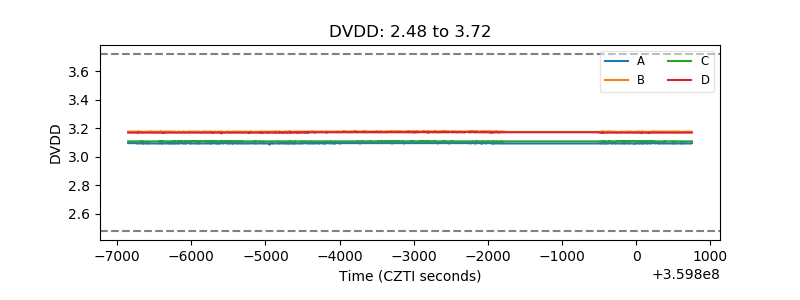 |
| Temperature 1 | 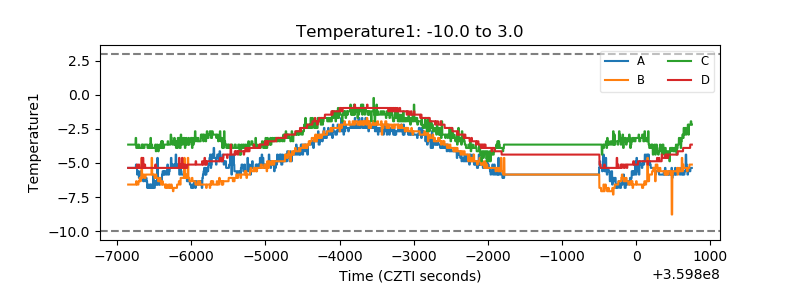 |
| Veto HV Monitor | 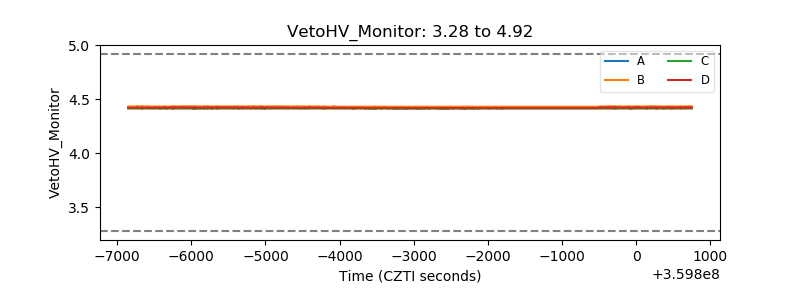 |
| Veto LLD | 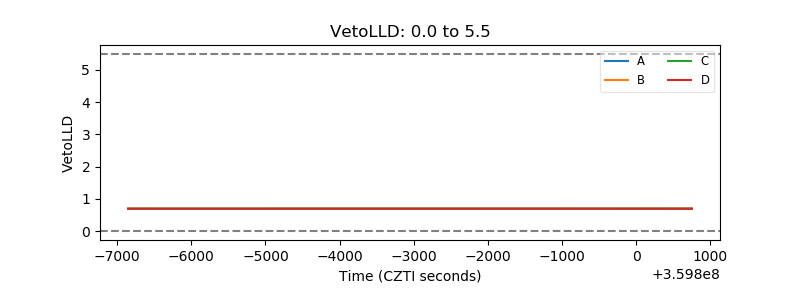 |
| Alpha Counter | 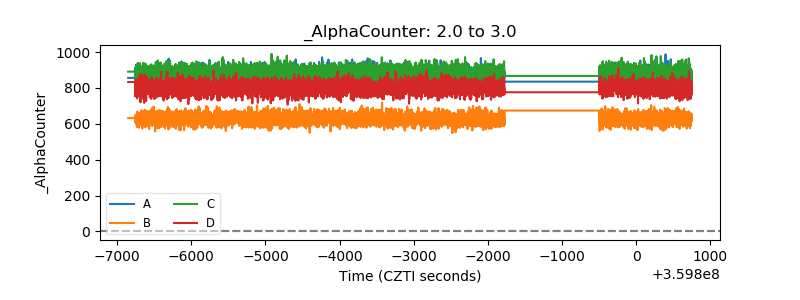 |
| _CPM_Rate | 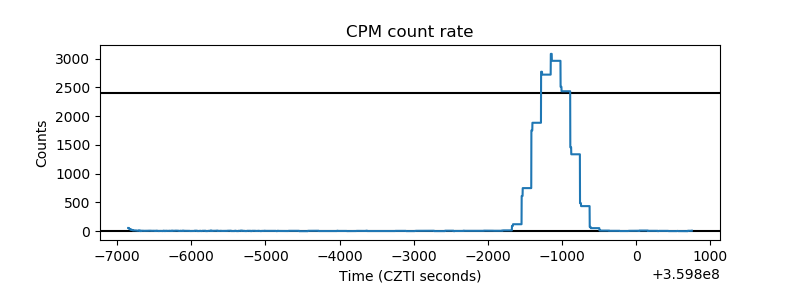 |
| CZT Counter | 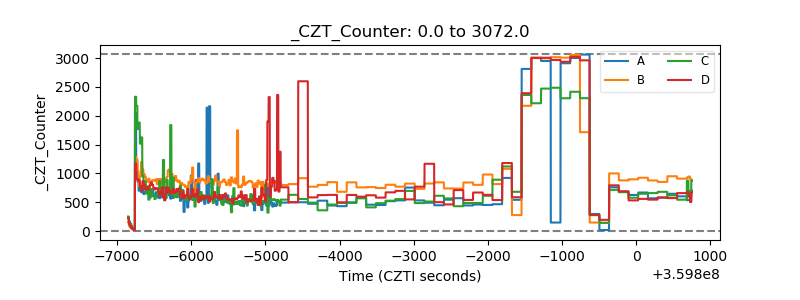 |
| +2.5 Volts monitor |  |
| +5 Volts monitor |  |
| _ROLL_ROT | 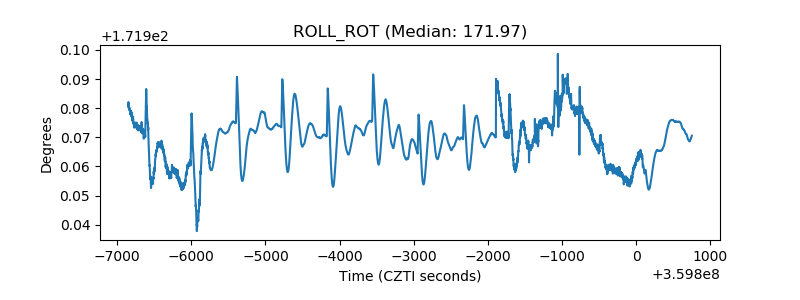 |
| _Roll_DEC | 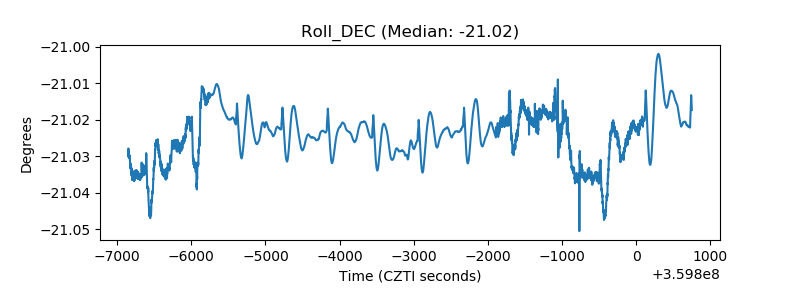 |
| _Roll_RA | 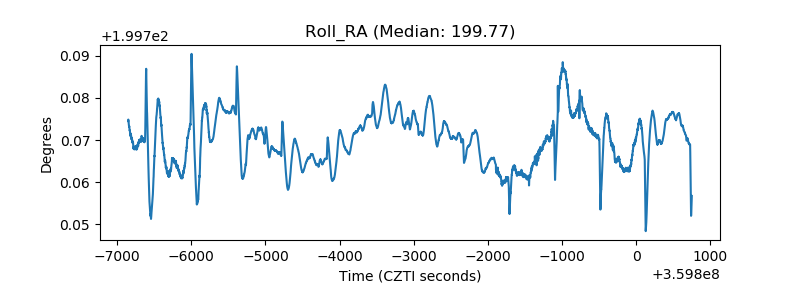 |
| Veto Counter | 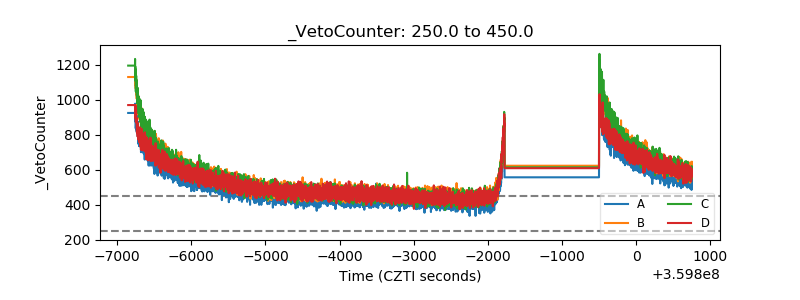 |