| Param | Original file | Final file |
|---|---|---|
| Filename | modeM0/AS1A10_021T09_9000004410_30614cztM0_level2.evt | modeM0/AS1A10_021T09_9000004410_30614cztM0_level2_quad_clean.evt |
| Size (bytes) | 374,230,080 | 49,331,520 |
| Size | 356.9 MB | 47.0 MB |
| Events in quadrant A | 2,264,288 | 323,695 |
| Events in quadrant B | 3,024,846 | 324,490 |
| Events in quadrant C | 2,737,478 | 293,204 |
| Events in quadrant D | 3,060,489 | 295,385 |
| Mode M0 | |||
|---|---|---|---|
| Quadrant | BADHDUFLAG | Total packets | Discarded packets |
| A | 0 | 8909 | 1 |
| B | 0 | 11321 | 1 |
| C | 0 | 10685 | 1 |
| D | 0 | 11797 | 1 |
| Mode M9 | |||
|---|---|---|---|
| Quadrant | BADHDUFLAG | Total packets | Discarded packets |
| A | 0 | 4 | 0 |
| B | 0 | 5 | 0 |
| C | 0 | 5 | 0 |
| D | 0 | 5 | 0 |
| Mode SS | |||
|---|---|---|---|
| Quadrant | BADHDUFLAG | Total packets | Discarded packets |
| A | 0 | 72 | 0 |
| B | 0 | 72 | 0 |
| C | 0 | 72 | 0 |
| D | 0 | 72 | 0 |
| Quadrant | Total seconds | Saturated seconds | Saturation percentage |
|---|---|---|---|
| A | 3625 | 91 | 2.510345% |
| B | 3625 | 36 | 0.993103% |
| C | 3625 | 789 | 21.765517% |
| D | 3625 | 101 | 2.786207% |
Noise dominated data is calculated using 1-second bins in cleaned event files. If a bin has >2000 counts, and if more than 50% of those come from <1% of pixels, then it is considered to be noise-dominated and hence unusable.
| Quadrant | # 1 sec bins | Bins with >0 counts | Bins with >2000 counts | High rate bins dominated by noise | Noise dominated (total time) | Noise dominated (detector-on time) | Marked lightcurve |
|---|---|---|---|---|---|---|---|
| A | 3625 | 3625 | 54 | 54 | 1.49% | 1.49% | 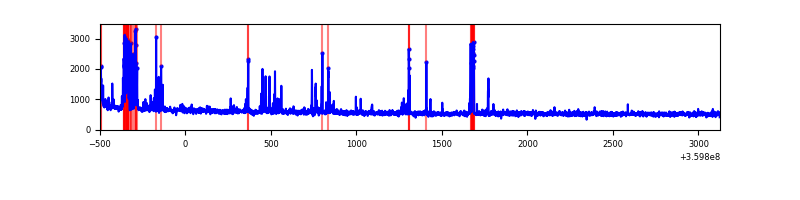 |
| B | 3625 | 3625 | 1 | 1 | 0.03% | 0.03% | 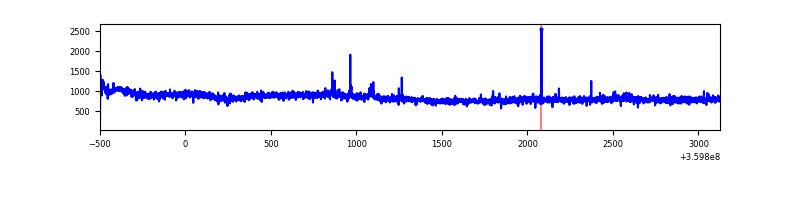 |
| C | 3625 | 3625 | 82 | 82 | 2.26% | 2.26% |  |
| D | 3625 | 3625 | 121 | 121 | 3.34% | 3.34% |  |
Top three noisy pixels from each quadrant. If the there are fewer than three noisy pixels in the level2.evt file, extra rows are filled as -1
| Pixel properties | Quadrant properties | ||||||
|---|---|---|---|---|---|---|---|
| Quadrant | DetID | PixID | Counts | Sigma | Mean | Median | Sigma |
| A | 0 | 13 | 246042 | 2380.72 | 520 | 513 | 103.1 |
| A | 8 | 192 | 11658 | 108.07 | 520 | 513 | 103.1 |
| A | 13 | 254 | 6321 | 56.32 | 520 | 513 | 103.1 |
| B | 6 | 159 | 976850 | 10181.0 | 513 | 504 | 95.9 |
| B | 0 | 190 | 13889 | 139.57 | 513 | 504 | 95.9 |
| B | 12 | 111 | 10920 | 108.61 | 513 | 504 | 95.9 |
| C | 15 | 208 | 339476 | 3229.06 | 461 | 466 | 105.0 |
| C | 14 | 238 | 222932 | 2118.98 | 461 | 466 | 105.0 |
| C | 14 | 254 | 198235 | 1883.74 | 461 | 466 | 105.0 |
| D | 8 | 195 | 840721 | 7221.44 | 499 | 489 | 116.4 |
| D | 12 | 218 | 158532 | 1358.31 | 499 | 489 | 116.4 |
| D | 5 | 222 | 52967 | 451.03 | 499 | 489 | 116.4 |
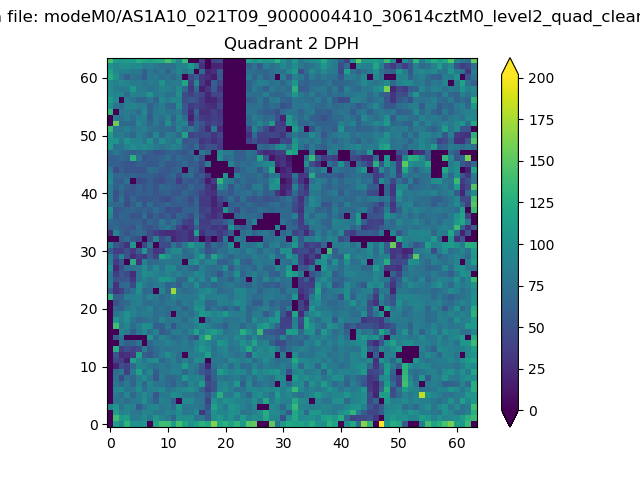
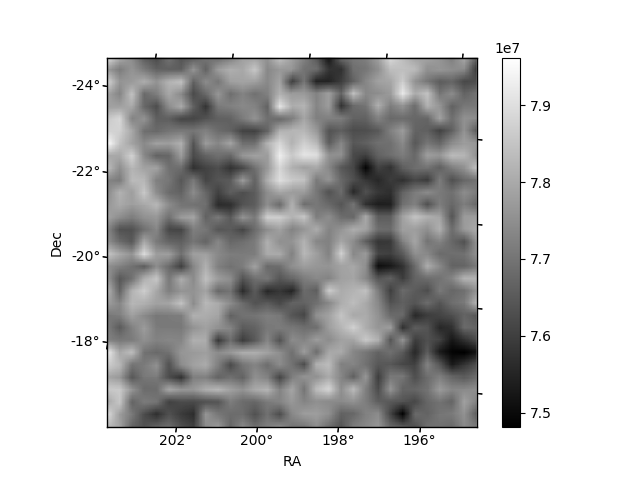
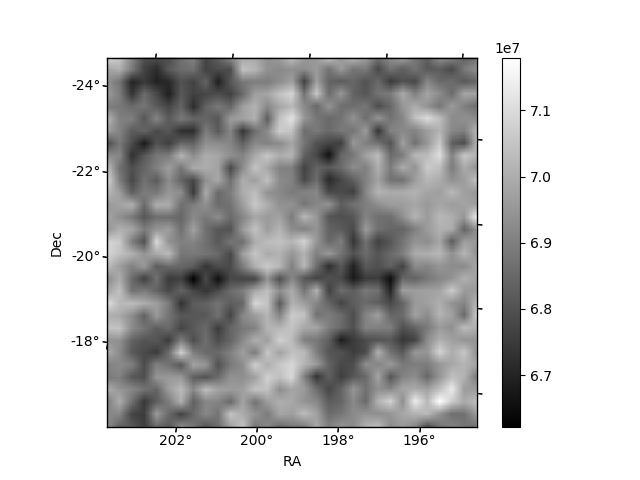
Histogram calculated using DETX and DETY for each event in the final _common_clean file
| Quadrant A | 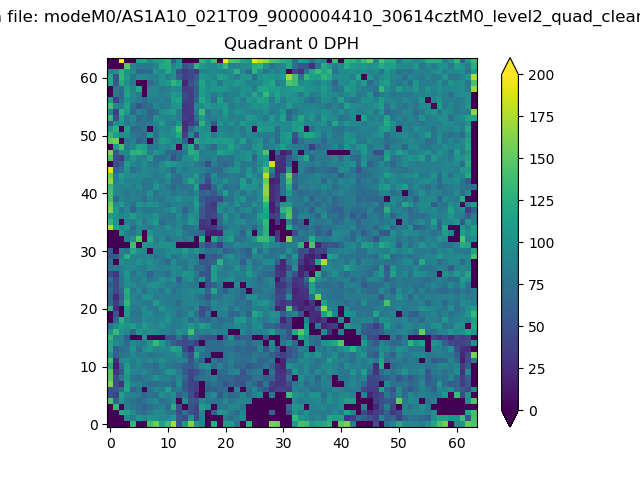 |
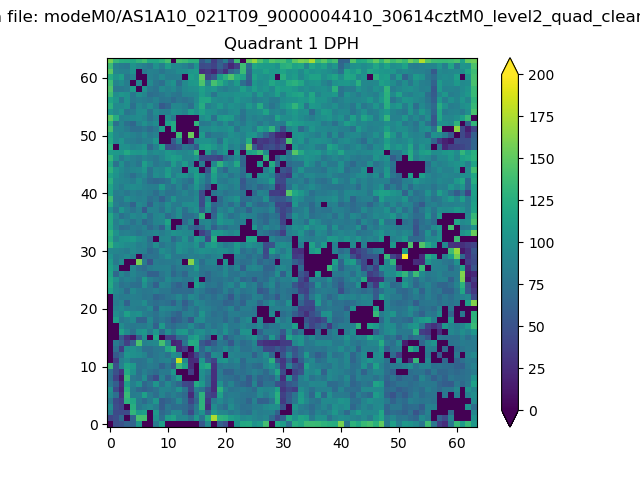 |
Quadrant B |
|---|---|---|---|
| Quadrant D | 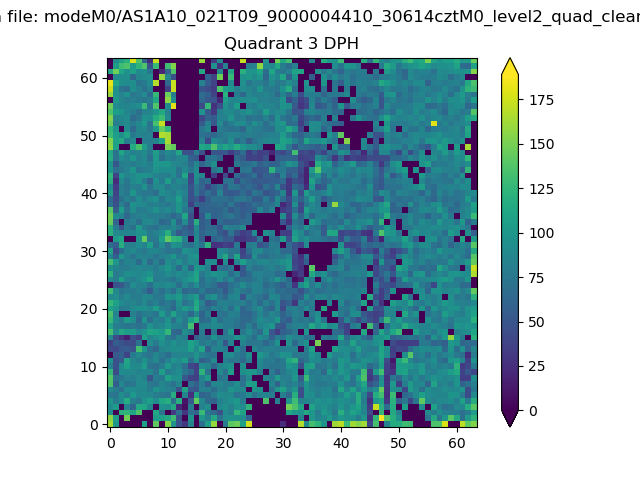 |
 |
Quadrant C |
| Plot type | Count rate plots | Images |
|---|---|---|
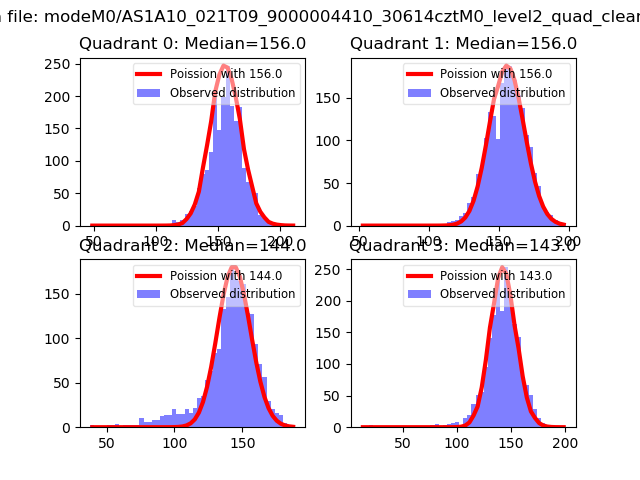
| Comparison with Poisson distribution Blue bars denote a histogram of data divided into 1 sec bins. Red curve is a Poisson curve with rate = median count rate of data. |
 |
 |
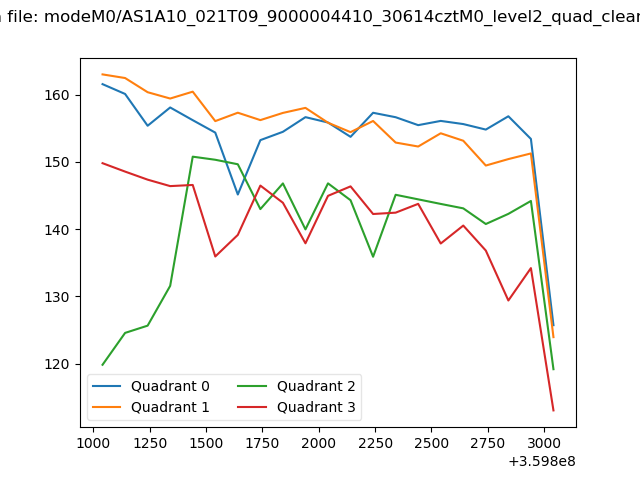
| Quadrant-wise count rates Data is divided into 100 sec bins |
 |
|
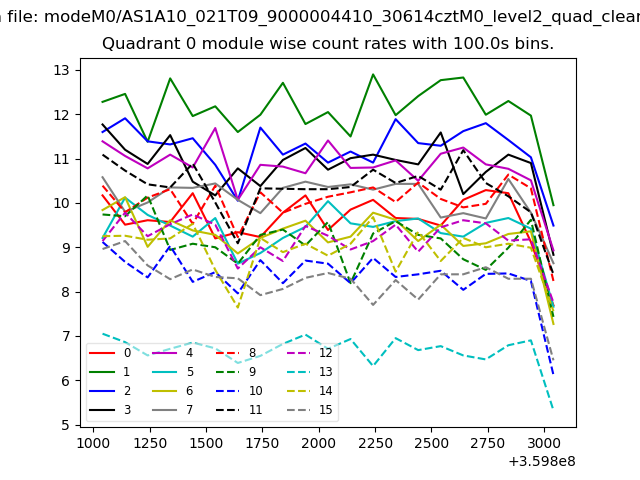
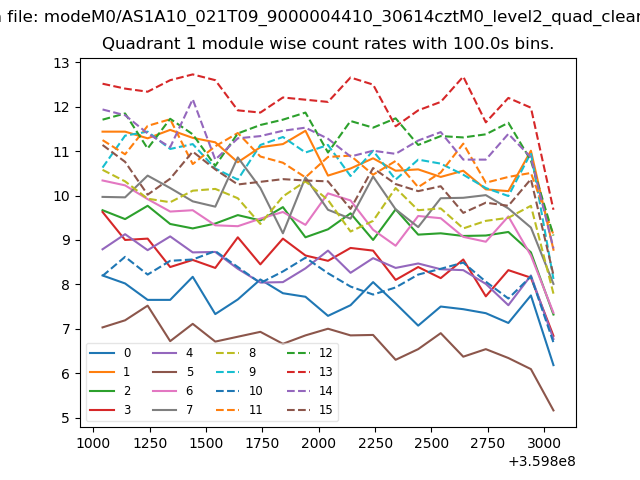
| Module-wise count rates for Quadrant A Data is divided into 100 sec bins |
 |
 |
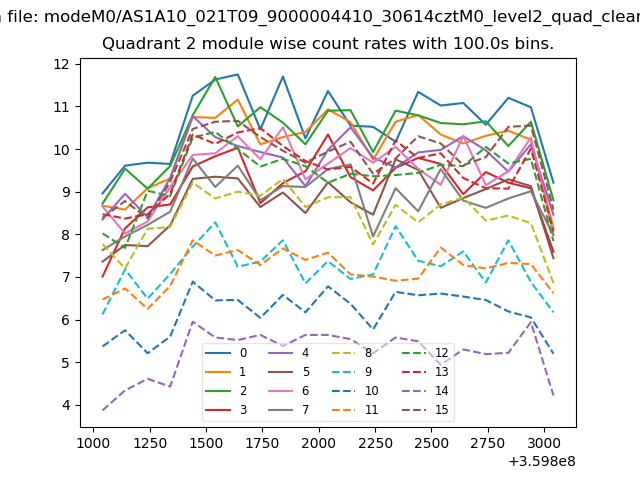
| Module-wise count rates for Quadrant B Data is divided into 100 sec bins |
 |
 |
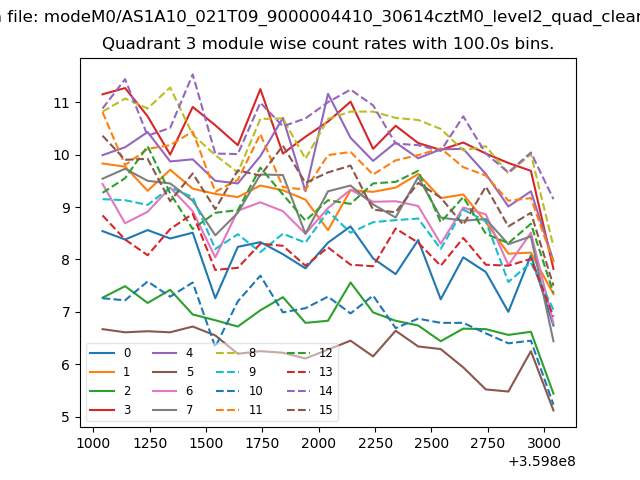
| Module-wise count rates for Quadrant C Data is divided into 100 sec bins |
 |
 |
| Module-wise count rates for Quadrant D Data is divided into 100 sec bins |
 |
 |
| Parameter | Plot |
|---|---|
| CZT HV Monitor | 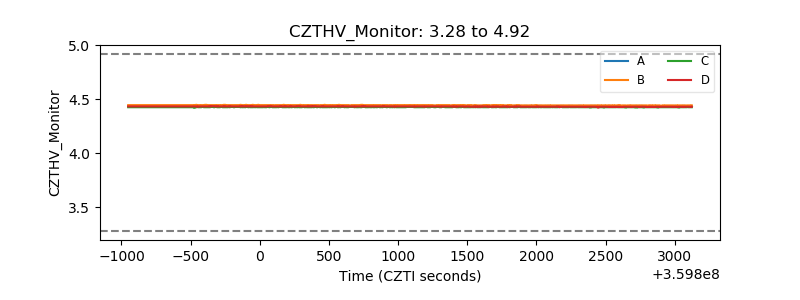 |
| D_VDD | 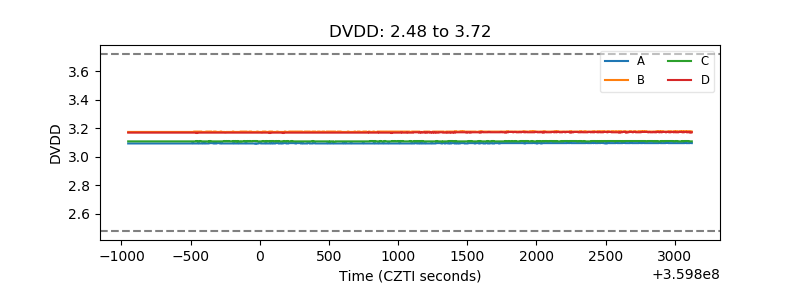 |
| Temperature 1 | 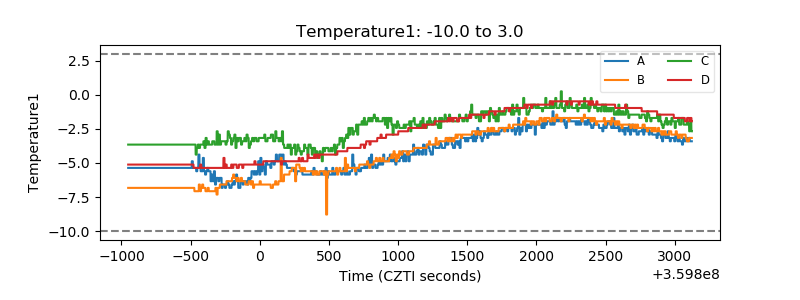 |
| Veto HV Monitor |  |
| Veto LLD | 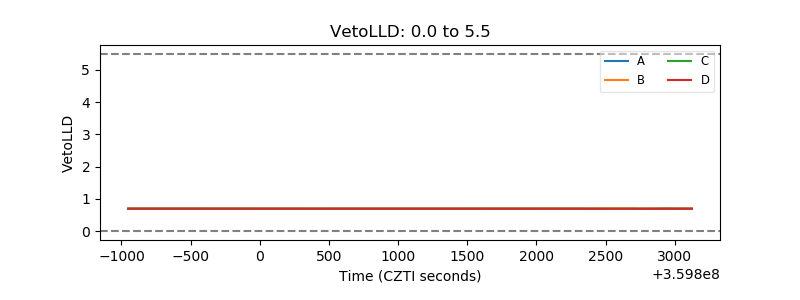 |
| Alpha Counter | 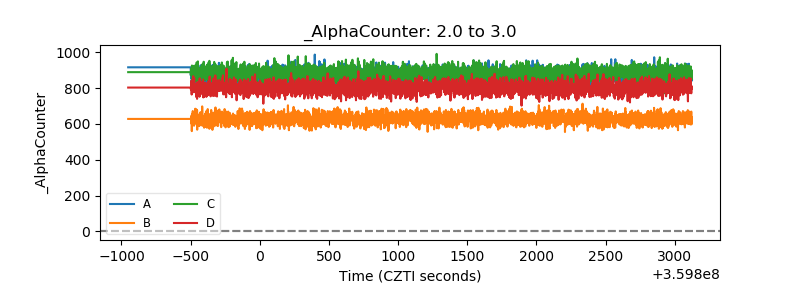 |
| _CPM_Rate | 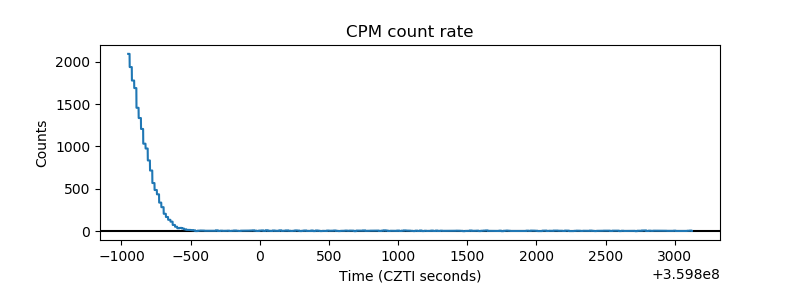 |
| CZT Counter | 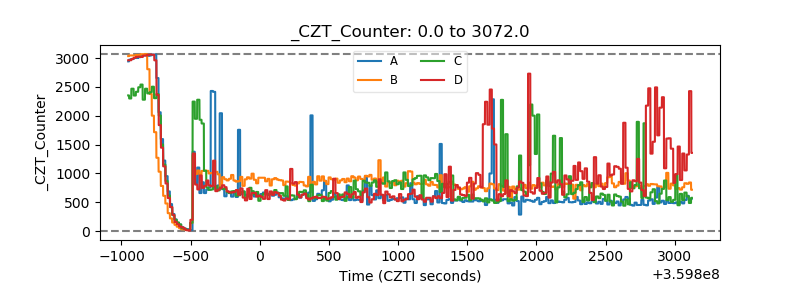 |
| +2.5 Volts monitor |  |
| +5 Volts monitor |  |
| _ROLL_ROT | 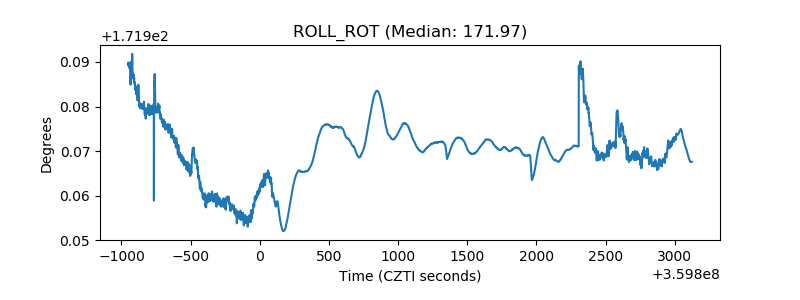 |
| _Roll_DEC | 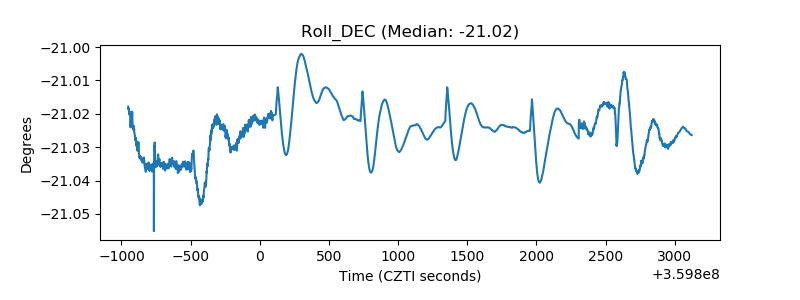 |
| _Roll_RA |  |
| Veto Counter | 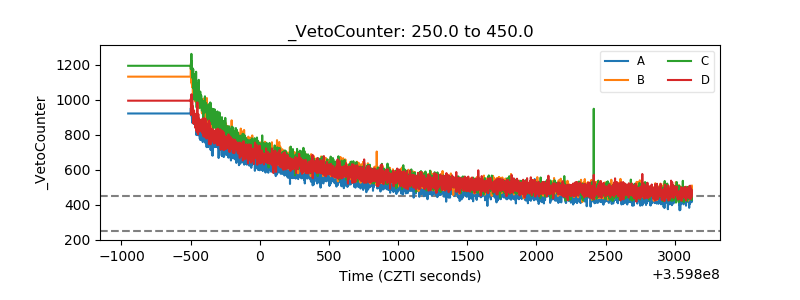 |