| Param | Original file | Final file |
|---|---|---|
| Filename | modeM0/AS1A10_071T05_9000004412cztM0_level2.fits | modeM0/AS1A10_071T05_9000004412cztM0_level2_quad_clean.evt |
| Size (bytes) | 721,497,600 | 558,192,960 |
| Size | 688.1 MB | 532.3 MB |
| Events in quadrant A | 4,592,170 | 3,209,882 |
| Events in quadrant B | 4,269,248 | 3,148,424 |
| Events in quadrant C | 4,298,756 | 2,968,882 |
| Events in quadrant D | 3,856,426 | 2,741,836 |
| Mode M0 | |||
|---|---|---|---|
| Quadrant | BADHDUFLAG | Total packets | Discarded packets |
| A | 0 | 153278 | 0 |
| B | 0 | 215786 | 0 |
| C | 0 | 157934 | 0 |
| D | 0 | 211793 | 0 |
| Mode M9 | |||
|---|---|---|---|
| Quadrant | BADHDUFLAG | Total packets | Discarded packets |
| A | 0 | 108 | 0 |
| B | 0 | 108 | 0 |
| C | 0 | 108 | 0 |
| D | 0 | 108 | 0 |
| Mode SS | |||
|---|---|---|---|
| Quadrant | BADHDUFLAG | Total packets | Discarded packets |
| A | 0 | 1436 | 0 |
| B | 0 | 1436 | 0 |
| C | 0 | 1436 | 0 |
| D | 0 | 1436 | 0 |
| Quadrant | Total seconds | Saturated seconds | Saturation percentage |
|---|---|---|---|
| A | 70483 | 1129 | 1.601805% |
| B | 70483 | 1576 | 2.236000% |
| C | 70483 | 2388 | 3.388051% |
| D | 70483 | 1690 | 2.397741% |
Noise dominated data is calculated using 1-second bins in cleaned event files. If a bin has >2000 counts, and if more than 50% of those come from <1% of pixels, then it is considered to be noise-dominated and hence unusable.
| Quadrant | # 1 sec bins | Bins with >0 counts | Bins with >2000 counts | High rate bins dominated by noise | Noise dominated (total time) | Noise dominated (detector-on time) | Marked lightcurve |
|---|---|---|---|---|---|---|---|
| A | 81274 | 70485 | 0 | 0 | 0.00% | 0.00% |  |
| B | 81274 | 70484 | 0 | 0 | 0.00% | 0.00% | 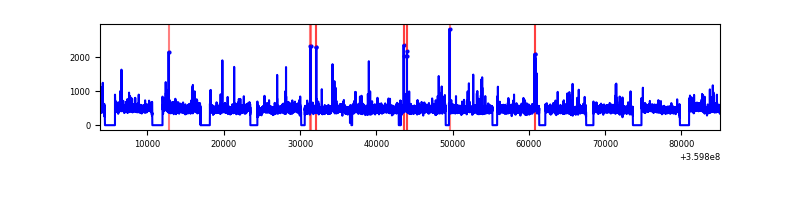 |
| C | 81274 | 70480 | 0 | 0 | 0.00% | 0.00% |  |
| D | 81274 | 70476 | 0 | 0 | 0.00% | 0.00% |  |
Top three noisy pixels from each quadrant. If the there are fewer than three noisy pixels in the level2.evt file, extra rows are filled as -1
| Pixel properties | Quadrant properties | ||||||
|---|---|---|---|---|---|---|---|
| Quadrant | DetID | PixID | Counts | Sigma | Mean | Median | Sigma |
| A | 0 | 29 | 3669 | 8.84 | 1197 | 1128 | 287.3 |
| A | 7 | 110 | 3662 | 8.82 | 1197 | 1128 | 287.3 |
| A | 9 | 19 | 3364 | 7.78 | 1197 | 1128 | 287.3 |
| B | 2 | 9 | 3441 | 10.65 | 1129 | 1079 | 221.8 |
| B | 2 | 8 | 2826 | 7.88 | 1129 | 1079 | 221.8 |
| B | 5 | 232 | 2825 | 7.87 | 1129 | 1079 | 221.8 |
| C | 12 | 241 | 2996 | 6.73 | 1139 | 1068 | 286.4 |
| C | 3 | 126 | 2941 | 6.54 | 1139 | 1068 | 286.4 |
| C | 9 | 209 | 2869 | 6.29 | 1139 | 1068 | 286.4 |
| D | 15 | 46 | 2821 | 6.26 | 1101 | 1010 | 289.1 |
| D | 6 | 231 | 2664 | 5.72 | 1101 | 1010 | 289.1 |
| D | 7 | 3 | 2663 | 5.72 | 1101 | 1010 | 289.1 |
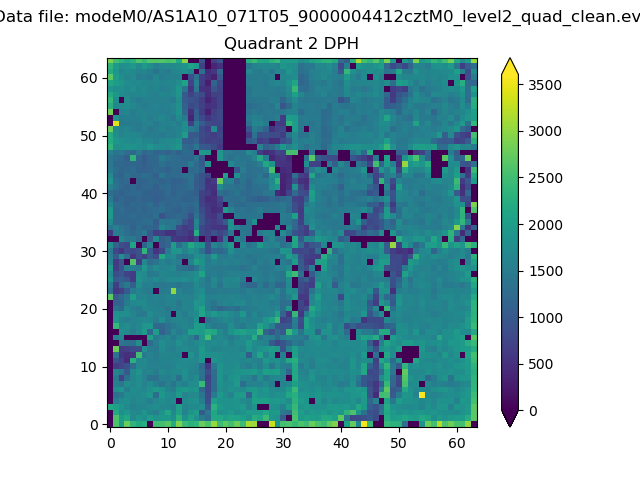
Histogram calculated using DETX and DETY for each event in the final _common_clean file
| Quadrant A |  |
 |
Quadrant B |
|---|---|---|---|
| Quadrant D | 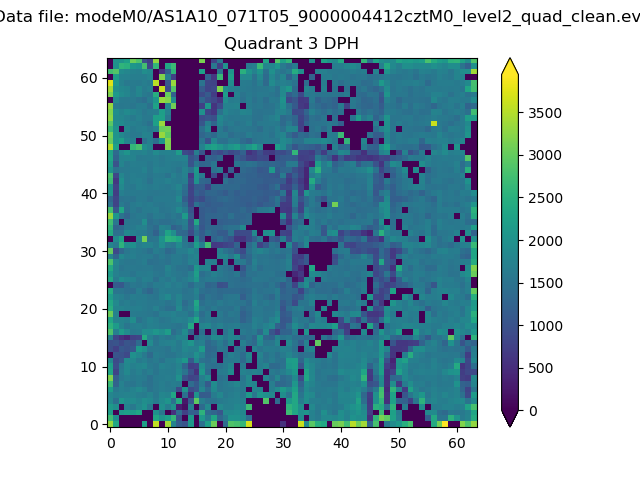 |
 |
Quadrant C |
| Plot type | Count rate plots | Images |
|---|---|---|
| Comparison with Poisson distribution Blue bars denote a histogram of data divided into 1 sec bins. Red curve is a Poisson curve with rate = median count rate of data. |
 |
 |
| Quadrant-wise count rates Data is divided into 100 sec bins |
 |
|
| Module-wise count rates for Quadrant A Data is divided into 100 sec bins |
 |
 |
| Module-wise count rates for Quadrant B Data is divided into 100 sec bins |
 |
 |
| Module-wise count rates for Quadrant C Data is divided into 100 sec bins |
 |
 |
| Module-wise count rates for Quadrant D Data is divided into 100 sec bins |
 |
 |
| Parameter | Plot |
|---|---|
| CZT HV Monitor |  |
| D_VDD | 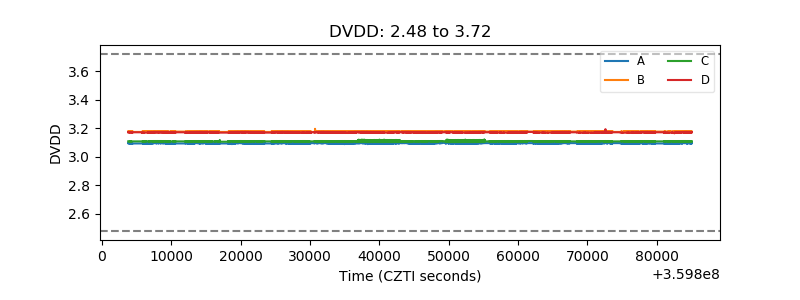 |
| Temperature 1 |  |
| Veto HV Monitor | 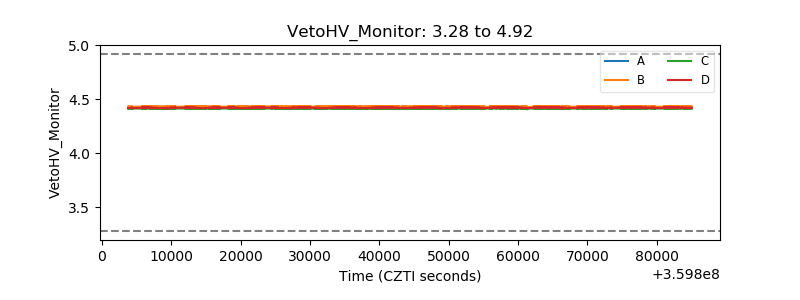 |
| Veto LLD |  |
| Alpha Counter |  |
| _CPM_Rate |  |
| CZT Counter |  |
| +2.5 Volts monitor | 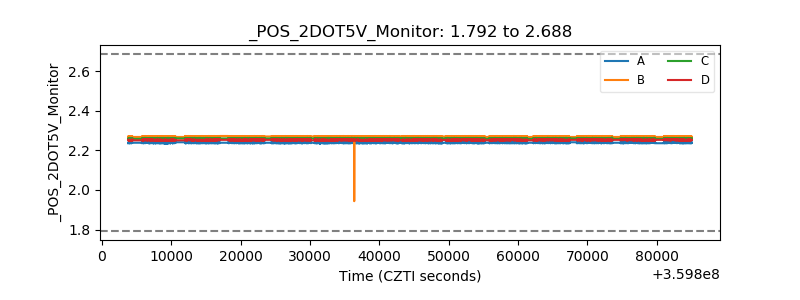 |
| +5 Volts monitor |  |
| _ROLL_ROT |  |
| _Roll_DEC |  |
| _Roll_RA |  |
| Veto Counter | 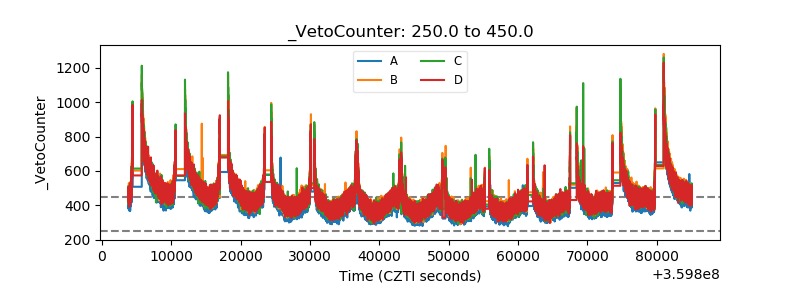 |