| Param | Original file | Final file |
|---|---|---|
| Filename | modeM0/AS1A10_071T05_9000004412_30615cztM0_level2.evt | modeM0/AS1A10_071T05_9000004412_30615cztM0_level2_quad_clean.evt |
| Size (bytes) | 648,472,320 | 110,520,000 |
| Size | 618.4 MB | 105.4 MB |
| Events in quadrant A | 3,847,057 | 759,313 |
| Events in quadrant B | 5,433,372 | 750,938 |
| Events in quadrant C | 4,493,261 | 702,545 |
| Events in quadrant D | 5,428,051 | 682,744 |
| Mode M0 | |||
|---|---|---|---|
| Quadrant | BADHDUFLAG | Total packets | Discarded packets |
| A | 0 | 15684 | 2 |
| B | 0 | 20326 | 4 |
| C | 0 | 17666 | 2 |
| D | 0 | 21180 | 2 |
| Mode M9 | |||
|---|---|---|---|
| Quadrant | BADHDUFLAG | Total packets | Discarded packets |
| A | 0 | 23 | 0 |
| B | 0 | 24 | 0 |
| C | 0 | 24 | 0 |
| D | 0 | 24 | 0 |
| Mode SS | |||
|---|---|---|---|
| Quadrant | BADHDUFLAG | Total packets | Discarded packets |
| A | 0 | 132 | 0 |
| B | 0 | 132 | 0 |
| C | 0 | 132 | 0 |
| D | 0 | 132 | 0 |
| Quadrant | Total seconds | Saturated seconds | Saturation percentage |
|---|---|---|---|
| A | 6474 | 126 | 1.946247% |
| B | 6473 | 178 | 2.749884% |
| C | 6473 | 543 | 8.388691% |
| D | 6473 | 270 | 4.171173% |
Noise dominated data is calculated using 1-second bins in cleaned event files. If a bin has >2000 counts, and if more than 50% of those come from <1% of pixels, then it is considered to be noise-dominated and hence unusable.
| Quadrant | # 1 sec bins | Bins with >0 counts | Bins with >2000 counts | High rate bins dominated by noise | Noise dominated (total time) | Noise dominated (detector-on time) | Marked lightcurve |
|---|---|---|---|---|---|---|---|
| A | 7819 | 6475 | 18 | 18 | 0.23% | 0.28% | 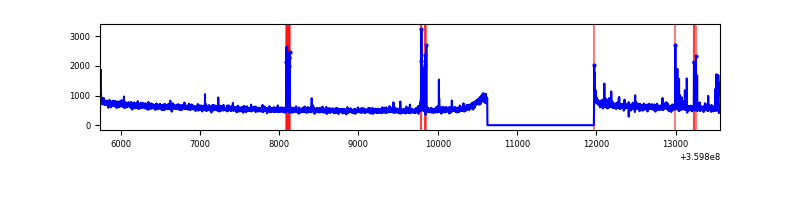 |
| B | 7818 | 6474 | 3 | 3 | 0.04% | 0.05% | 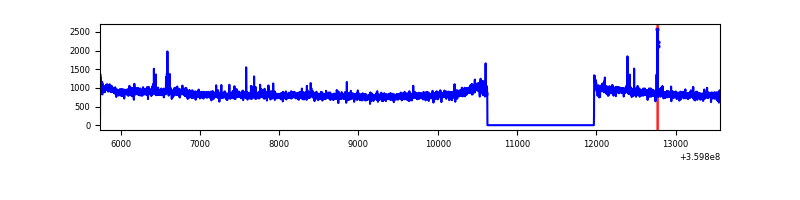 |
| C | 7818 | 6474 | 151 | 151 | 1.93% | 2.33% | 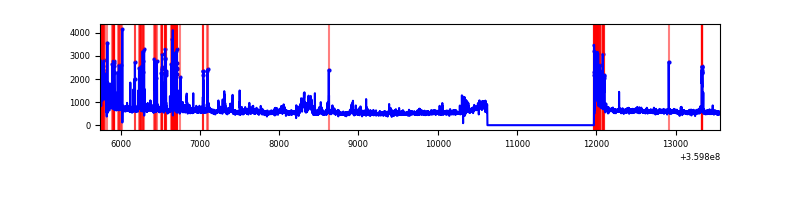 |
| D | 7818 | 6474 | 189 | 189 | 2.42% | 2.92% |  |
Top three noisy pixels from each quadrant. If the there are fewer than three noisy pixels in the level2.evt file, extra rows are filled as -1
| Pixel properties | Quadrant properties | ||||||
|---|---|---|---|---|---|---|---|
| Quadrant | DetID | PixID | Counts | Sigma | Mean | Median | Sigma |
| A | 0 | 13 | 117824 | 617.91 | 959 | 947 | 189.1 |
| A | 8 | 192 | 24234 | 123.11 | 959 | 947 | 189.1 |
| A | 13 | 254 | 12483 | 60.99 | 959 | 947 | 189.1 |
| B | 6 | 159 | 1724436 | 9922.54 | 927 | 908 | 173.7 |
| B | 0 | 229 | 29954 | 167.22 | 927 | 908 | 173.7 |
| B | 12 | 111 | 20477 | 112.66 | 927 | 908 | 173.7 |
| C | 15 | 208 | 361623 | 1806.44 | 863 | 871 | 199.7 |
| C | 0 | 10 | 277604 | 1385.72 | 863 | 871 | 199.7 |
| C | 3 | 233 | 251237 | 1253.69 | 863 | 871 | 199.7 |
| D | 8 | 195 | 638773 | 3025.88 | 908 | 889 | 210.8 |
| D | 1 | 52 | 633756 | 3002.08 | 908 | 889 | 210.8 |
| D | 5 | 222 | 371637 | 1758.69 | 908 | 889 | 210.8 |
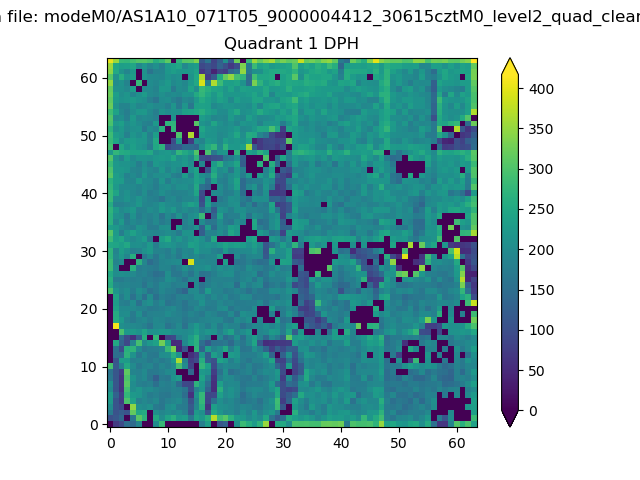
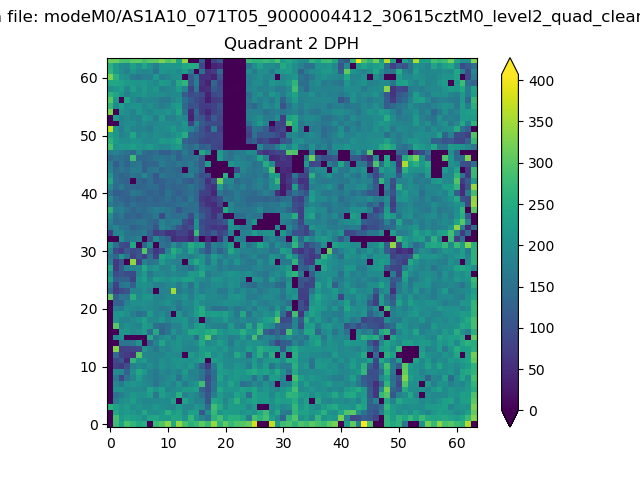
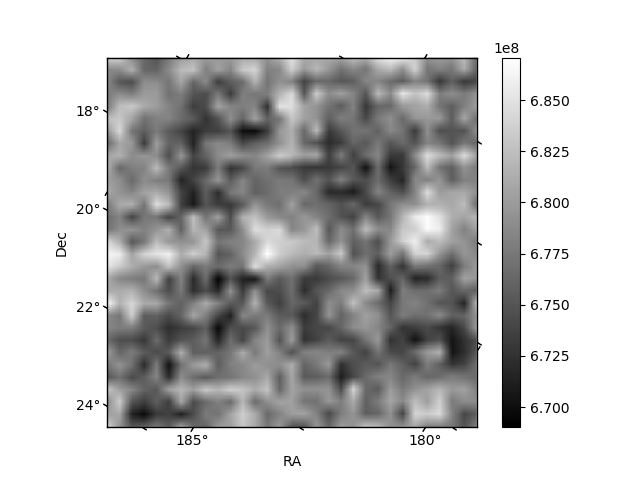
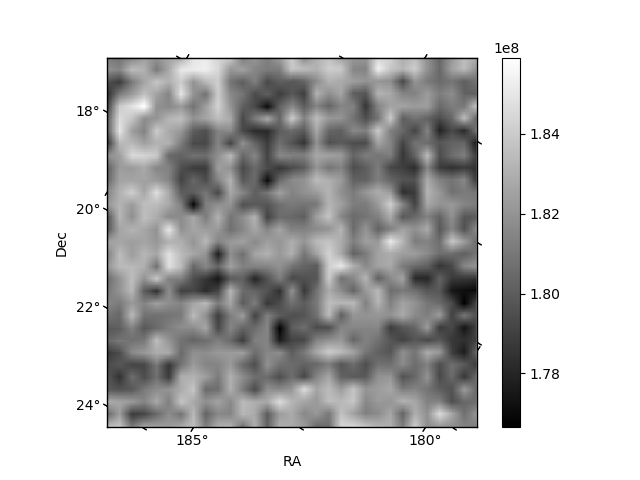
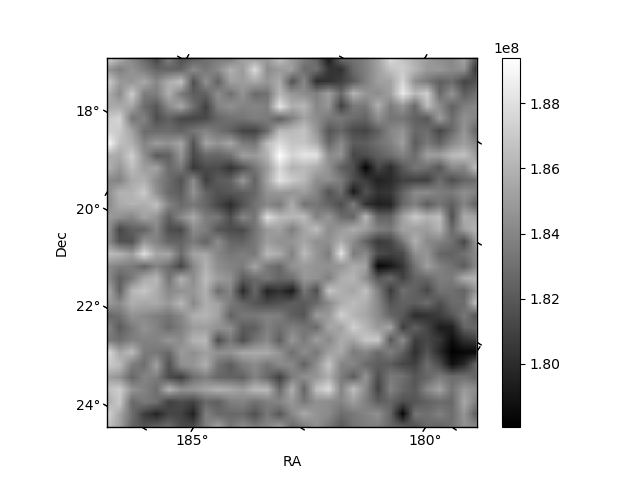
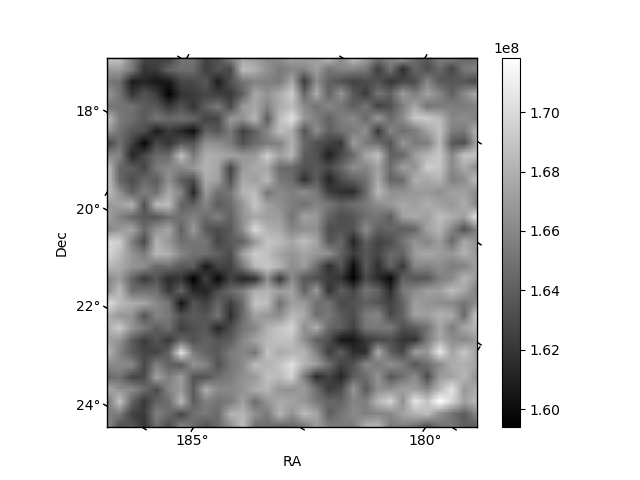
Histogram calculated using DETX and DETY for each event in the final _common_clean file
| Quadrant A | 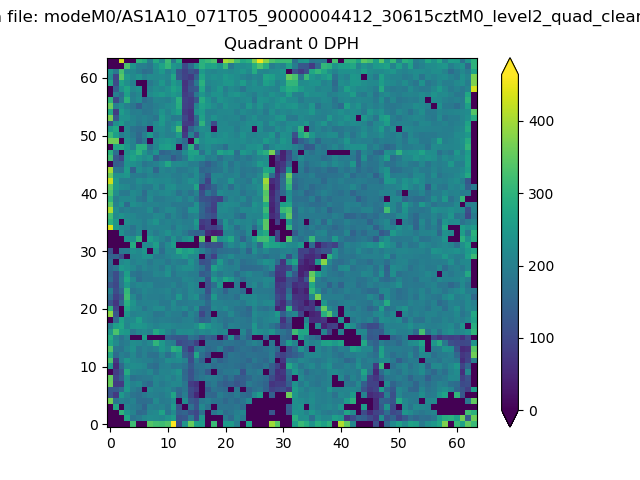 |
 |
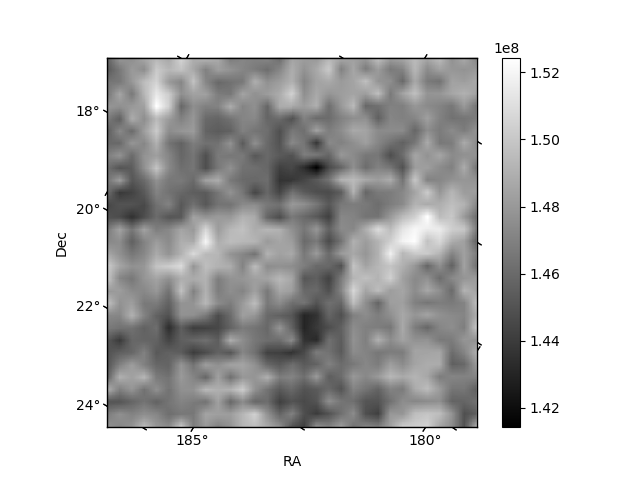
Quadrant B |
|---|---|---|---|
| Quadrant D | 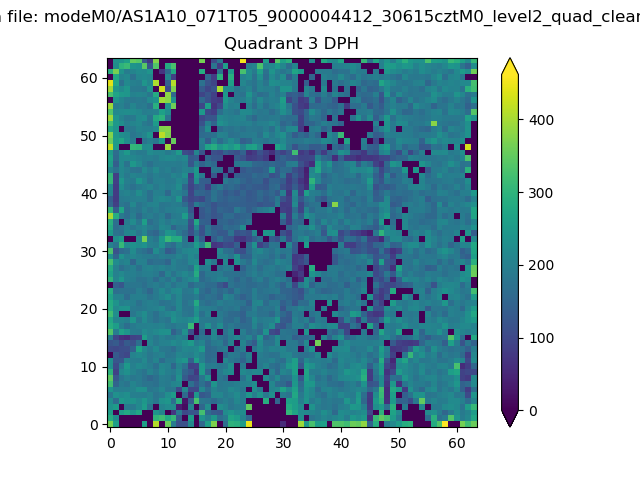 |
 |
Quadrant C |
| Plot type | Count rate plots | Images |
|---|---|---|
| Comparison with Poisson distribution Blue bars denote a histogram of data divided into 1 sec bins. Red curve is a Poisson curve with rate = median count rate of data. |
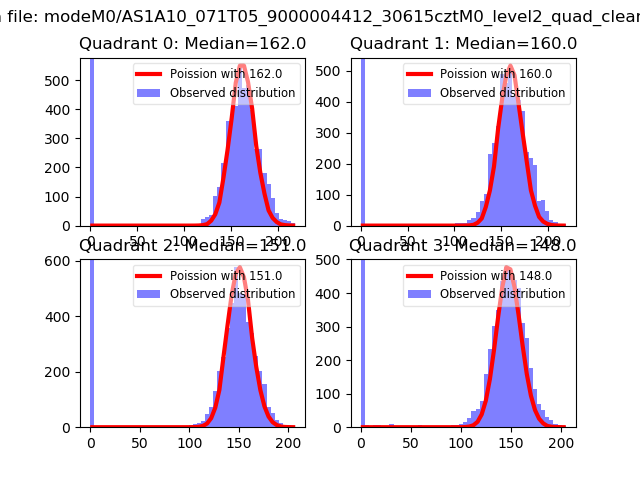 |
 |
| Quadrant-wise count rates Data is divided into 100 sec bins |
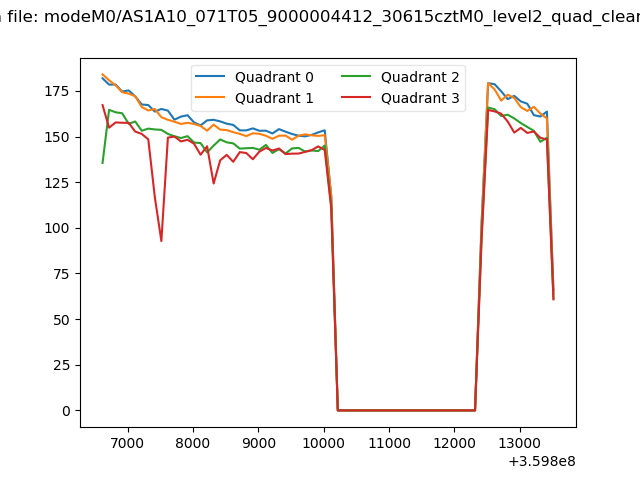 |
|
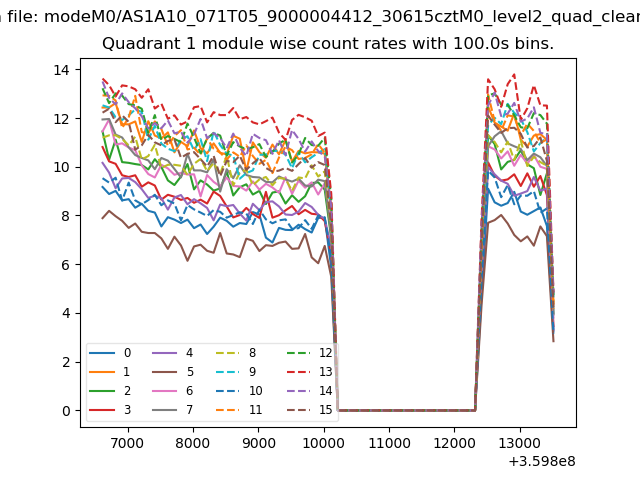
| Module-wise count rates for Quadrant A Data is divided into 100 sec bins |
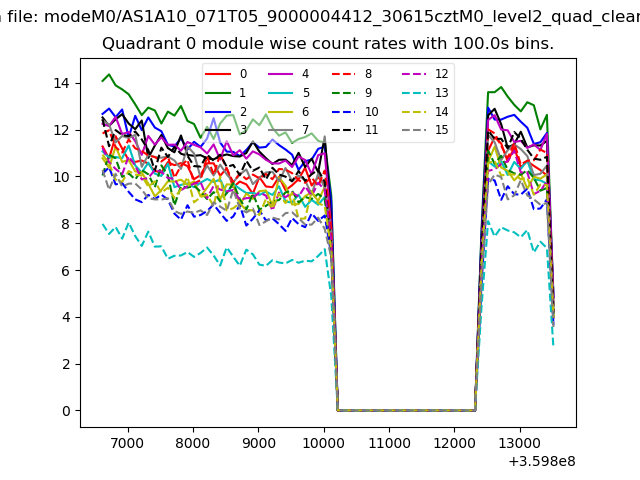 |
 |
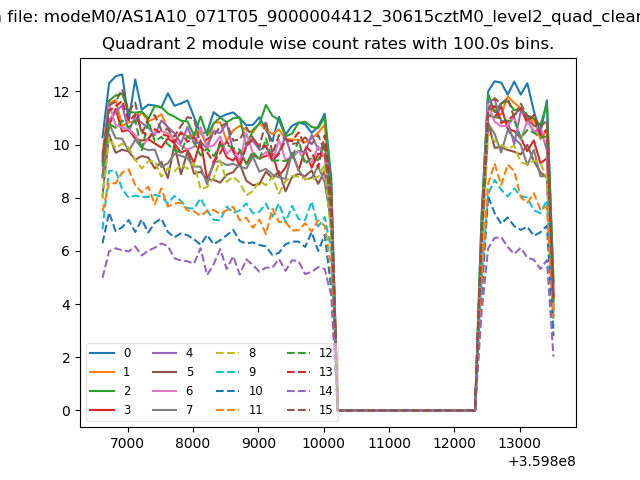
| Module-wise count rates for Quadrant B Data is divided into 100 sec bins |
 |
 |
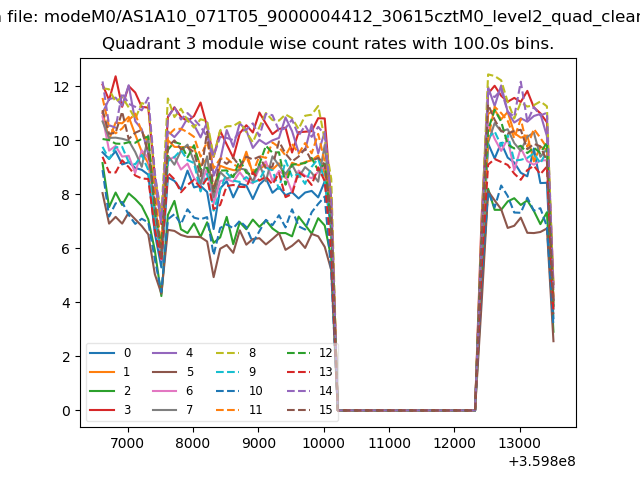
| Module-wise count rates for Quadrant C Data is divided into 100 sec bins |
 |
 |
| Module-wise count rates for Quadrant D Data is divided into 100 sec bins |
 |
 |
| Parameter | Plot |
|---|---|
| CZT HV Monitor | 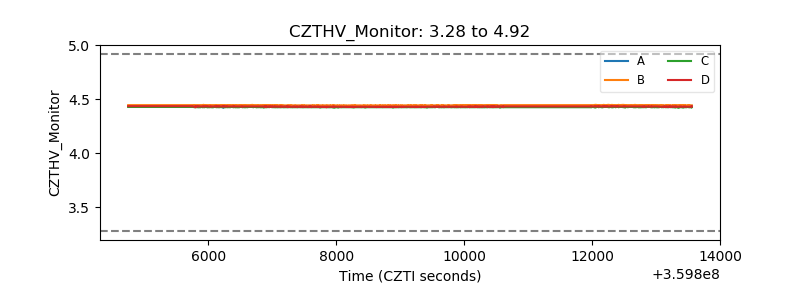 |
| D_VDD | 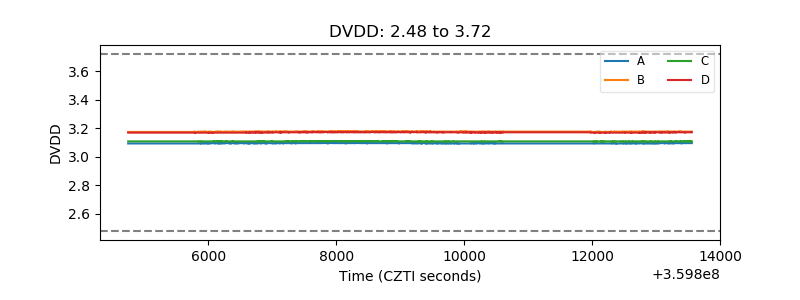 |
| Temperature 1 | 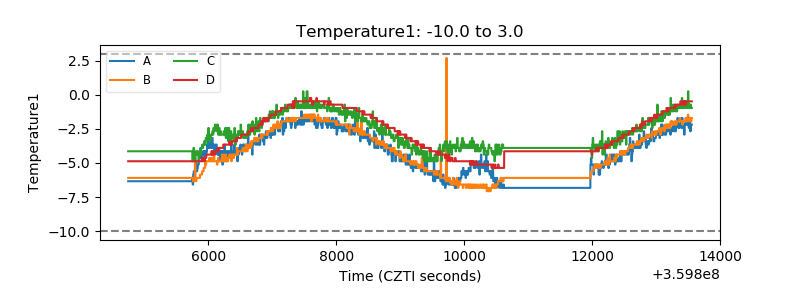 |
| Veto HV Monitor | 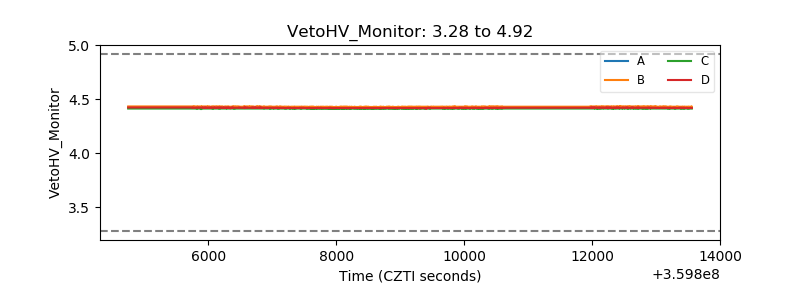 |
| Veto LLD | 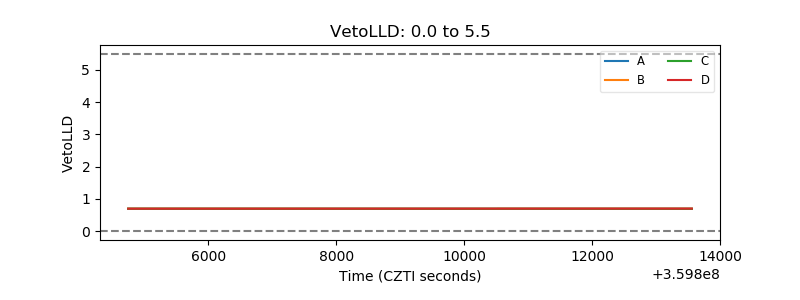 |
| Alpha Counter | 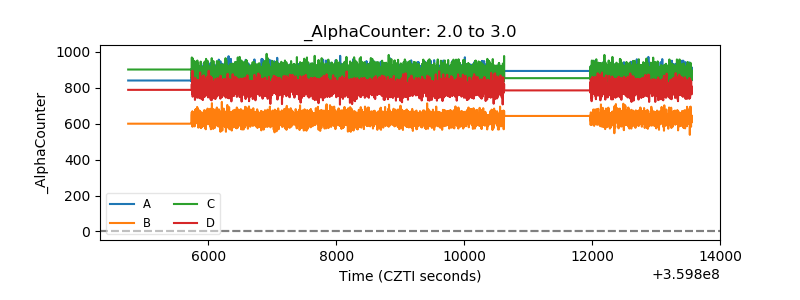 |
| _CPM_Rate | 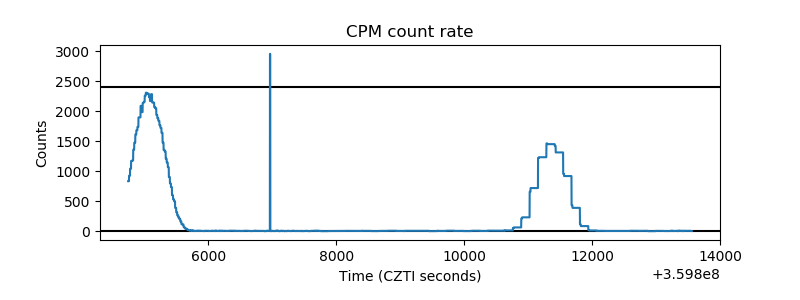 |
| CZT Counter | 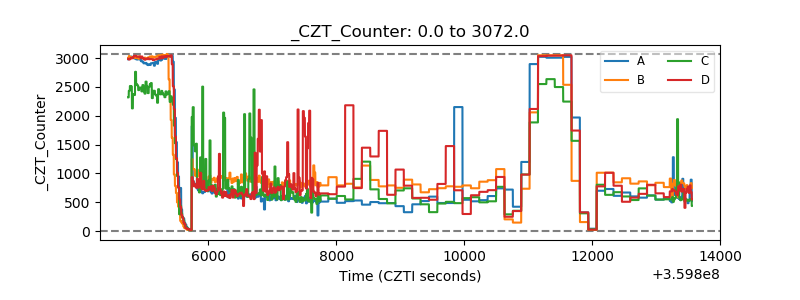 |
| +2.5 Volts monitor |  |
| +5 Volts monitor |  |
| _ROLL_ROT | 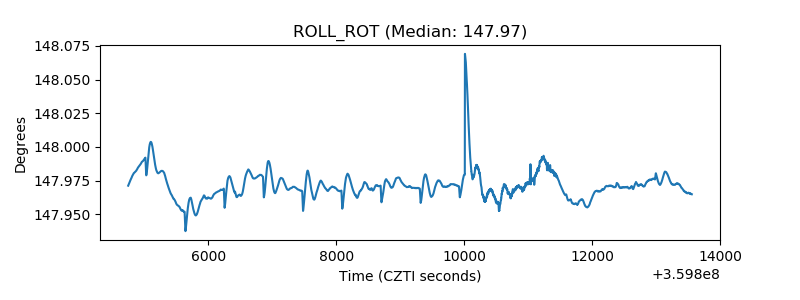 |
| _Roll_DEC | 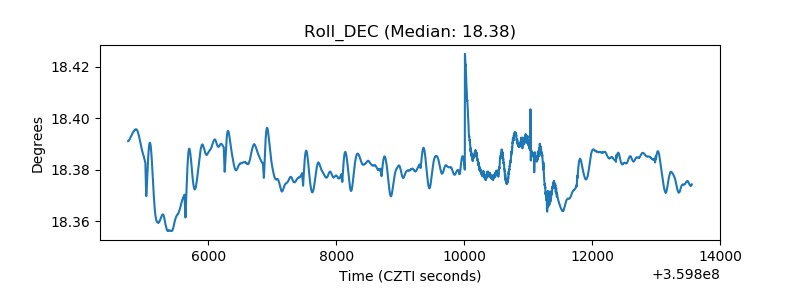 |
| _Roll_RA | 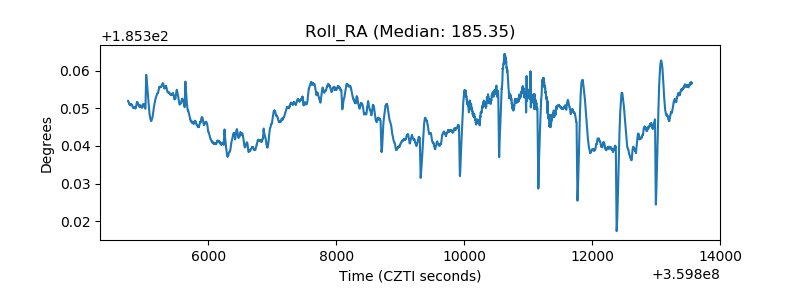 |
| Veto Counter | 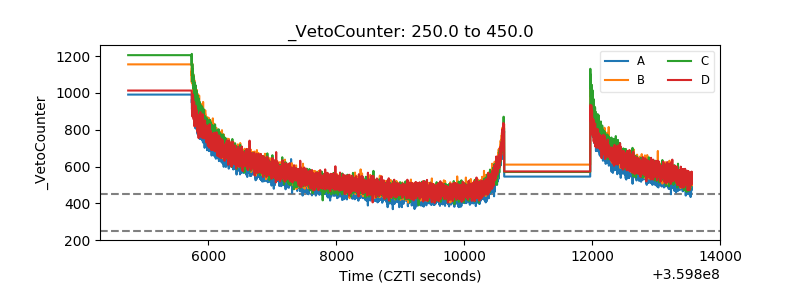 |