| Param | Original file | Final file |
|---|---|---|
| Filename | modeM0/AS1A10_071T05_9000004412_30616cztM0_level2.evt | modeM0/AS1A10_071T05_9000004412_30616cztM0_level2_quad_clean.evt |
| Size (bytes) | 568,235,520 | 114,963,840 |
| Size | 541.9 MB | 109.6 MB |
| Events in quadrant A | 3,450,498 | 793,730 |
| Events in quadrant B | 5,056,251 | 783,283 |
| Events in quadrant C | 3,504,845 | 742,150 |
| Events in quadrant D | 4,773,290 | 725,250 |
| Mode M0 | |||
|---|---|---|---|
| Quadrant | BADHDUFLAG | Total packets | Discarded packets |
| A | 0 | 14090 | 1 |
| B | 0 | 19335 | 1 |
| C | 0 | 14171 | 1 |
| D | 0 | 18935 | 1 |
| Mode M9 | |||
|---|---|---|---|
| Quadrant | BADHDUFLAG | Total packets | Discarded packets |
| A | 0 | 12 | 0 |
| B | 0 | 12 | 0 |
| C | 0 | 12 | 0 |
| D | 0 | 12 | 0 |
| Mode SS | |||
|---|---|---|---|
| Quadrant | BADHDUFLAG | Total packets | Discarded packets |
| A | 0 | 128 | 0 |
| B | 0 | 128 | 0 |
| C | 0 | 128 | 0 |
| D | 0 | 128 | 0 |
| Quadrant | Total seconds | Saturated seconds | Saturation percentage |
|---|---|---|---|
| A | 6266 | 150 | 2.393872% |
| B | 6266 | 229 | 3.654644% |
| C | 6265 | 242 | 3.862729% |
| D | 6266 | 259 | 4.133418% |
Noise dominated data is calculated using 1-second bins in cleaned event files. If a bin has >2000 counts, and if more than 50% of those come from <1% of pixels, then it is considered to be noise-dominated and hence unusable.
| Quadrant | # 1 sec bins | Bins with >0 counts | Bins with >2000 counts | High rate bins dominated by noise | Noise dominated (total time) | Noise dominated (detector-on time) | Marked lightcurve |
|---|---|---|---|---|---|---|---|
| A | 7461 | 6268 | 4 | 4 | 0.05% | 0.06% | 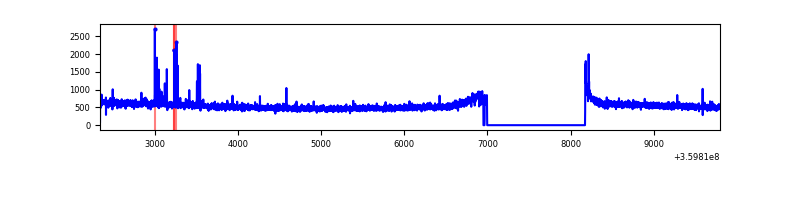 |
| B | 7461 | 6268 | 3 | 3 | 0.04% | 0.05% | 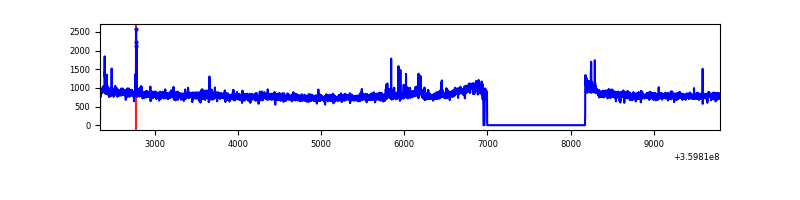 |
| C | 7460 | 6267 | 21 | 21 | 0.28% | 0.34% | 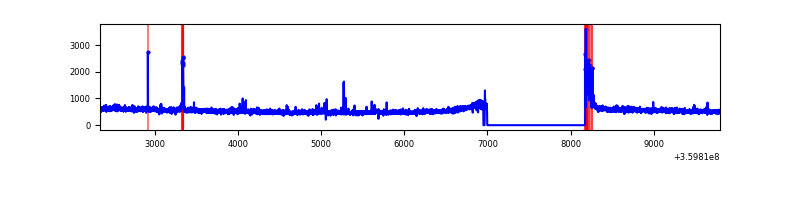 |
| D | 7461 | 6268 | 143 | 143 | 1.92% | 2.28% | 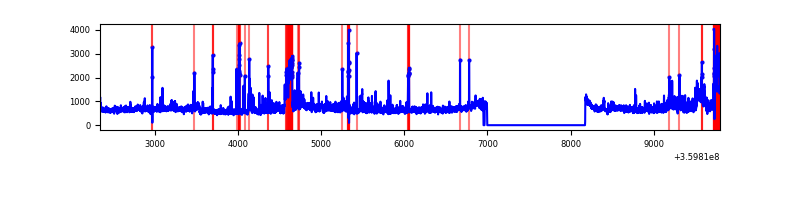 |
Top three noisy pixels from each quadrant. If the there are fewer than three noisy pixels in the level2.evt file, extra rows are filled as -1
| Pixel properties | Quadrant properties | ||||||
|---|---|---|---|---|---|---|---|
| Quadrant | DetID | PixID | Counts | Sigma | Mean | Median | Sigma |
| A | 0 | 13 | 59436 | 336.55 | 873 | 859 | 174.1 |
| A | 13 | 254 | 11912 | 63.5 | 873 | 859 | 174.1 |
| A | 8 | 192 | 9886 | 51.86 | 873 | 859 | 174.1 |
| B | 6 | 159 | 1662791 | 10371.13 | 845 | 826 | 160.2 |
| B | 0 | 229 | 54174 | 332.91 | 845 | 826 | 160.2 |
| B | 12 | 111 | 19070 | 113.85 | 845 | 826 | 160.2 |
| C | 14 | 238 | 133330 | 701.15 | 814 | 821 | 189.0 |
| C | 0 | 10 | 116064 | 609.79 | 814 | 821 | 189.0 |
| C | 3 | 233 | 67487 | 352.75 | 814 | 821 | 189.0 |
| D | 8 | 195 | 942348 | 4738.32 | 840 | 820 | 198.7 |
| D | 2 | 250 | 226479 | 1135.65 | 840 | 820 | 198.7 |
| D | 1 | 52 | 147228 | 736.81 | 840 | 820 | 198.7 |
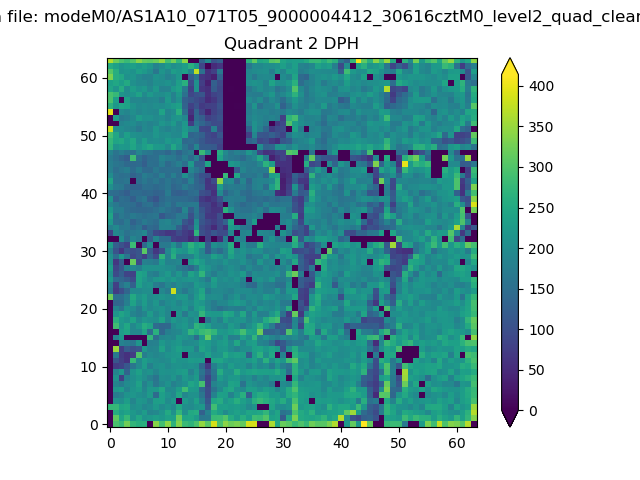
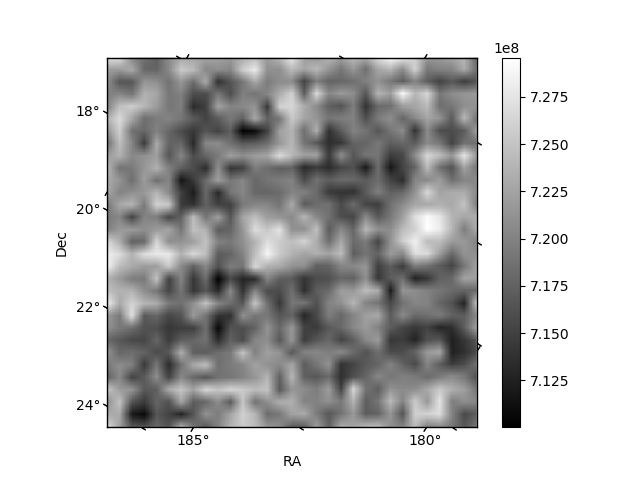
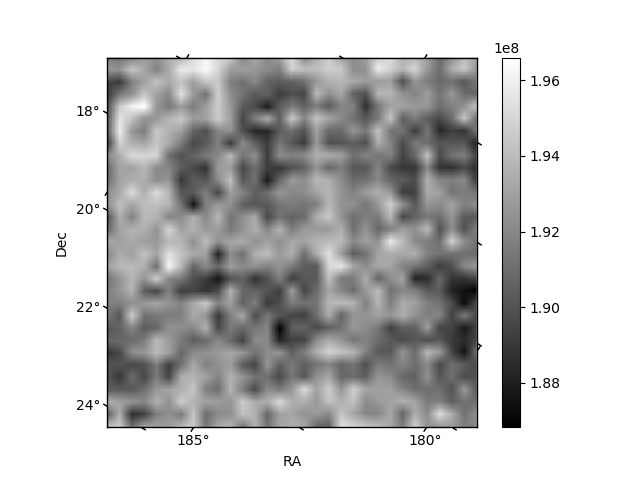
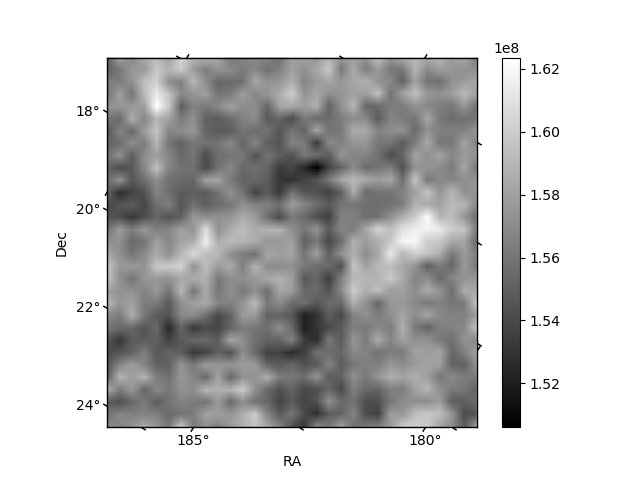
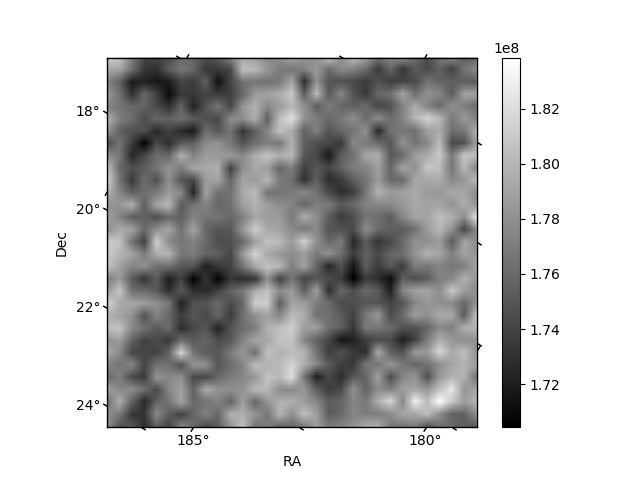
Histogram calculated using DETX and DETY for each event in the final _common_clean file
| Quadrant A | 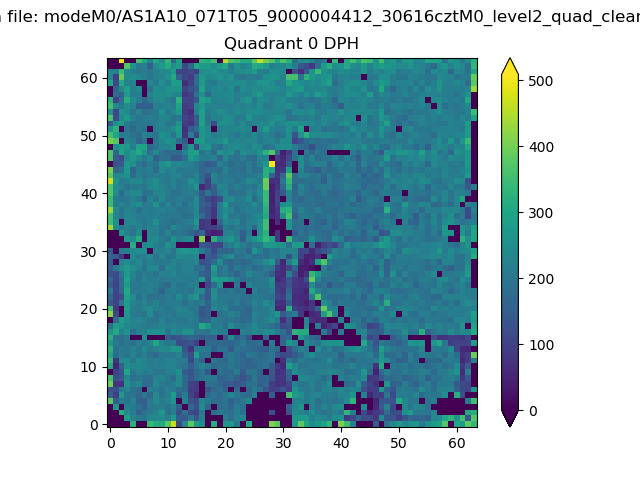 |
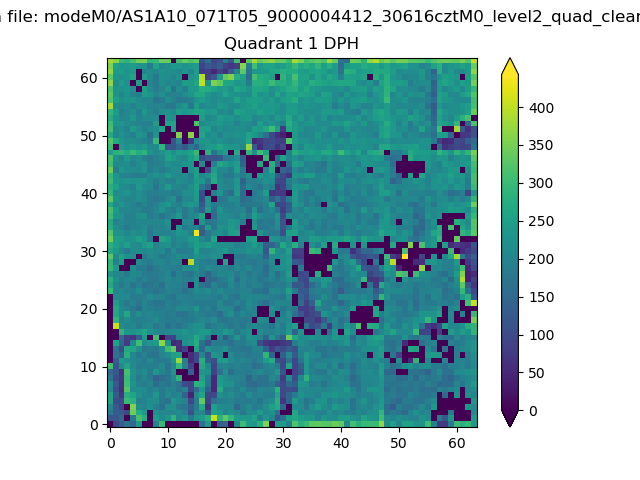 |
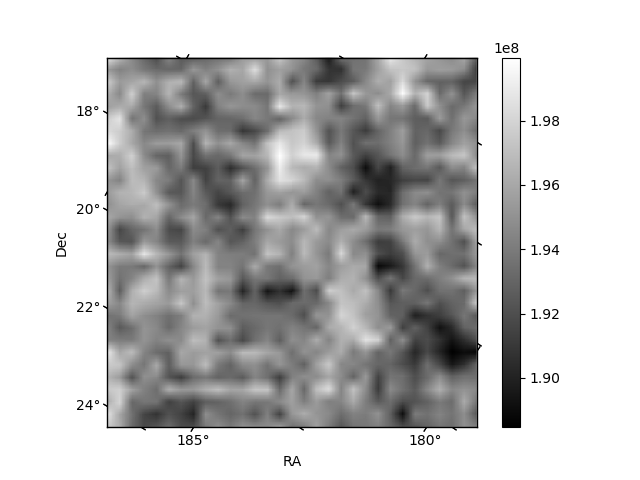
Quadrant B |
|---|---|---|---|
| Quadrant D | 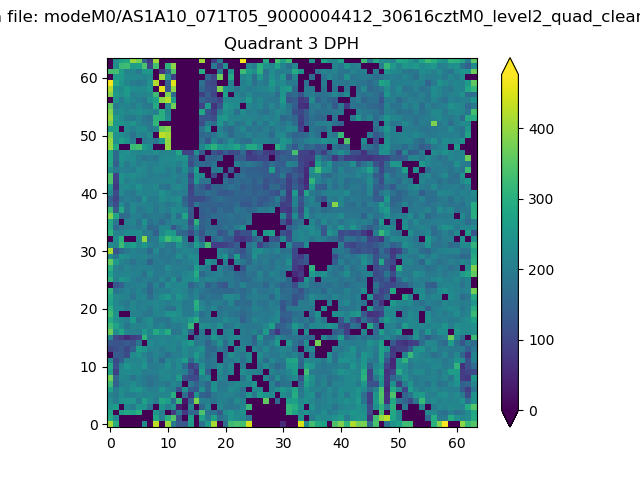 |
 |
Quadrant C |
| Plot type | Count rate plots | Images |
|---|---|---|
| Comparison with Poisson distribution Blue bars denote a histogram of data divided into 1 sec bins. Red curve is a Poisson curve with rate = median count rate of data. |
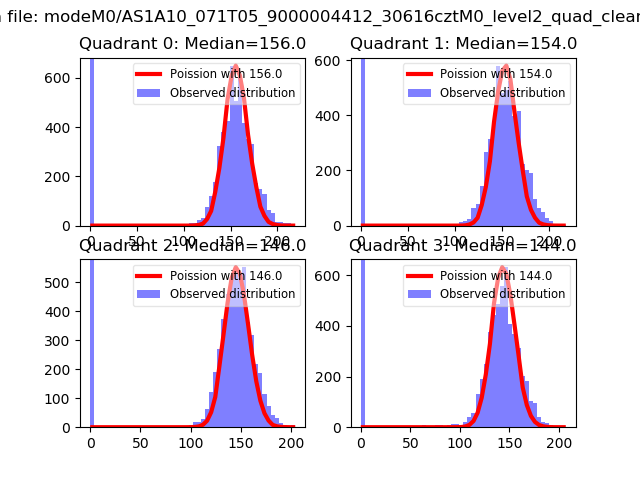 |
 |
| Quadrant-wise count rates Data is divided into 100 sec bins |
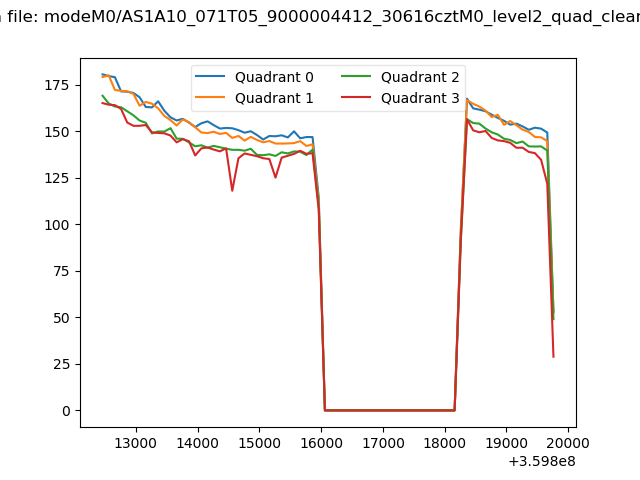 |
|
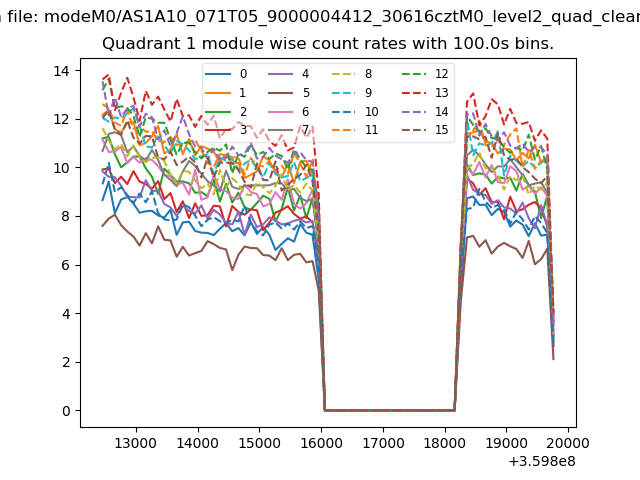
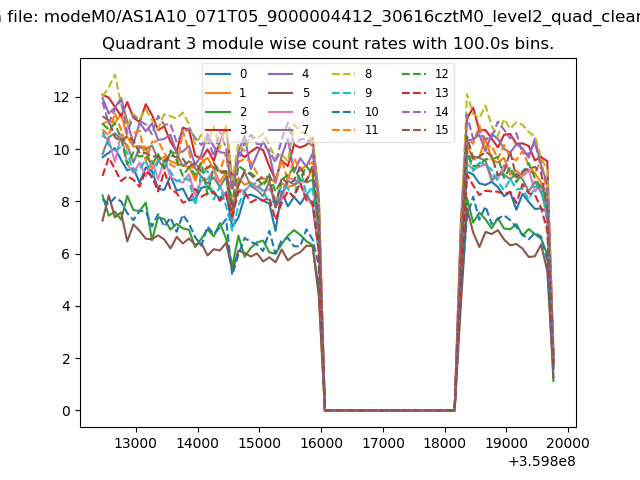
| Module-wise count rates for Quadrant A Data is divided into 100 sec bins |
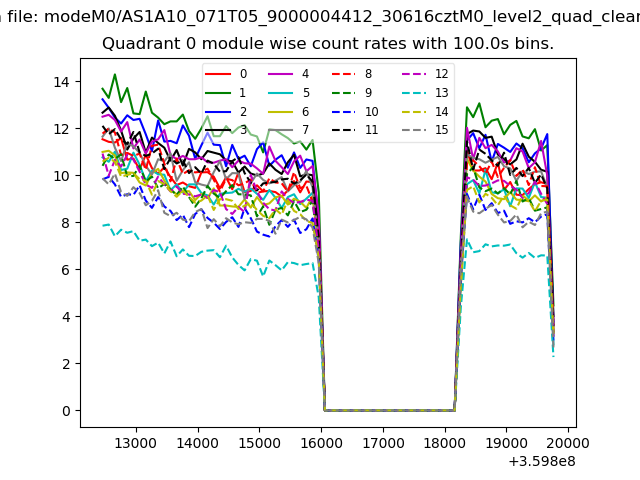 |
 |
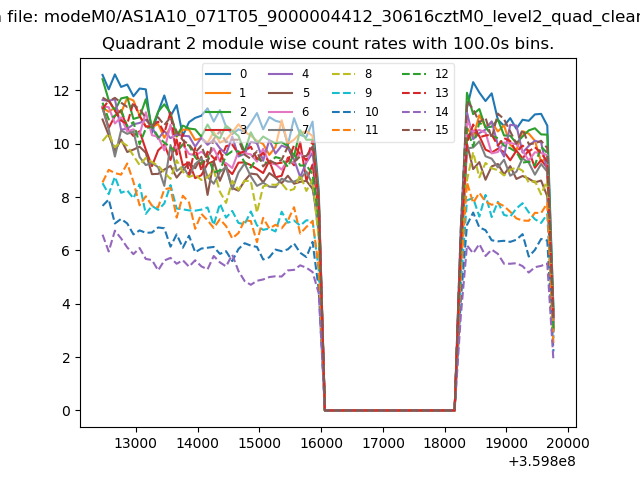
| Module-wise count rates for Quadrant B Data is divided into 100 sec bins |
 |
 |
| Module-wise count rates for Quadrant C Data is divided into 100 sec bins |
 |
 |
| Module-wise count rates for Quadrant D Data is divided into 100 sec bins |
 |
 |
| Parameter | Plot |
|---|---|
| CZT HV Monitor | 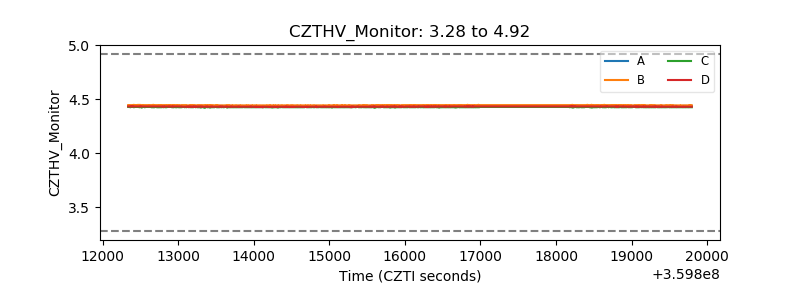 |
| D_VDD | 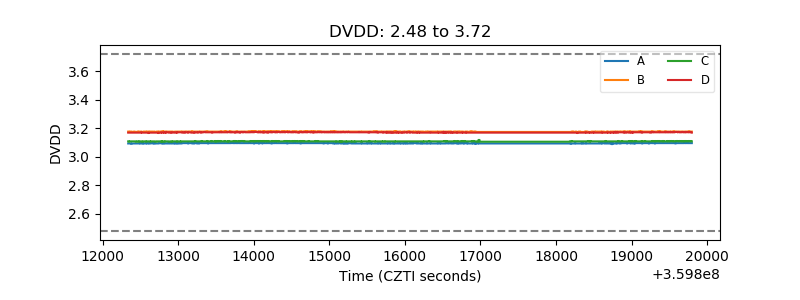 |
| Temperature 1 |  |
| Veto HV Monitor | 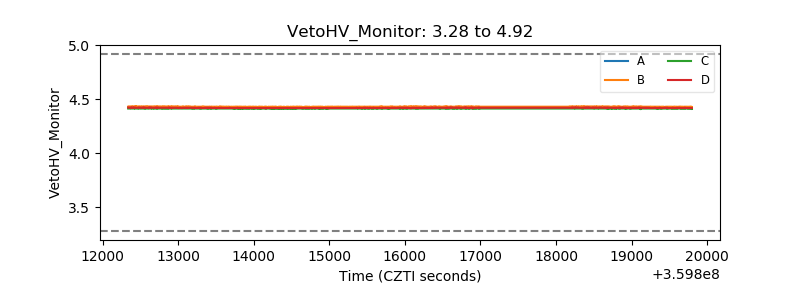 |
| Veto LLD | 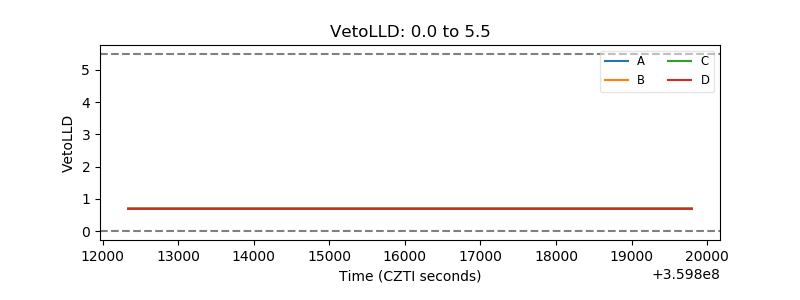 |
| Alpha Counter | 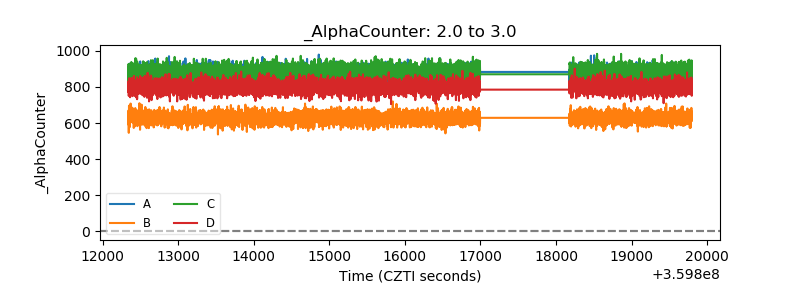 |
| _CPM_Rate | 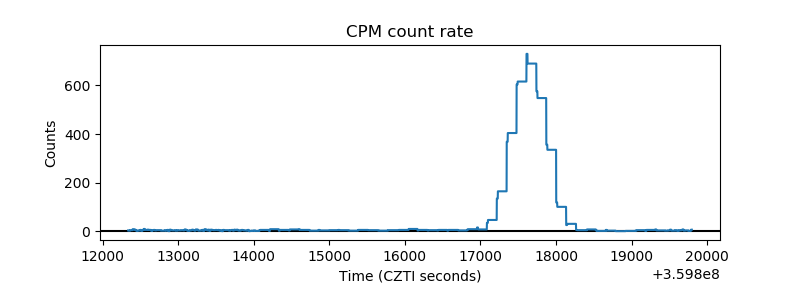 |
| CZT Counter | 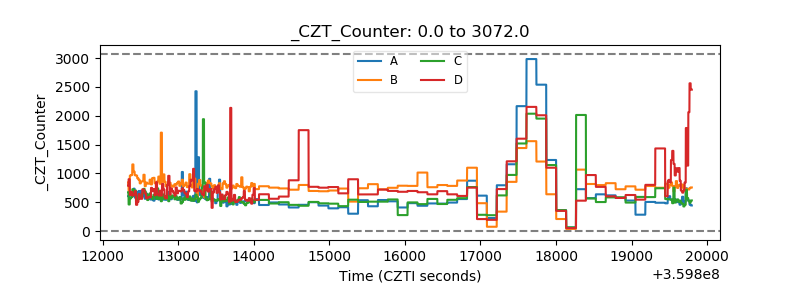 |
| +2.5 Volts monitor |  |
| +5 Volts monitor |  |
| _ROLL_ROT | 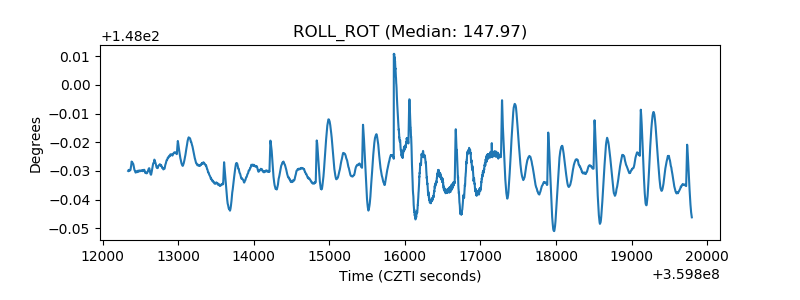 |
| _Roll_DEC | 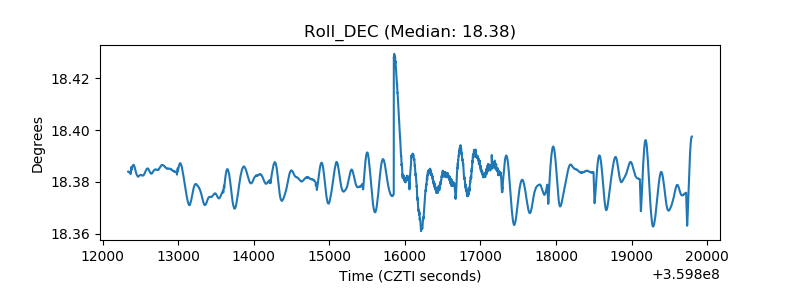 |
| _Roll_RA | 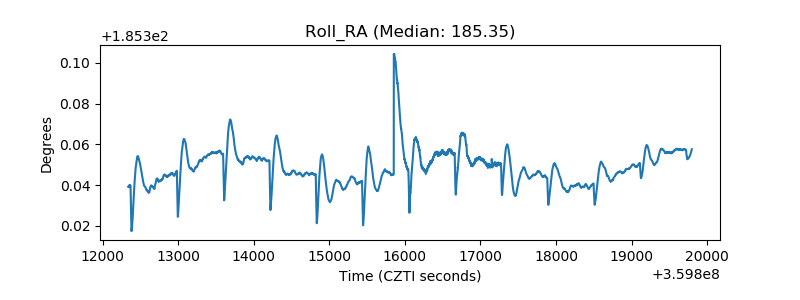 |
| Veto Counter | 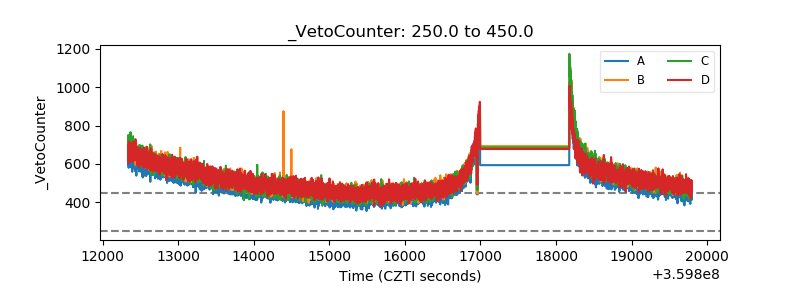 |