| Param | Original file | Final file |
|---|---|---|
| Filename | modeM0/AS1A10_071T05_9000004412_30617cztM0_level2.evt | modeM0/AS1A10_071T05_9000004412_30617cztM0_level2_quad_clean.evt |
| Size (bytes) | 608,448,960 | 109,696,320 |
| Size | 580.3 MB | 104.6 MB |
| Events in quadrant A | 3,492,391 | 742,500 |
| Events in quadrant B | 5,228,656 | 734,954 |
| Events in quadrant C | 3,583,618 | 698,198 |
| Events in quadrant D | 5,669,317 | 679,537 |
| Mode M0 | |||
|---|---|---|---|
| Quadrant | BADHDUFLAG | Total packets | Discarded packets |
| A | 0 | 14457 | 1 |
| B | 0 | 20439 | 1 |
| C | 0 | 14649 | 1 |
| D | 0 | 21679 | 1 |
| Mode M9 | |||
|---|---|---|---|
| Quadrant | BADHDUFLAG | Total packets | Discarded packets |
| A | 0 | 9 | 0 |
| B | 0 | 9 | 0 |
| C | 0 | 9 | 0 |
| D | 0 | 9 | 0 |
| Mode SS | |||
|---|---|---|---|
| Quadrant | BADHDUFLAG | Total packets | Discarded packets |
| A | 0 | 136 | 0 |
| B | 0 | 136 | 0 |
| C | 0 | 136 | 0 |
| D | 0 | 136 | 0 |
| Quadrant | Total seconds | Saturated seconds | Saturation percentage |
|---|---|---|---|
| A | 6699 | 120 | 1.791312% |
| B | 6700 | 182 | 2.716418% |
| C | 6700 | 206 | 3.074627% |
| D | 6700 | 234 | 3.492537% |
Noise dominated data is calculated using 1-second bins in cleaned event files. If a bin has >2000 counts, and if more than 50% of those come from <1% of pixels, then it is considered to be noise-dominated and hence unusable.
| Quadrant | # 1 sec bins | Bins with >0 counts | Bins with >2000 counts | High rate bins dominated by noise | Noise dominated (total time) | Noise dominated (detector-on time) | Marked lightcurve |
|---|---|---|---|---|---|---|---|
| A | 7629 | 6700 | 0 | 0 | 0.00% | 0.00% | 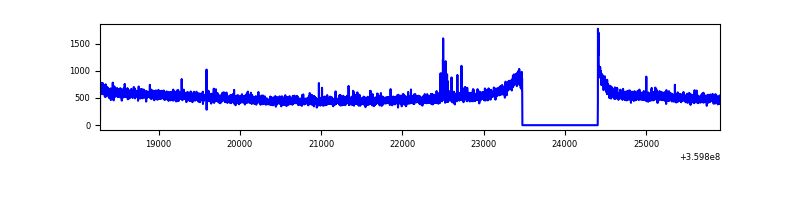 |
| B | 7630 | 6701 | 2 | 2 | 0.03% | 0.03% | 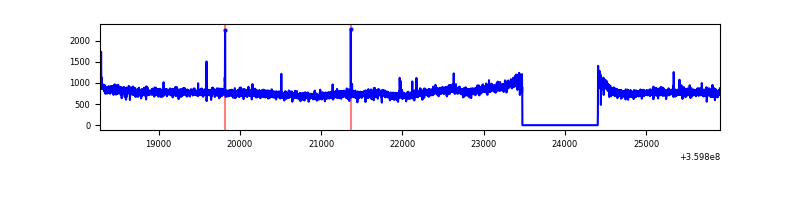 |
| C | 7630 | 6701 | 25 | 25 | 0.33% | 0.37% | 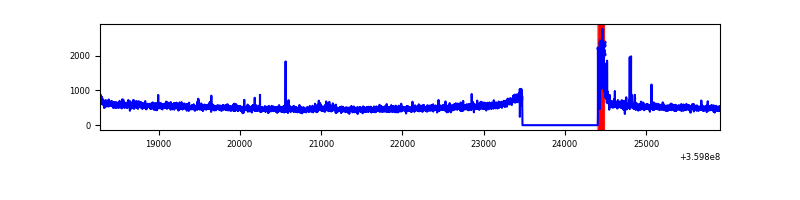 |
| D | 7630 | 6701 | 128 | 128 | 1.68% | 1.91% | 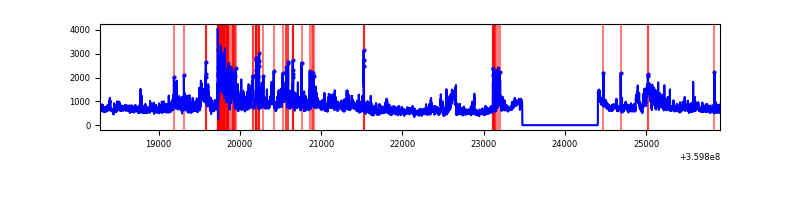 |
Top three noisy pixels from each quadrant. If the there are fewer than three noisy pixels in the level2.evt file, extra rows are filled as -1
| Pixel properties | Quadrant properties | ||||||
|---|---|---|---|---|---|---|---|
| Quadrant | DetID | PixID | Counts | Sigma | Mean | Median | Sigma |
| A | 0 | 13 | 29779 | 161.37 | 895 | 880 | 179.1 |
| A | 13 | 254 | 12262 | 63.55 | 895 | 880 | 179.1 |
| A | 8 | 192 | 11061 | 56.85 | 895 | 880 | 179.1 |
| B | 6 | 159 | 1782244 | 10690.37 | 870 | 851 | 166.6 |
| B | 12 | 111 | 19966 | 114.71 | 870 | 851 | 166.6 |
| B | 11 | 111 | 18515 | 106.0 | 870 | 851 | 166.6 |
| C | 0 | 10 | 135881 | 687.35 | 837 | 844 | 196.5 |
| C | 14 | 238 | 135782 | 686.85 | 837 | 844 | 196.5 |
| C | 3 | 233 | 27084 | 133.56 | 837 | 844 | 196.5 |
| D | 8 | 195 | 1447407 | 7051.47 | 860 | 840 | 205.1 |
| D | 1 | 52 | 381918 | 1857.61 | 860 | 840 | 205.1 |
| D | 2 | 250 | 301078 | 1463.55 | 860 | 840 | 205.1 |
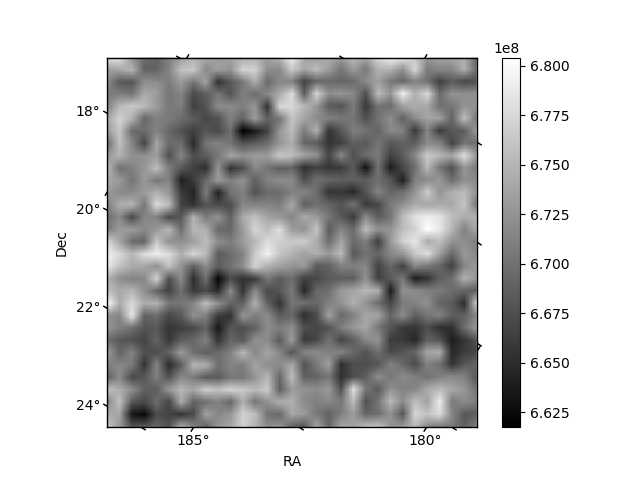
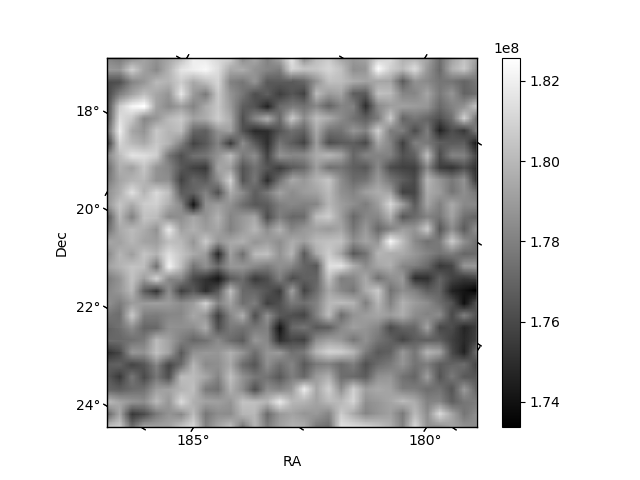
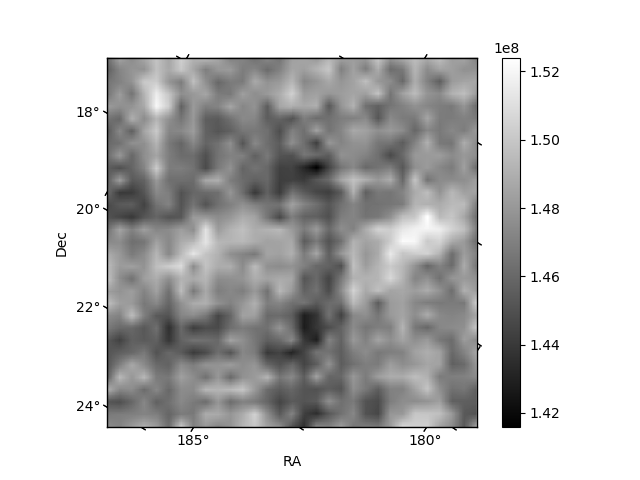
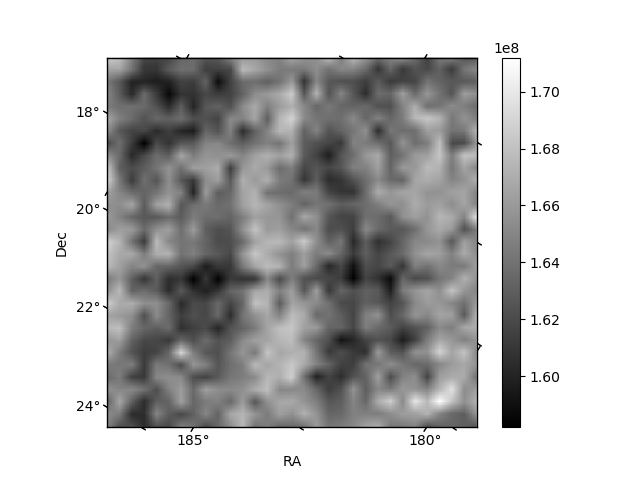
Histogram calculated using DETX and DETY for each event in the final _common_clean file
| Quadrant A | 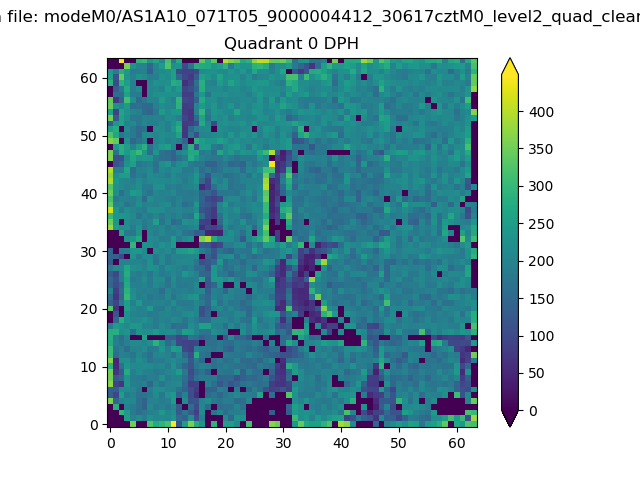 |
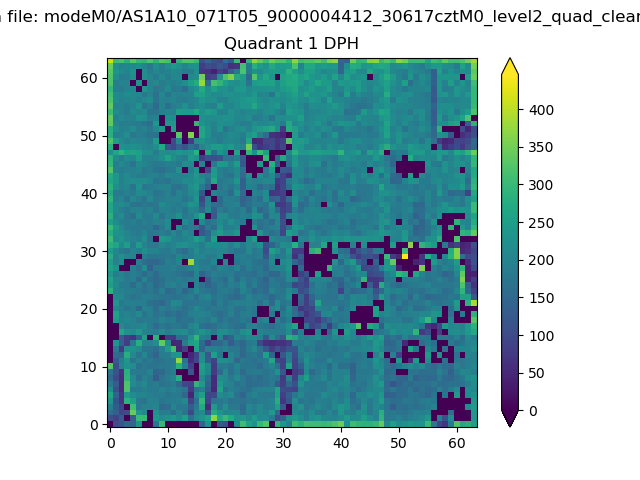 |
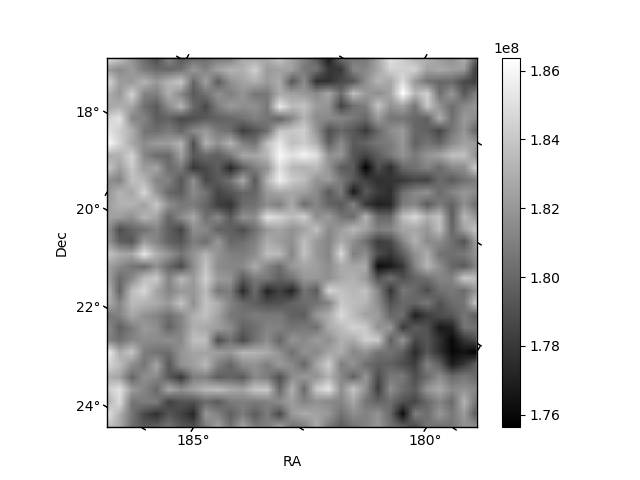
Quadrant B |
|---|---|---|---|
| Quadrant D | 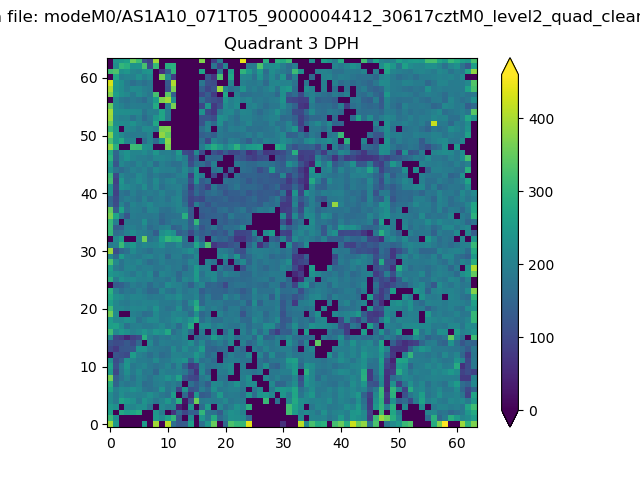 |
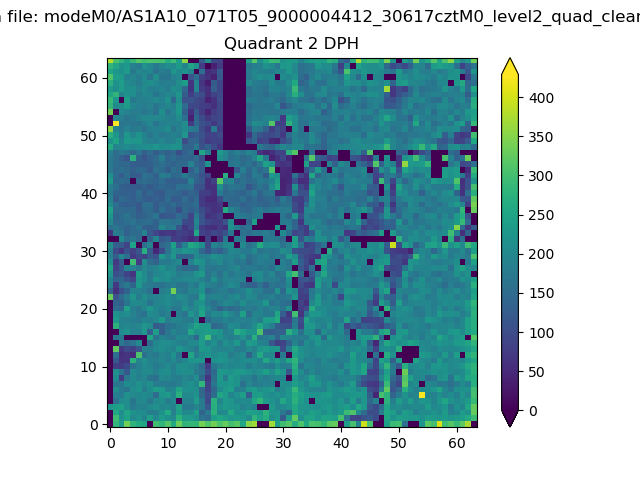 |
Quadrant C |
| Plot type | Count rate plots | Images |
|---|---|---|
| Comparison with Poisson distribution Blue bars denote a histogram of data divided into 1 sec bins. Red curve is a Poisson curve with rate = median count rate of data. |
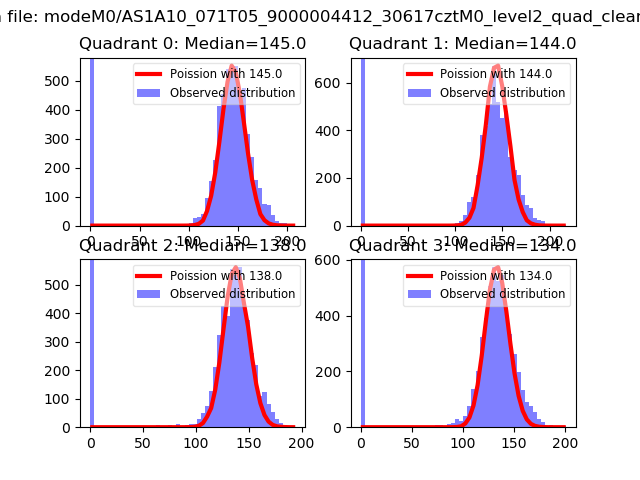 |
 |
| Quadrant-wise count rates Data is divided into 100 sec bins |
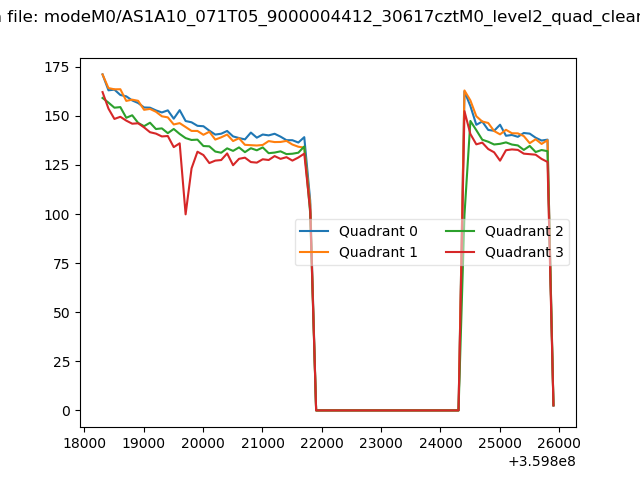 |
|
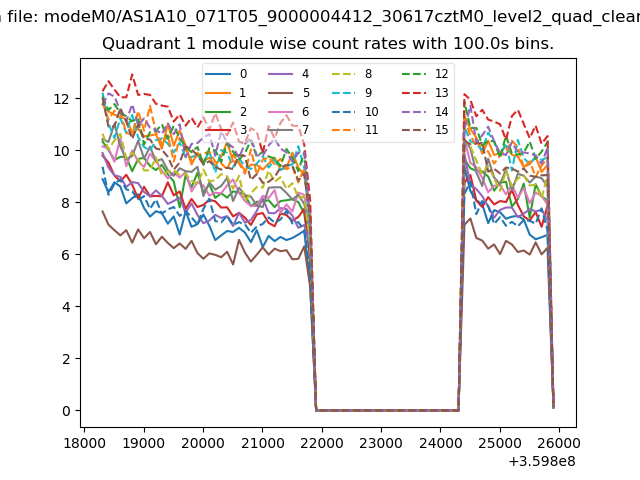
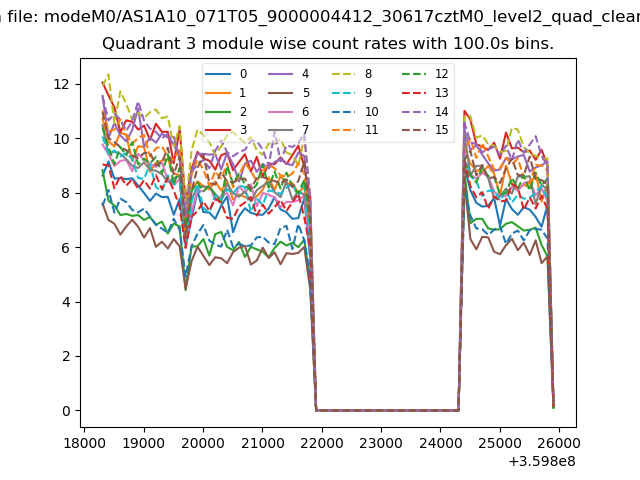
| Module-wise count rates for Quadrant A Data is divided into 100 sec bins |
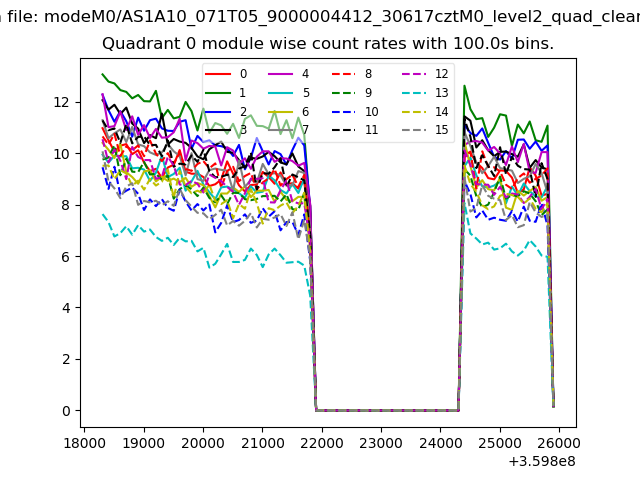 |
 |
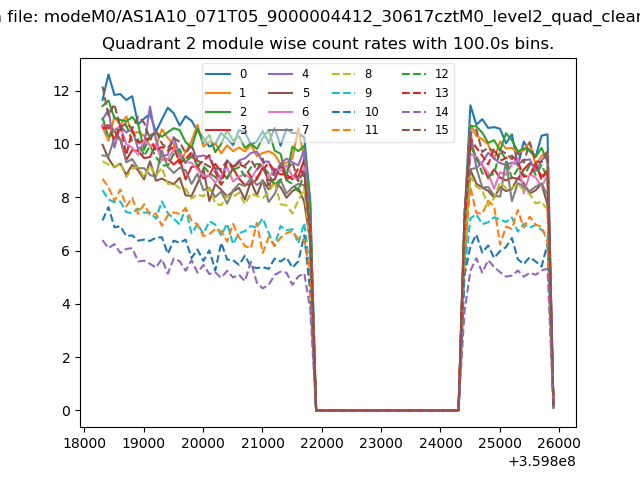
| Module-wise count rates for Quadrant B Data is divided into 100 sec bins |
 |
 |
| Module-wise count rates for Quadrant C Data is divided into 100 sec bins |
 |
 |
| Module-wise count rates for Quadrant D Data is divided into 100 sec bins |
 |
 |
| Parameter | Plot |
|---|---|
| CZT HV Monitor | 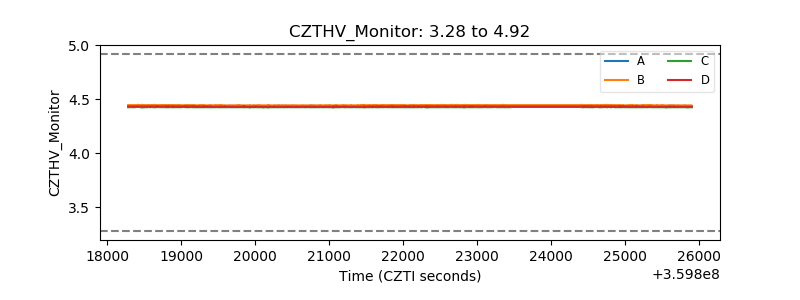 |
| D_VDD | 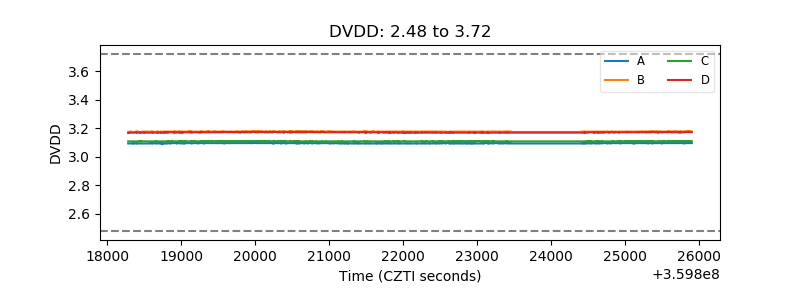 |
| Temperature 1 | 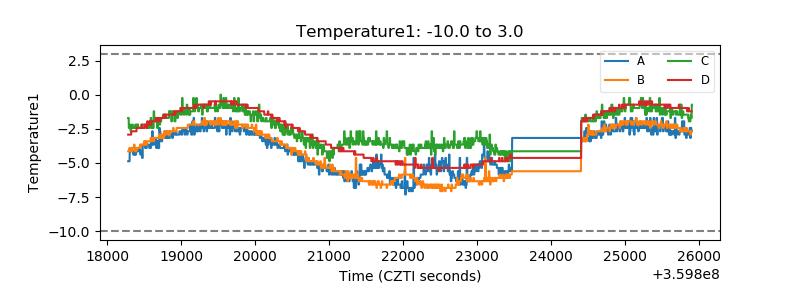 |
| Veto HV Monitor | 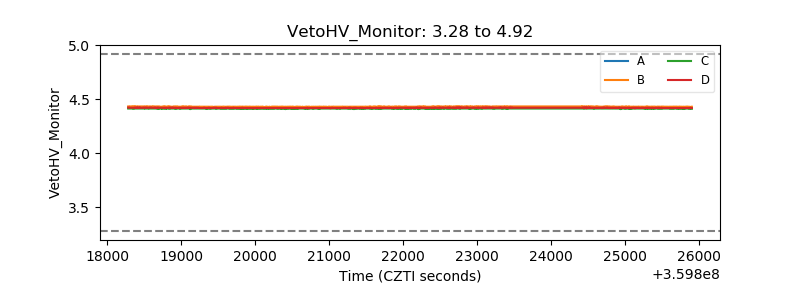 |
| Veto LLD |  |
| Alpha Counter | 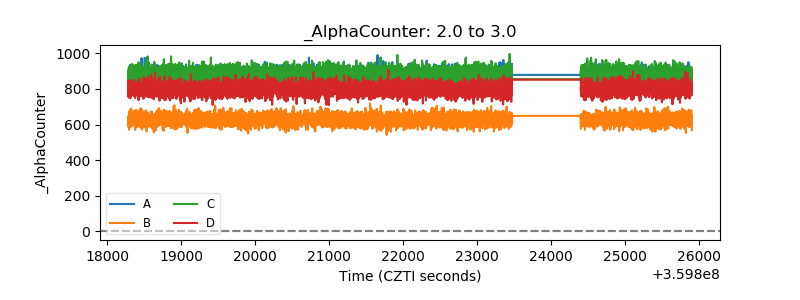 |
| _CPM_Rate | 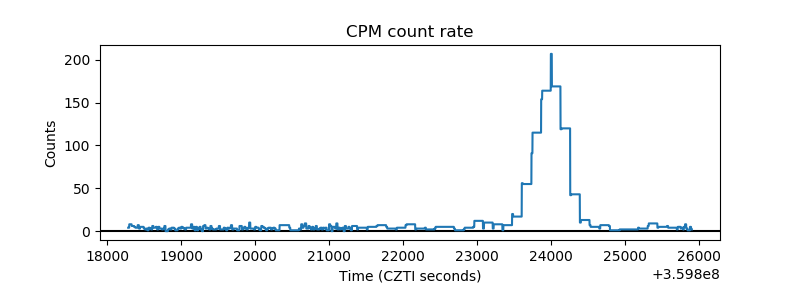 |
| CZT Counter | 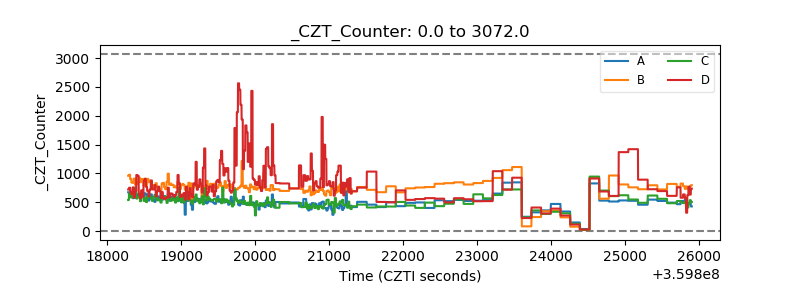 |
| +2.5 Volts monitor |  |
| +5 Volts monitor |  |
| _ROLL_ROT | 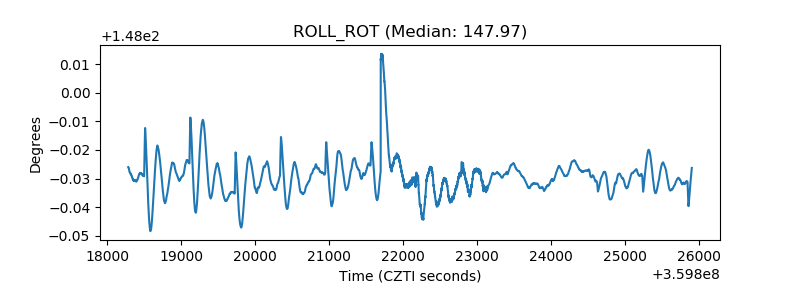 |
| _Roll_DEC | 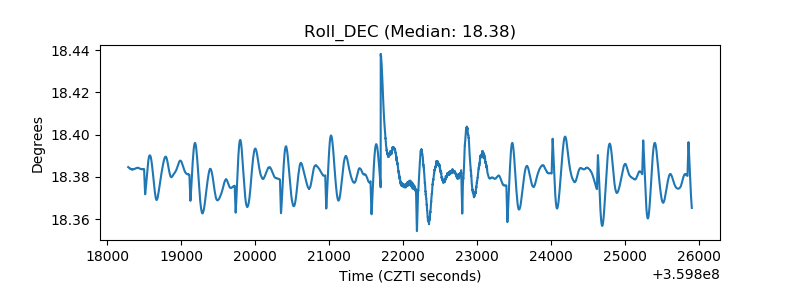 |
| _Roll_RA | 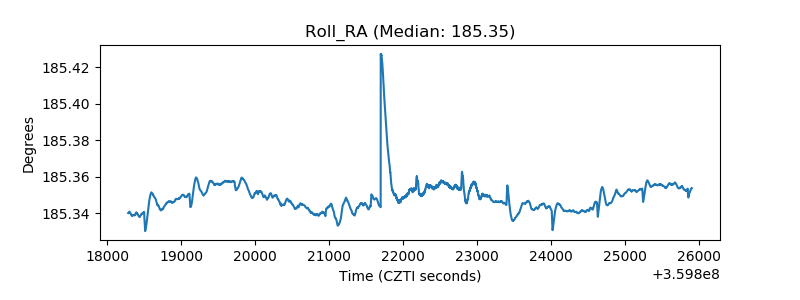 |
| Veto Counter | 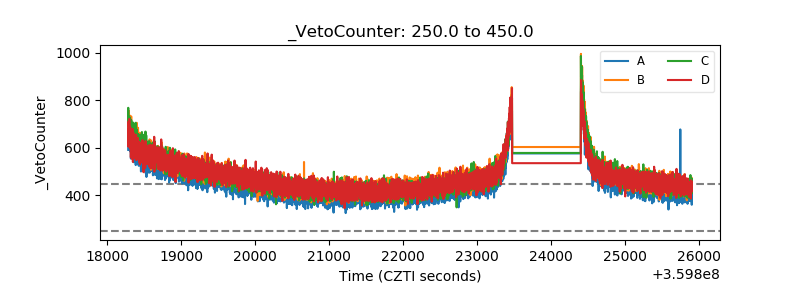 |