| Param | Original file | Final file |
|---|---|---|
| Filename | modeM0/AS1A10_071T05_9000004412_30618cztM0_level2.evt | modeM0/AS1A10_071T05_9000004412_30618cztM0_level2_quad_clean.evt |
| Size (bytes) | 578,018,880 | 94,334,400 |
| Size | 551.2 MB | 90.0 MB |
| Events in quadrant A | 3,362,639 | 615,617 |
| Events in quadrant B | 5,279,721 | 607,565 |
| Events in quadrant C | 3,417,913 | 586,363 |
| Events in quadrant D | 4,986,741 | 575,265 |
| Mode M0 | |||
|---|---|---|---|
| Quadrant | BADHDUFLAG | Total packets | Discarded packets |
| A | 0 | 14246 | 1 |
| B | 0 | 20612 | 1 |
| C | 0 | 14303 | 1 |
| D | 0 | 19530 | 1 |
| Mode M9 | |||
|---|---|---|---|
| Quadrant | BADHDUFLAG | Total packets | Discarded packets |
| A | 0 | 5 | 0 |
| B | 0 | 5 | 0 |
| C | 0 | 5 | 0 |
| D | 0 | 5 | 0 |
| Mode SS | |||
|---|---|---|---|
| Quadrant | BADHDUFLAG | Total packets | Discarded packets |
| A | 0 | 138 | 0 |
| B | 0 | 138 | 0 |
| C | 0 | 138 | 0 |
| D | 0 | 138 | 0 |
| Quadrant | Total seconds | Saturated seconds | Saturation percentage |
|---|---|---|---|
| A | 6770 | 107 | 1.580502% |
| B | 6770 | 196 | 2.895126% |
| C | 6770 | 157 | 2.319055% |
| D | 6770 | 94 | 1.388479% |
Noise dominated data is calculated using 1-second bins in cleaned event files. If a bin has >2000 counts, and if more than 50% of those come from <1% of pixels, then it is considered to be noise-dominated and hence unusable.
| Quadrant | # 1 sec bins | Bins with >0 counts | Bins with >2000 counts | High rate bins dominated by noise | Noise dominated (total time) | Noise dominated (detector-on time) | Marked lightcurve |
|---|---|---|---|---|---|---|---|
| A | 7250 | 6771 | 0 | 0 | 0.00% | 0.00% | 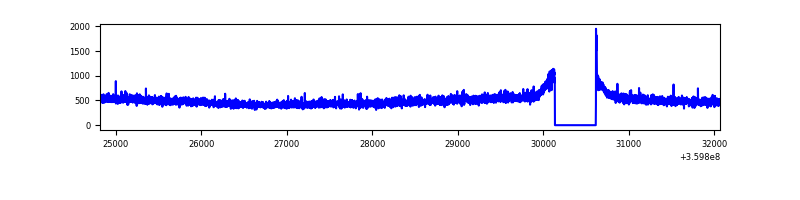 |
| B | 7250 | 6771 | 5 | 5 | 0.07% | 0.07% | 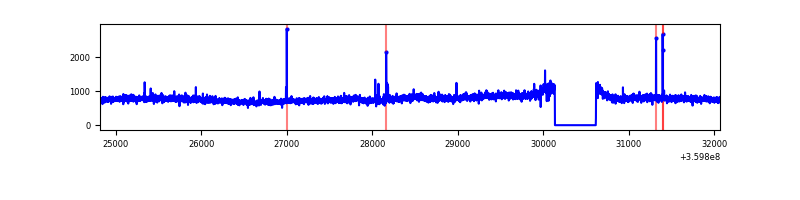 |
| C | 7250 | 6771 | 2 | 2 | 0.03% | 0.03% | 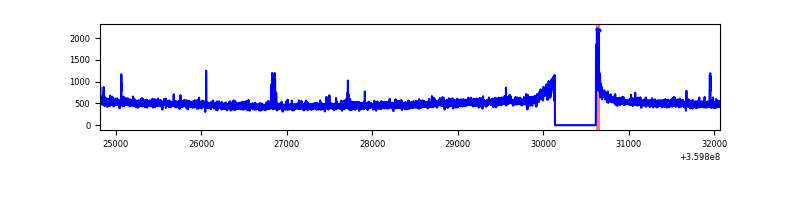 |
| D | 7250 | 6771 | 37 | 37 | 0.51% | 0.55% | 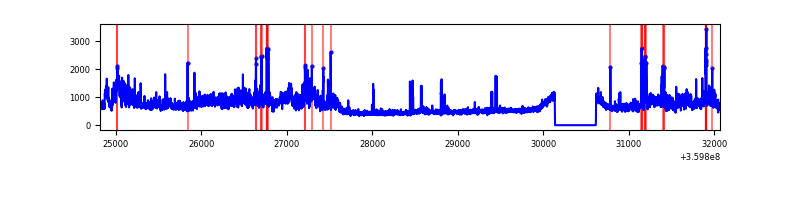 |
Top three noisy pixels from each quadrant. If the there are fewer than three noisy pixels in the level2.evt file, extra rows are filled as -1
| Pixel properties | Quadrant properties | ||||||
|---|---|---|---|---|---|---|---|
| Quadrant | DetID | PixID | Counts | Sigma | Mean | Median | Sigma |
| A | 13 | 254 | 12716 | 68.02 | 867 | 848 | 174.5 |
| A | 8 | 192 | 12496 | 66.76 | 867 | 848 | 174.5 |
| A | 3 | 137 | 8791 | 45.52 | 867 | 848 | 174.5 |
| B | 6 | 159 | 1872804 | 11309.69 | 849 | 827 | 165.5 |
| B | 0 | 229 | 33296 | 196.16 | 849 | 827 | 165.5 |
| B | 0 | 190 | 23604 | 137.61 | 849 | 827 | 165.5 |
| C | 14 | 238 | 133349 | 682.69 | 823 | 828 | 194.1 |
| C | 0 | 10 | 39856 | 201.05 | 823 | 828 | 194.1 |
| C | 2 | 114 | 16381 | 80.12 | 823 | 828 | 194.1 |
| D | 8 | 195 | 1156991 | 5722.76 | 842 | 820 | 202.0 |
| D | 12 | 227 | 279605 | 1379.92 | 842 | 820 | 202.0 |
| D | 1 | 52 | 176808 | 871.1 | 842 | 820 | 202.0 |
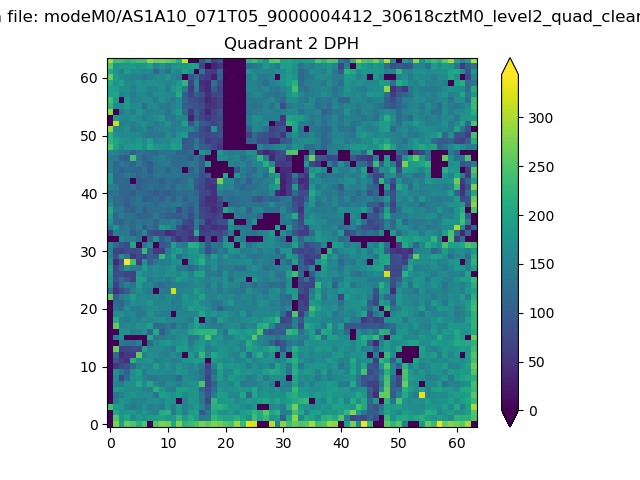
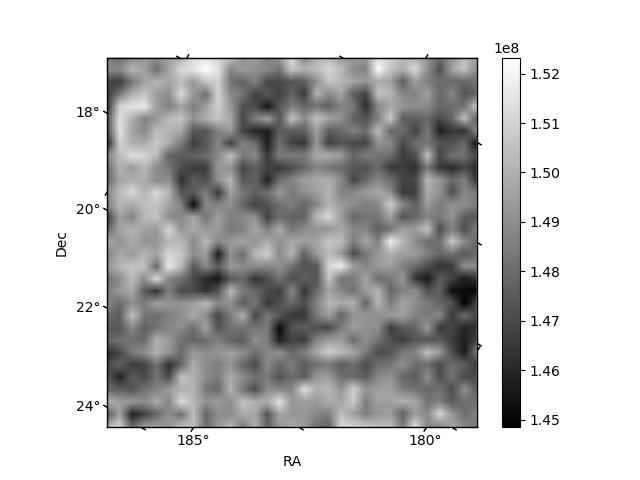
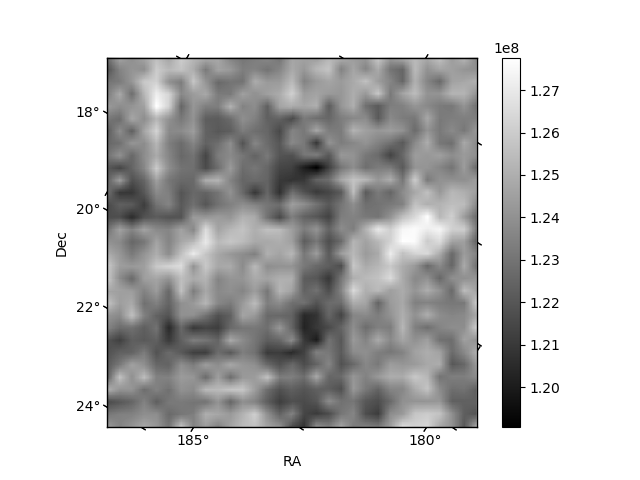
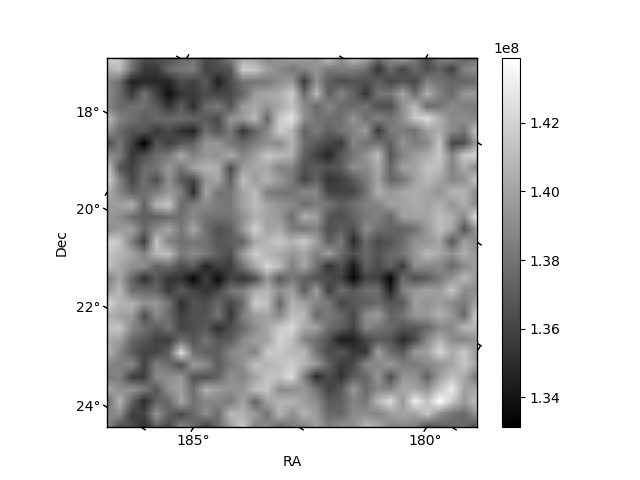
Histogram calculated using DETX and DETY for each event in the final _common_clean file
| Quadrant A | 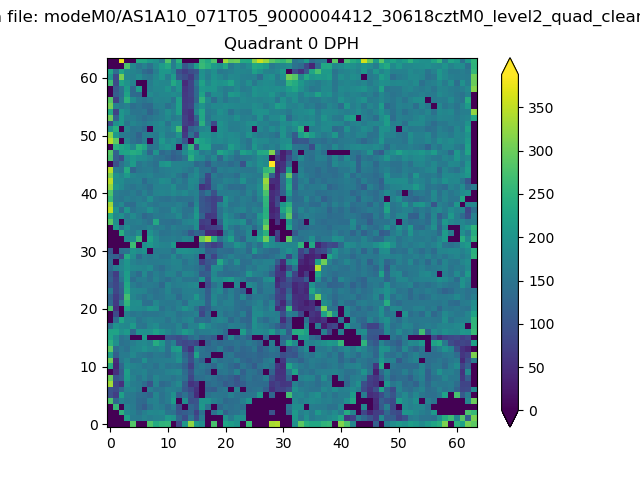 |
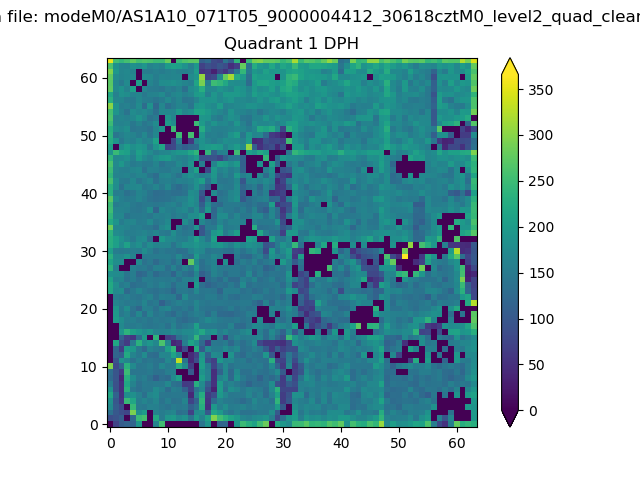 |
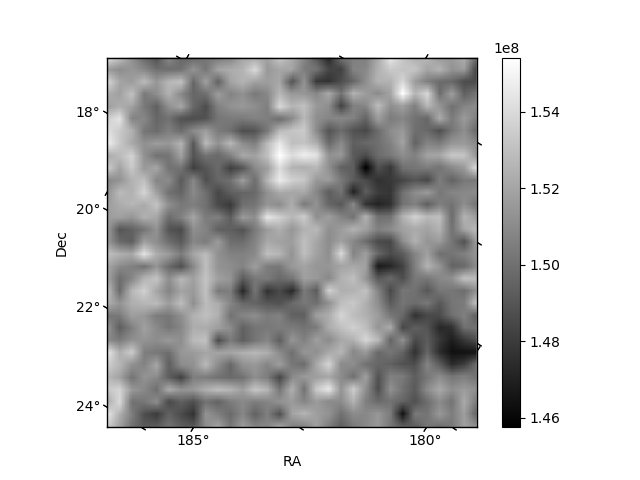
Quadrant B |
|---|---|---|---|
| Quadrant D | 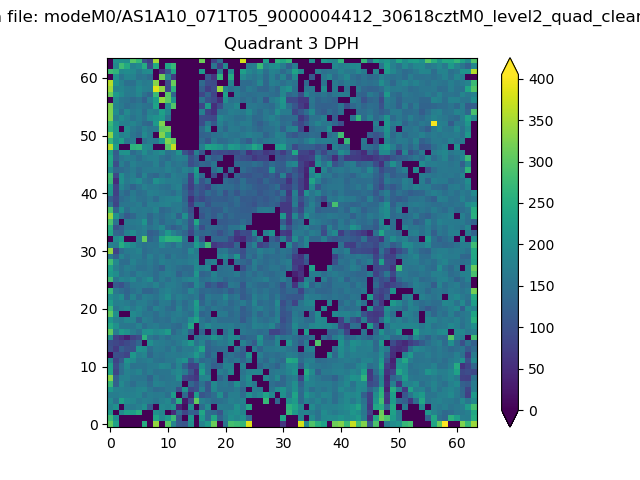 |
 |
Quadrant C |
| Plot type | Count rate plots | Images |
|---|---|---|
| Comparison with Poisson distribution Blue bars denote a histogram of data divided into 1 sec bins. Red curve is a Poisson curve with rate = median count rate of data. |
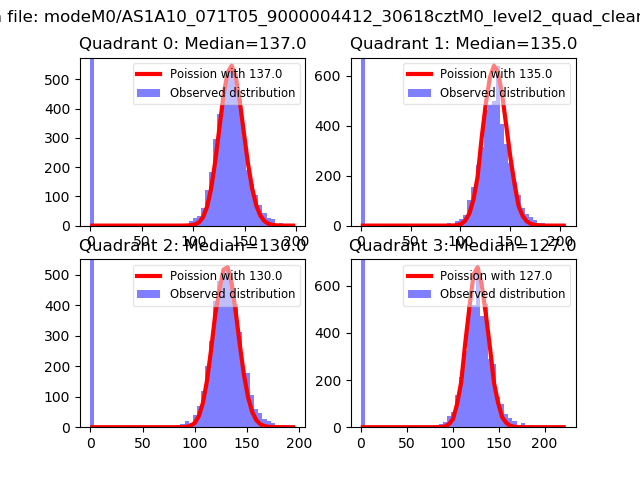 |
 |
| Quadrant-wise count rates Data is divided into 100 sec bins |
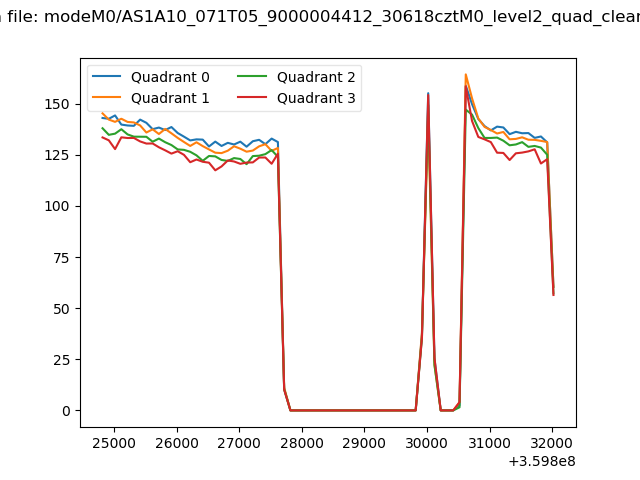 |
|
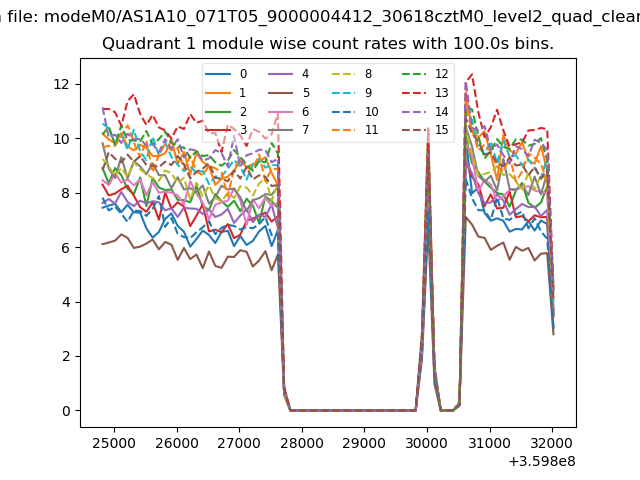
| Module-wise count rates for Quadrant A Data is divided into 100 sec bins |
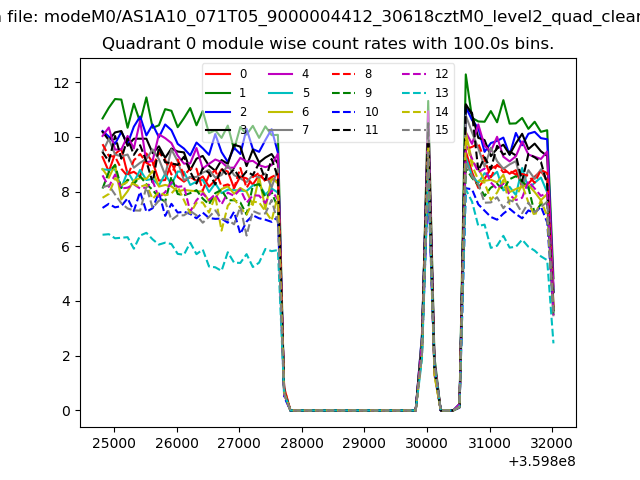 |
 |
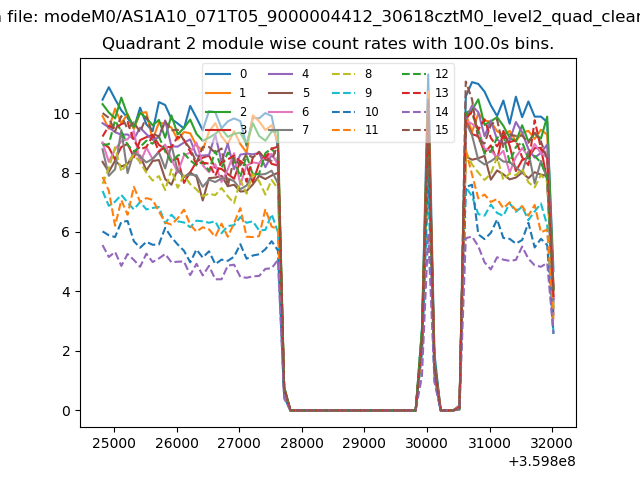
| Module-wise count rates for Quadrant B Data is divided into 100 sec bins |
 |
 |
| Module-wise count rates for Quadrant C Data is divided into 100 sec bins |
 |
 |
| Module-wise count rates for Quadrant D Data is divided into 100 sec bins |
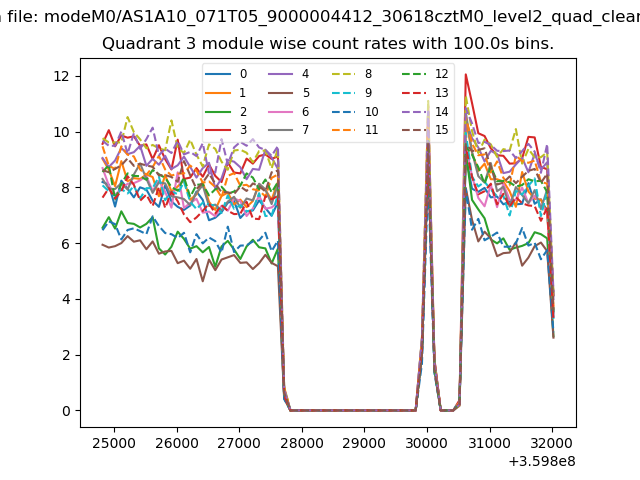 |
 |
| Parameter | Plot |
|---|---|
| CZT HV Monitor | 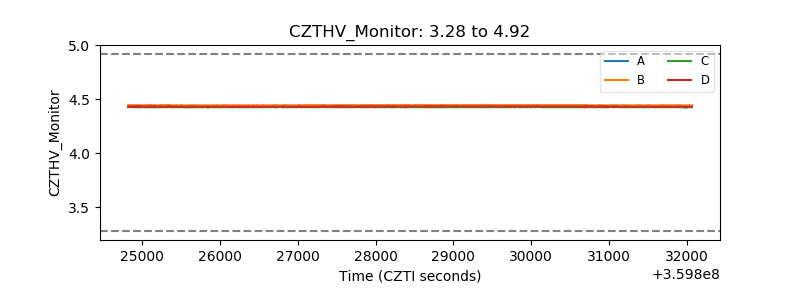 |
| D_VDD | 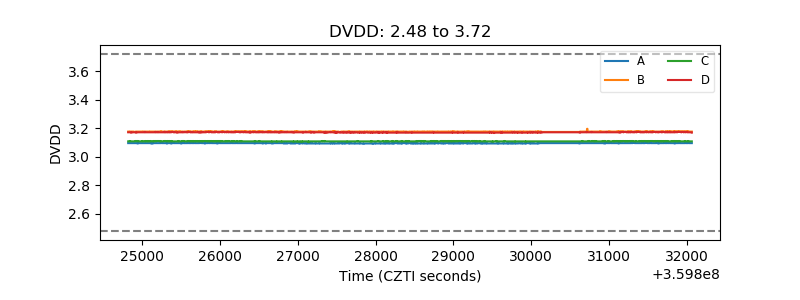 |
| Temperature 1 | 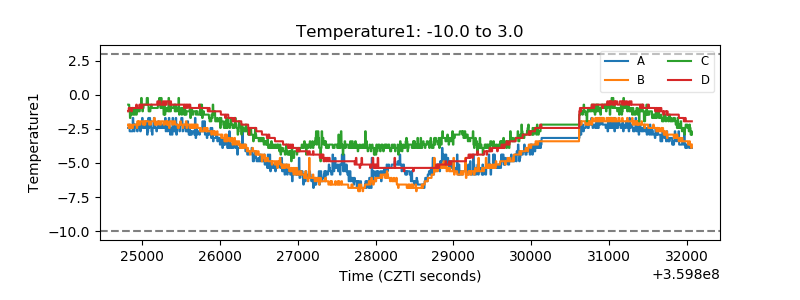 |
| Veto HV Monitor | 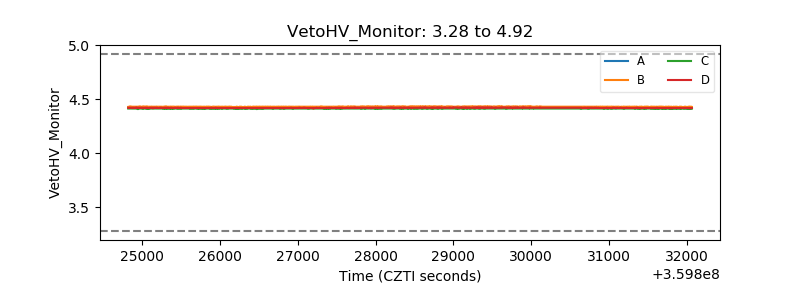 |
| Veto LLD | 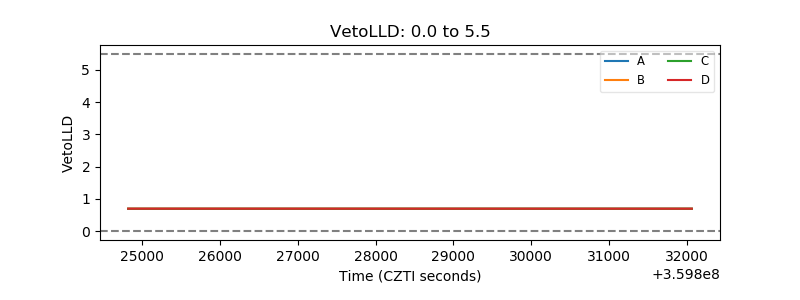 |
| Alpha Counter | 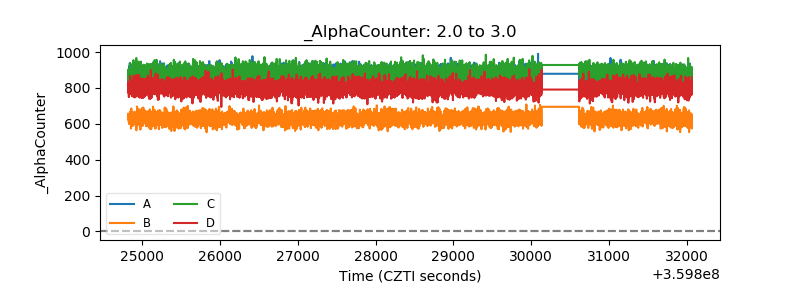 |
| _CPM_Rate | 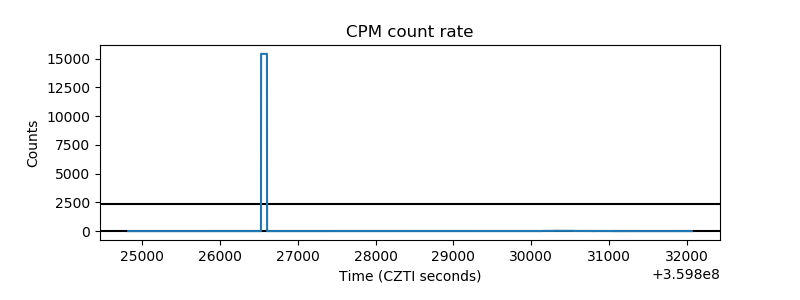 |
| CZT Counter | 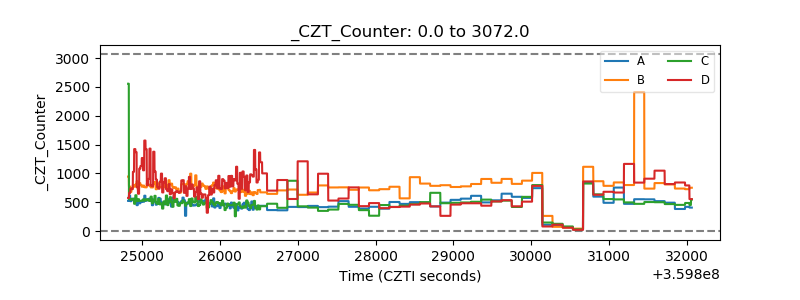 |
| +2.5 Volts monitor |  |
| +5 Volts monitor |  |
| _ROLL_ROT | 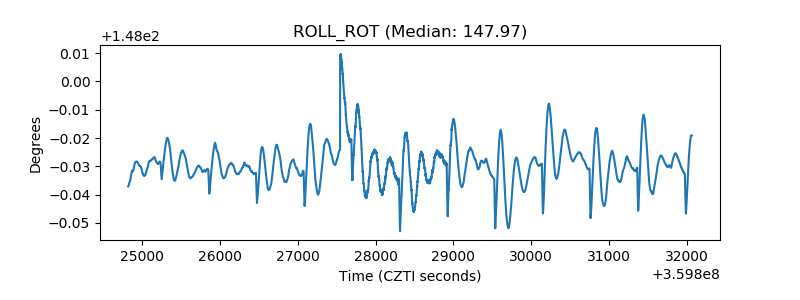 |
| _Roll_DEC | 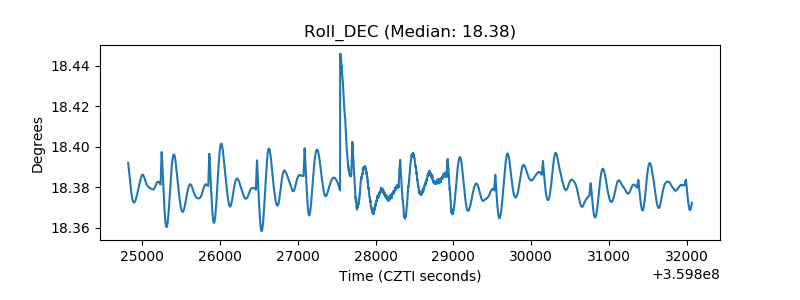 |
| _Roll_RA | 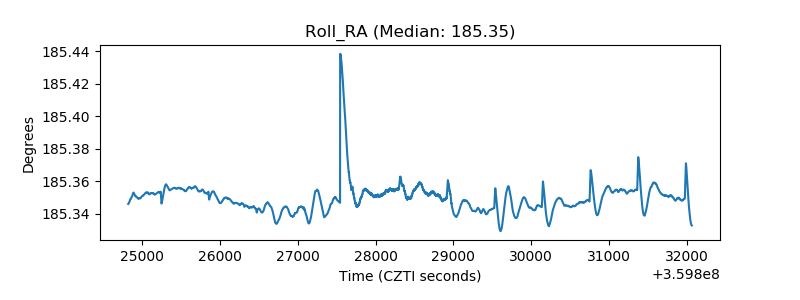 |
| Veto Counter | 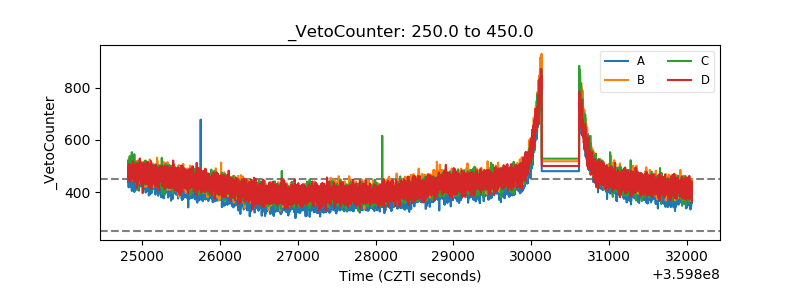 |