| Param | Original file | Final file |
|---|---|---|
| Filename | modeM0/AS1A10_071T05_9000004412_30620cztM0_level2.evt | modeM0/AS1A10_071T05_9000004412_30620cztM0_level2_quad_clean.evt |
| Size (bytes) | 1,581,805,440 | 237,407,040 |
| Size | 1.5 GB | 226.4 MB |
| Events in quadrant A | 8,949,054 | 1,533,601 |
| Events in quadrant B | 14,149,451 | 1,514,311 |
| Events in quadrant C | 9,728,862 | 1,459,890 |
| Events in quadrant D | 13,848,848 | 1,424,526 |
| Mode M0 | |||
|---|---|---|---|
| Quadrant | BADHDUFLAG | Total packets | Discarded packets |
| A | 0 | 38531 | 4 |
| B | 0 | 55704 | 4 |
| C | 0 | 40307 | 4 |
| D | 0 | 53918 | 4 |
| Mode M9 | |||
|---|---|---|---|
| Quadrant | BADHDUFLAG | Total packets | Discarded packets |
| A | 0 | 8 | 0 |
| B | 0 | 8 | 0 |
| C | 0 | 8 | 0 |
| D | 0 | 8 | 0 |
| Mode SS | |||
|---|---|---|---|
| Quadrant | BADHDUFLAG | Total packets | Discarded packets |
| A | 0 | 372 | 0 |
| B | 0 | 372 | 0 |
| C | 0 | 372 | 0 |
| D | 0 | 372 | 0 |
| Quadrant | Total seconds | Saturated seconds | Saturation percentage |
|---|---|---|---|
| A | 18250 | 231 | 1.265753% |
| B | 18251 | 478 | 2.619035% |
| C | 18251 | 468 | 2.564243% |
| D | 18251 | 322 | 1.764287% |
Noise dominated data is calculated using 1-second bins in cleaned event files. If a bin has >2000 counts, and if more than 50% of those come from <1% of pixels, then it is considered to be noise-dominated and hence unusable.
| Quadrant | # 1 sec bins | Bins with >0 counts | Bins with >2000 counts | High rate bins dominated by noise | Noise dominated (total time) | Noise dominated (detector-on time) | Marked lightcurve |
|---|---|---|---|---|---|---|---|
| A | 19091 | 18255 | 6 | 6 | 0.03% | 0.03% | 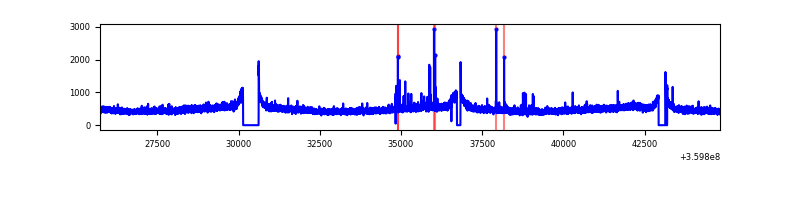 |
| B | 19092 | 18256 | 17 | 17 | 0.09% | 0.09% | 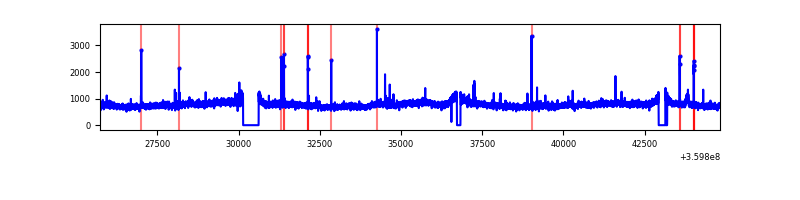 |
| C | 19092 | 18256 | 49 | 49 | 0.26% | 0.27% | 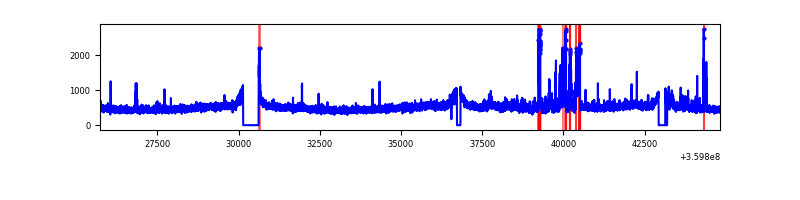 |
| D | 19092 | 18256 | 100 | 100 | 0.52% | 0.55% | 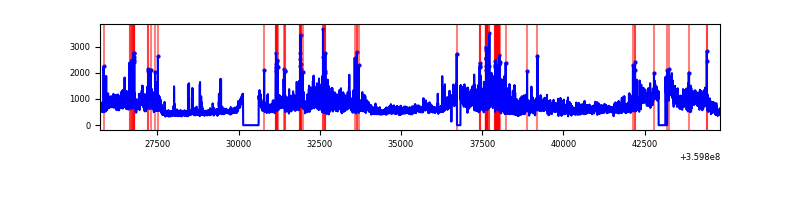 |
Top three noisy pixels from each quadrant. If the there are fewer than three noisy pixels in the level2.evt file, extra rows are filled as -1
| Pixel properties | Quadrant properties | ||||||
|---|---|---|---|---|---|---|---|
| Quadrant | DetID | PixID | Counts | Sigma | Mean | Median | Sigma |
| A | 0 | 13 | 79049 | 166.57 | 2290 | 2241 | 461.1 |
| A | 13 | 254 | 34004 | 68.88 | 2290 | 2241 | 461.1 |
| A | 8 | 192 | 33779 | 68.39 | 2290 | 2241 | 461.1 |
| B | 6 | 159 | 5049312 | 11559.19 | 2253 | 2193 | 436.6 |
| B | 0 | 229 | 81482 | 181.59 | 2253 | 2193 | 436.6 |
| B | 0 | 190 | 54989 | 120.92 | 2253 | 2193 | 436.6 |
| C | 9 | 54 | 659471 | 1273.38 | 2184 | 2200 | 516.2 |
| C | 14 | 238 | 364526 | 701.96 | 2184 | 2200 | 516.2 |
| C | 2 | 114 | 43459 | 79.93 | 2184 | 2200 | 516.2 |
| D | 8 | 195 | 3754246 | 7079.92 | 2212 | 2156 | 530.0 |
| D | 12 | 227 | 740001 | 1392.26 | 2212 | 2156 | 530.0 |
| D | 1 | 52 | 570457 | 1072.34 | 2212 | 2156 | 530.0 |
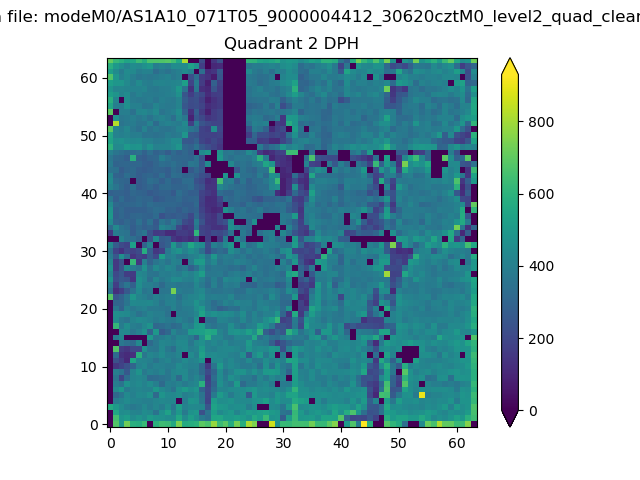
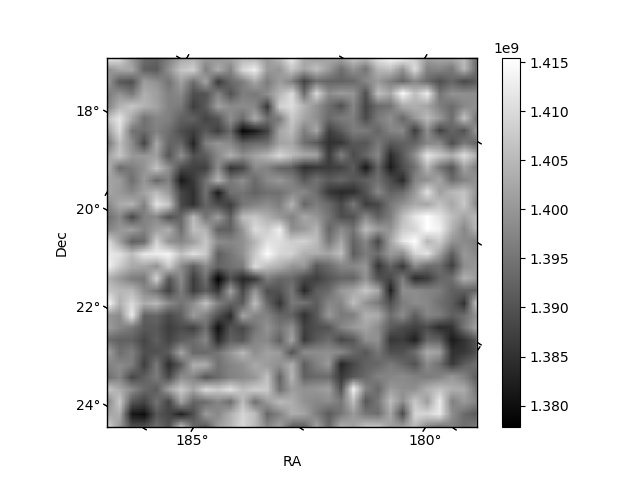
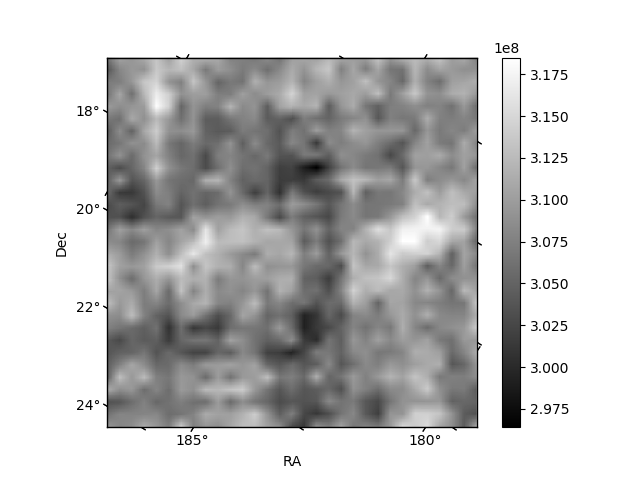
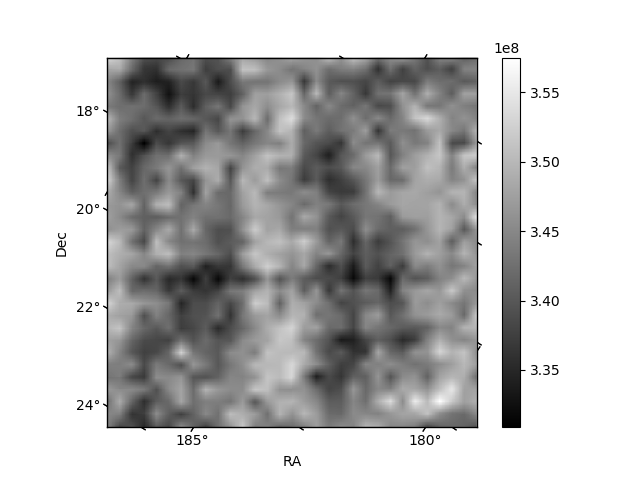
Histogram calculated using DETX and DETY for each event in the final _common_clean file
| Quadrant A | 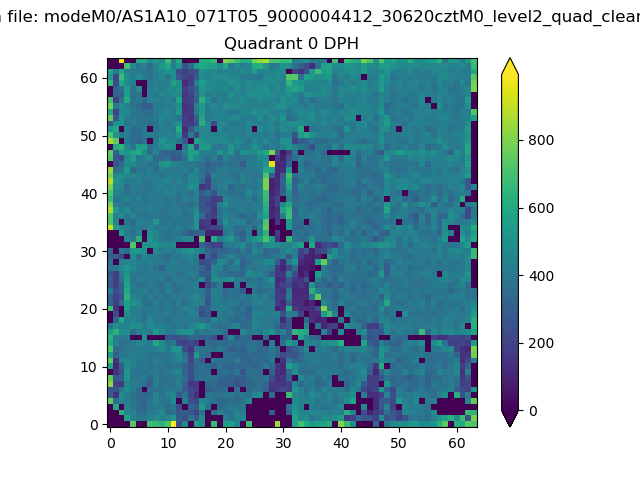 |
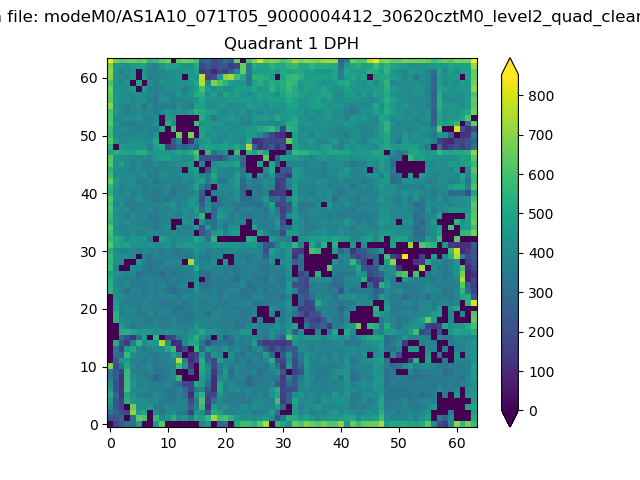 |
Quadrant B |
|---|---|---|---|
| Quadrant D | 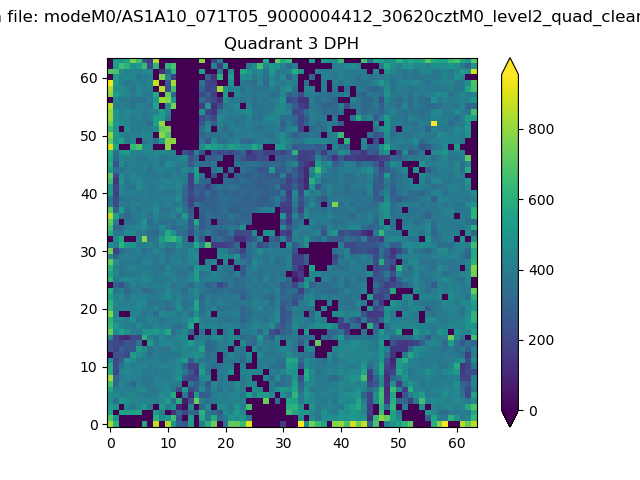 |
 |
Quadrant C |
| Plot type | Count rate plots | Images |
|---|---|---|
| Comparison with Poisson distribution Blue bars denote a histogram of data divided into 1 sec bins. Red curve is a Poisson curve with rate = median count rate of data. |
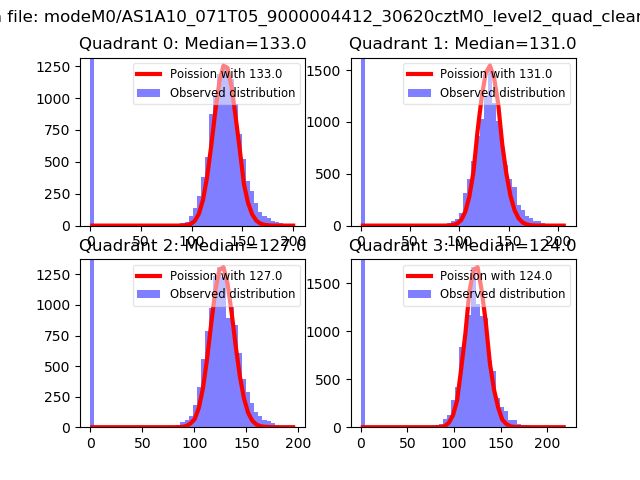 |
 |
| Quadrant-wise count rates Data is divided into 100 sec bins |
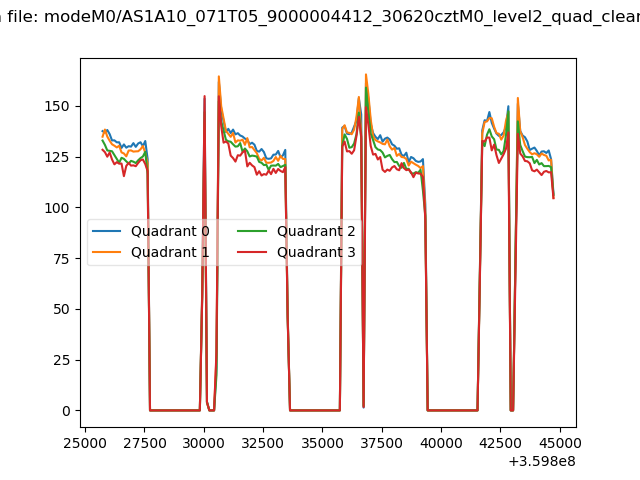 |
|
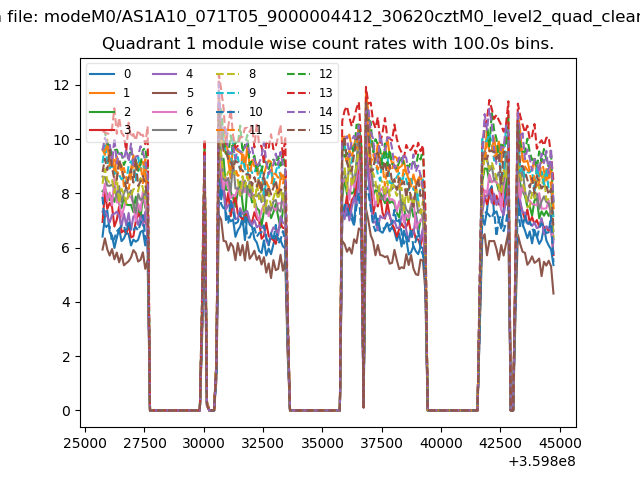
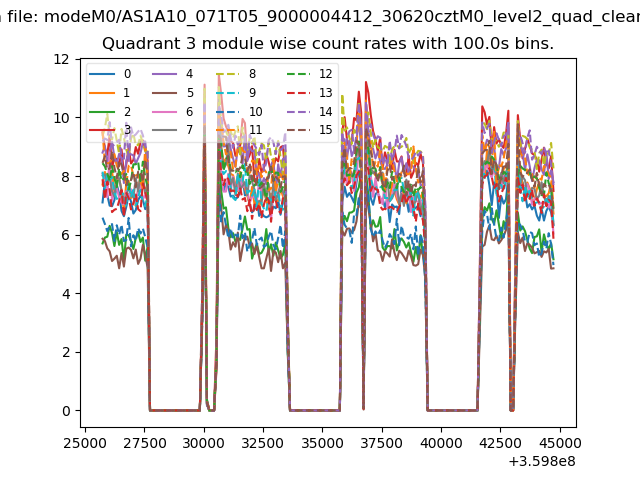
| Module-wise count rates for Quadrant A Data is divided into 100 sec bins |
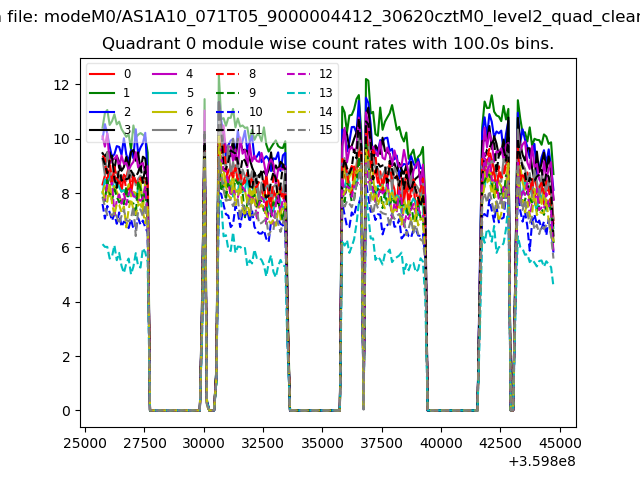 |
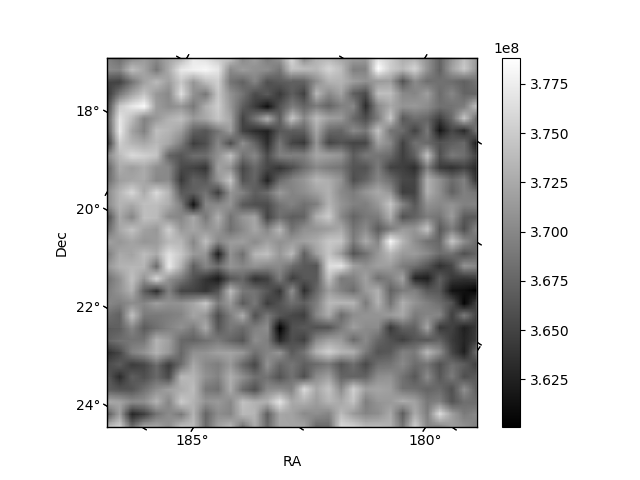 |
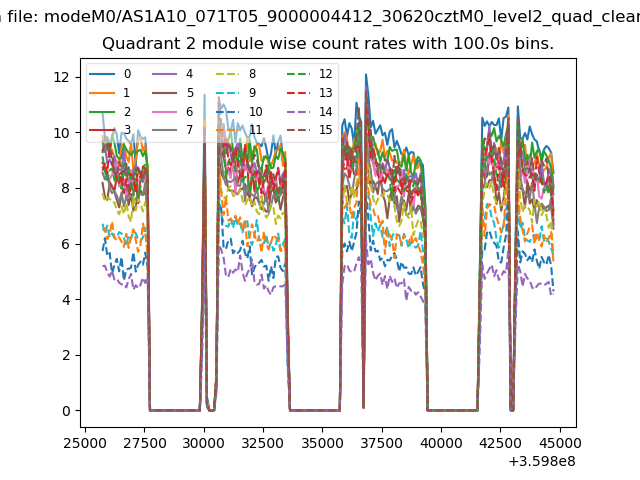
| Module-wise count rates for Quadrant B Data is divided into 100 sec bins |
 |
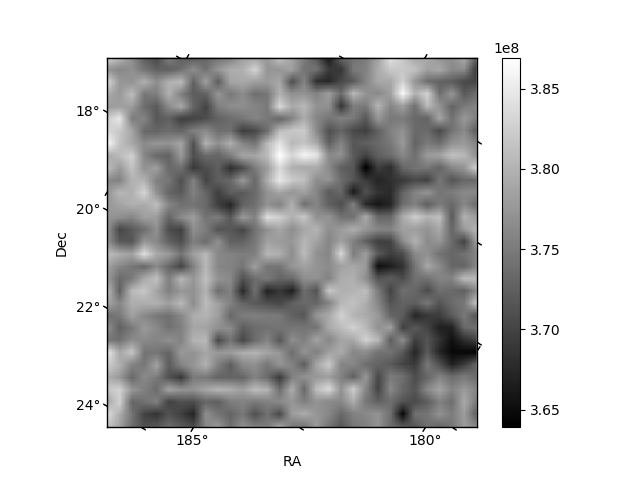 |
| Module-wise count rates for Quadrant C Data is divided into 100 sec bins |
 |
 |
| Module-wise count rates for Quadrant D Data is divided into 100 sec bins |
 |
 |
| Parameter | Plot |
|---|---|
| CZT HV Monitor | 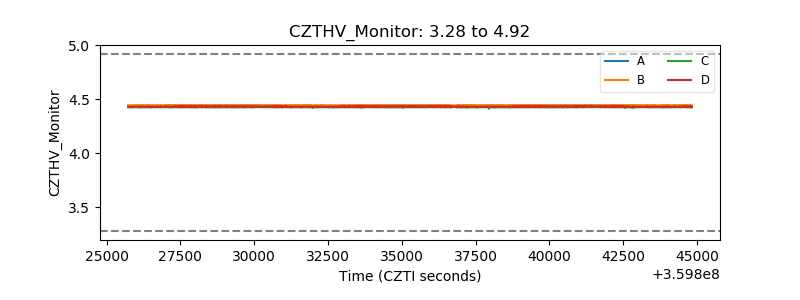 |
| D_VDD | 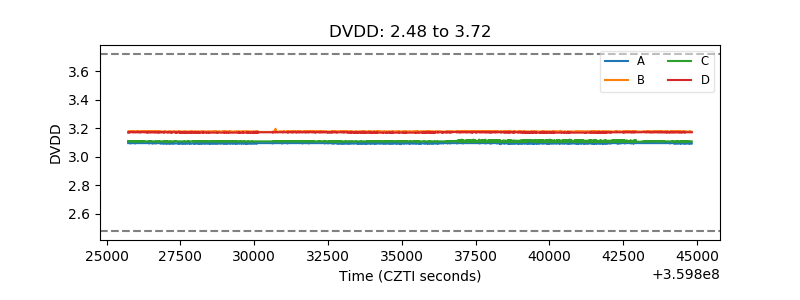 |
| Temperature 1 | 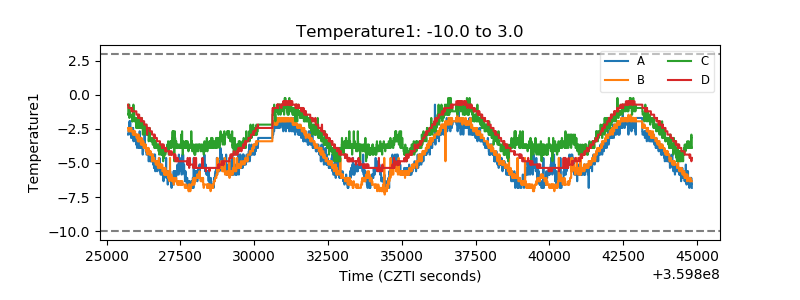 |
| Veto HV Monitor | 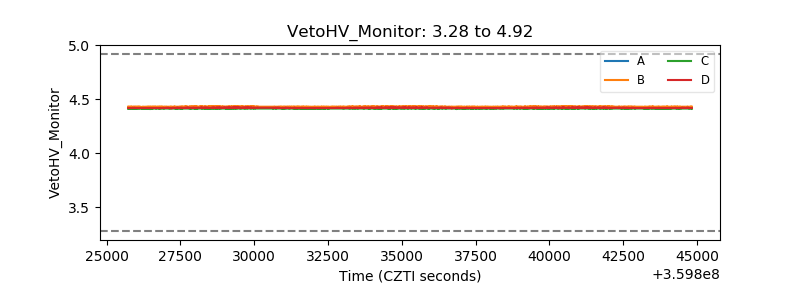 |
| Veto LLD |  |
| Alpha Counter |  |
| _CPM_Rate | 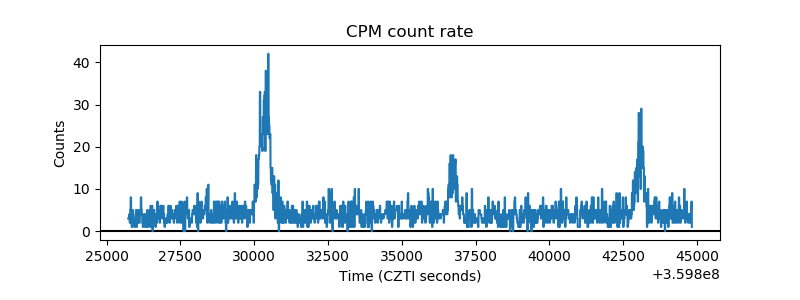 |
| CZT Counter | 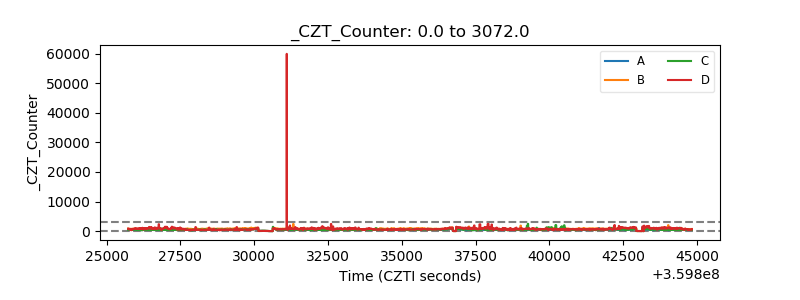 |
| +2.5 Volts monitor |  |
| +5 Volts monitor |  |
| _ROLL_ROT | 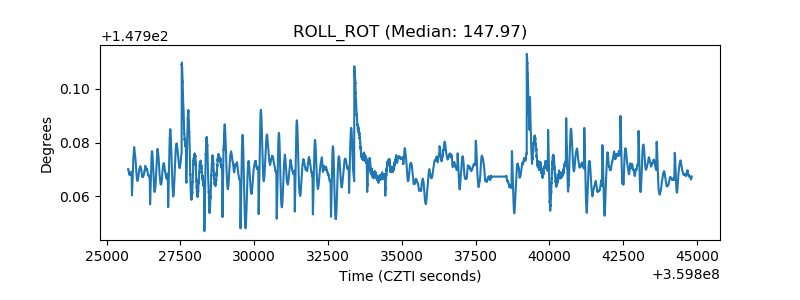 |
| _Roll_DEC | 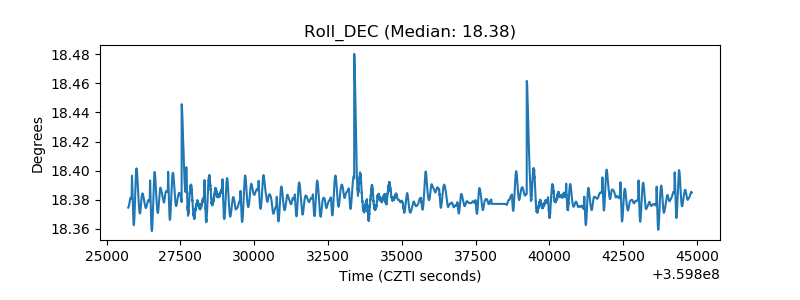 |
| _Roll_RA | 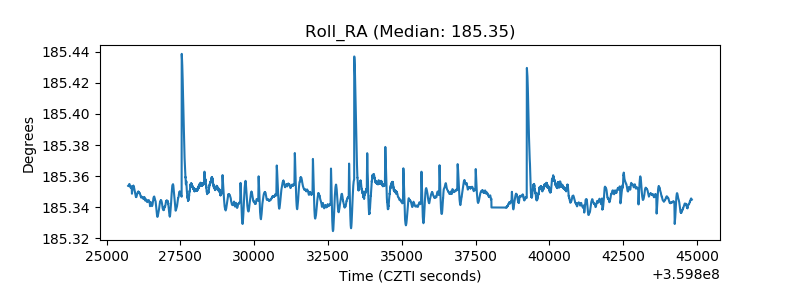 |
| Veto Counter | 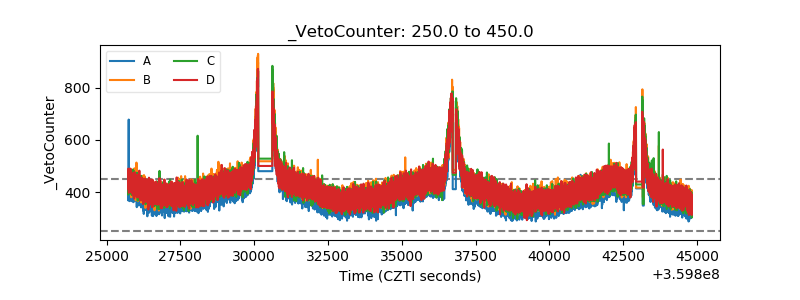 |