| Param | Original file | Final file |
|---|---|---|
| Filename | modeM0/AS1A10_071T05_9000004412_30623cztM0_level2.evt | modeM0/AS1A10_071T05_9000004412_30623cztM0_level2_quad_clean.evt |
| Size (bytes) | 1,645,706,880 | 236,338,560 |
| Size | 1.5 GB | 225.4 MB |
| Events in quadrant A | 9,250,131 | 1,508,543 |
| Events in quadrant B | 14,708,039 | 1,499,001 |
| Events in quadrant C | 10,026,669 | 1,433,238 |
| Events in quadrant D | 14,574,126 | 1,405,403 |
| Mode M0 | |||
|---|---|---|---|
| Quadrant | BADHDUFLAG | Total packets | Discarded packets |
| A | 0 | 39753 | 5 |
| B | 0 | 57951 | 5 |
| C | 0 | 41751 | 5 |
| D | 0 | 56581 | 6 |
| Mode M9 | |||
|---|---|---|---|
| Quadrant | BADHDUFLAG | Total packets | Discarded packets |
| A | 0 | 20 | 0 |
| B | 0 | 20 | 0 |
| C | 0 | 20 | 0 |
| D | 0 | 20 | 0 |
| Mode SS | |||
|---|---|---|---|
| Quadrant | BADHDUFLAG | Total packets | Discarded packets |
| A | 0 | 390 | 0 |
| B | 0 | 390 | 0 |
| C | 0 | 390 | 0 |
| D | 0 | 390 | 0 |
| Quadrant | Total seconds | Saturated seconds | Saturation percentage |
|---|---|---|---|
| A | 19032 | 148 | 0.777638% |
| B | 19033 | 275 | 1.444859% |
| C | 19033 | 554 | 2.910734% |
| D | 19032 | 357 | 1.875788% |
Noise dominated data is calculated using 1-second bins in cleaned event files. If a bin has >2000 counts, and if more than 50% of those come from <1% of pixels, then it is considered to be noise-dominated and hence unusable.
| Quadrant | # 1 sec bins | Bins with >0 counts | Bins with >2000 counts | High rate bins dominated by noise | Noise dominated (total time) | Noise dominated (detector-on time) | Marked lightcurve |
|---|---|---|---|---|---|---|---|
| A | 21137 | 19037 | 36 | 36 | 0.17% | 0.19% | 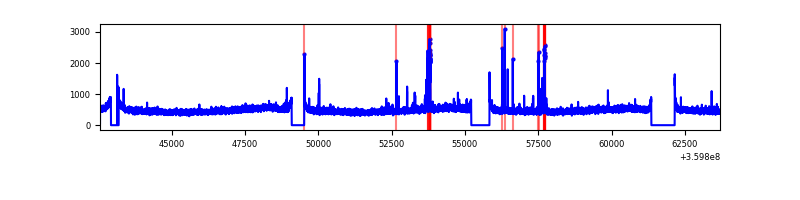 |
| B | 21138 | 19038 | 20 | 20 | 0.09% | 0.11% | 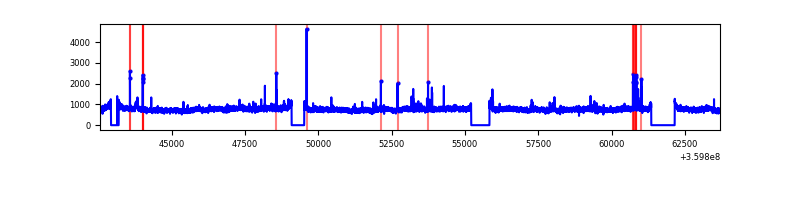 |
| C | 21138 | 19037 | 59 | 59 | 0.28% | 0.31% | 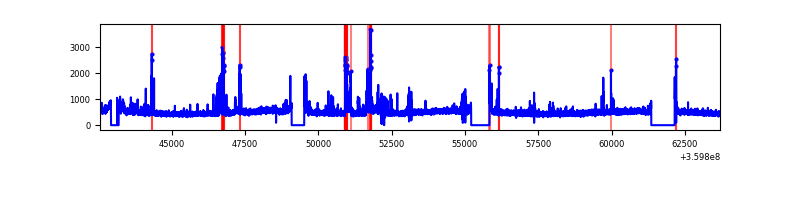 |
| D | 21137 | 19037 | 219 | 219 | 1.04% | 1.15% | 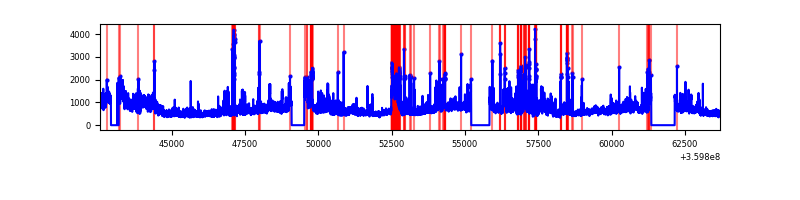 |
Top three noisy pixels from each quadrant. If the there are fewer than three noisy pixels in the level2.evt file, extra rows are filled as -1
| Pixel properties | Quadrant properties | ||||||
|---|---|---|---|---|---|---|---|
| Quadrant | DetID | PixID | Counts | Sigma | Mean | Median | Sigma |
| A | 0 | 13 | 243816 | 520.64 | 2323 | 2276 | 463.9 |
| A | 13 | 254 | 35622 | 71.88 | 2323 | 2276 | 463.9 |
| A | 8 | 192 | 29914 | 59.57 | 2323 | 2276 | 463.9 |
| B | 6 | 159 | 5346805 | 12091.35 | 2295 | 2233 | 442.0 |
| B | 0 | 229 | 109795 | 243.34 | 2295 | 2233 | 442.0 |
| B | 5 | 255 | 78520 | 172.59 | 2295 | 2233 | 442.0 |
| C | 9 | 54 | 577670 | 1107.55 | 2205 | 2221 | 519.6 |
| C | 14 | 238 | 453278 | 868.13 | 2205 | 2221 | 519.6 |
| C | 14 | 254 | 140788 | 266.7 | 2205 | 2221 | 519.6 |
| D | 8 | 195 | 4574275 | 8628.43 | 2234 | 2177 | 529.9 |
| D | 1 | 52 | 1057588 | 1991.76 | 2234 | 2177 | 529.9 |
| D | 2 | 250 | 217983 | 407.27 | 2234 | 2177 | 529.9 |
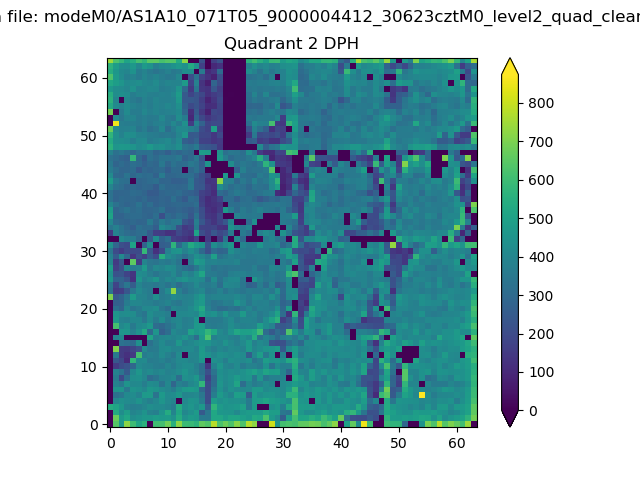
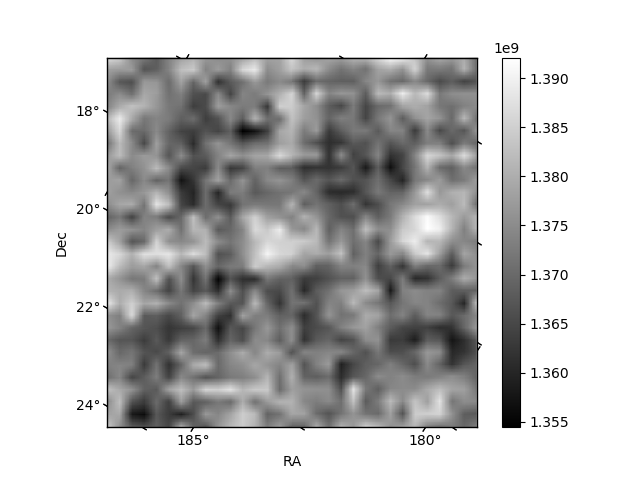
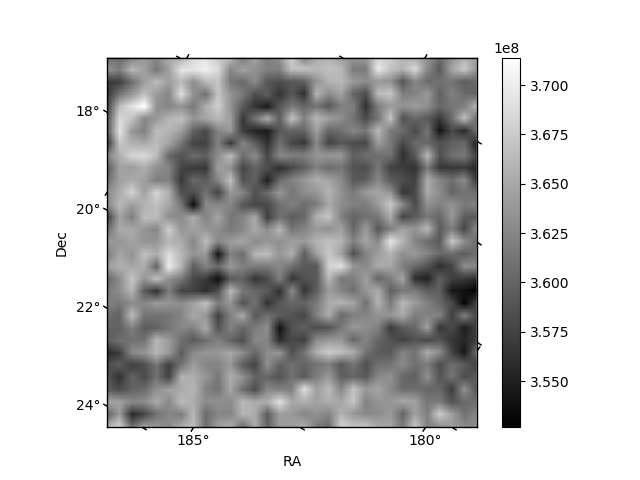
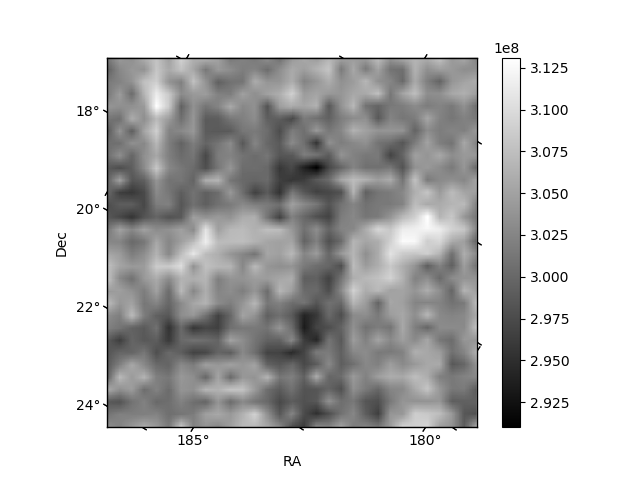
Histogram calculated using DETX and DETY for each event in the final _common_clean file
| Quadrant A | 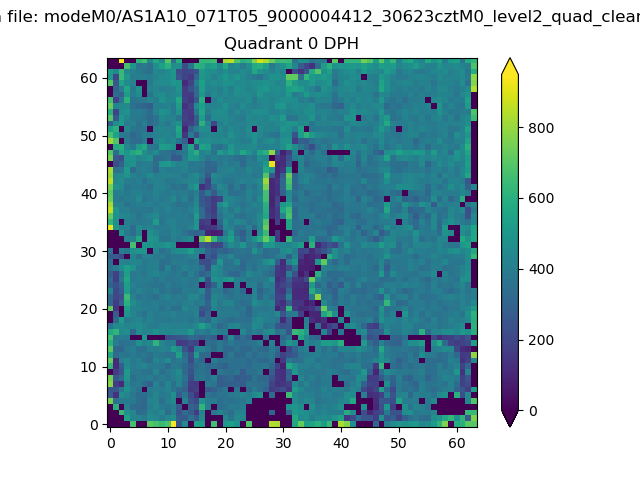 |
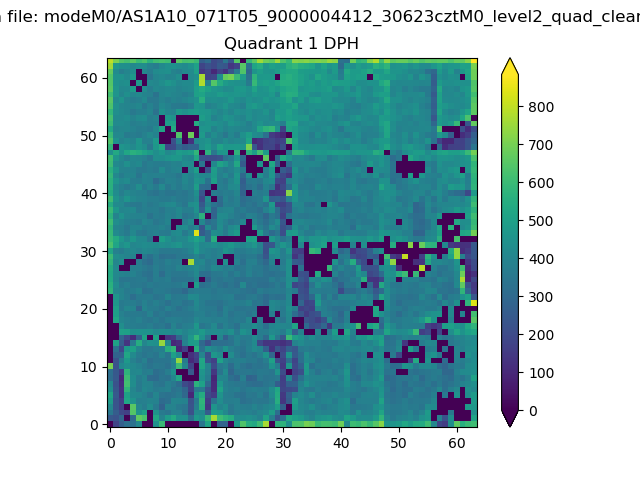 |
Quadrant B |
|---|---|---|---|
| Quadrant D | 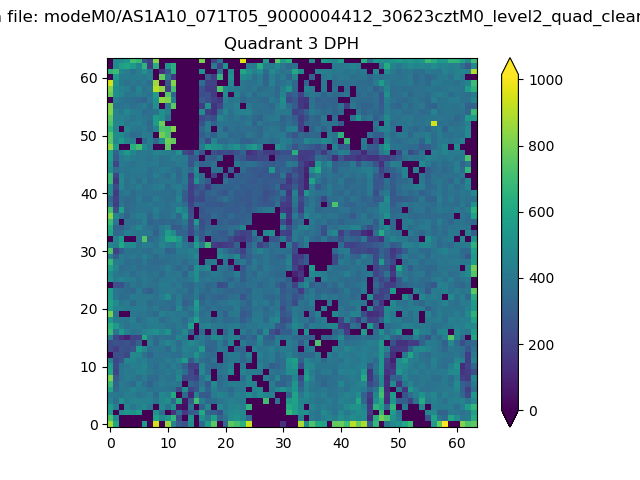 |
 |
Quadrant C |
| Plot type | Count rate plots | Images |
|---|---|---|
| Comparison with Poisson distribution Blue bars denote a histogram of data divided into 1 sec bins. Red curve is a Poisson curve with rate = median count rate of data. |
 |
 |
| Quadrant-wise count rates Data is divided into 100 sec bins |
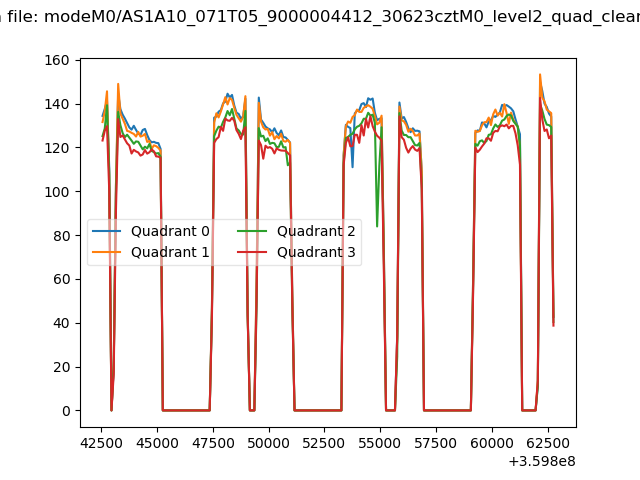 |
|
| Module-wise count rates for Quadrant A Data is divided into 100 sec bins |
 |
 |
| Module-wise count rates for Quadrant B Data is divided into 100 sec bins |
 |
 |
| Module-wise count rates for Quadrant C Data is divided into 100 sec bins |
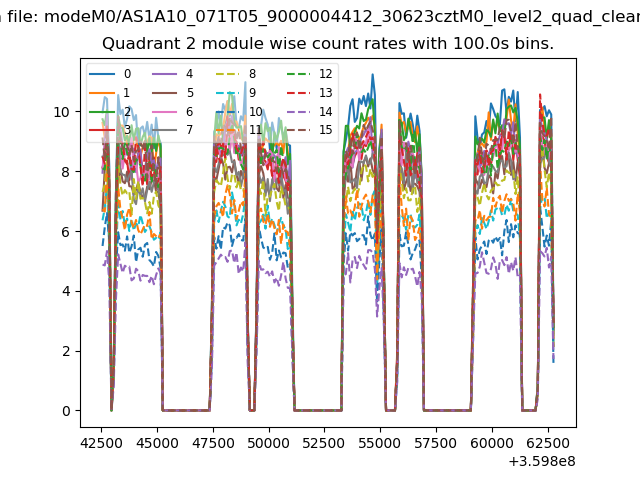 |
 |
| Module-wise count rates for Quadrant D Data is divided into 100 sec bins |
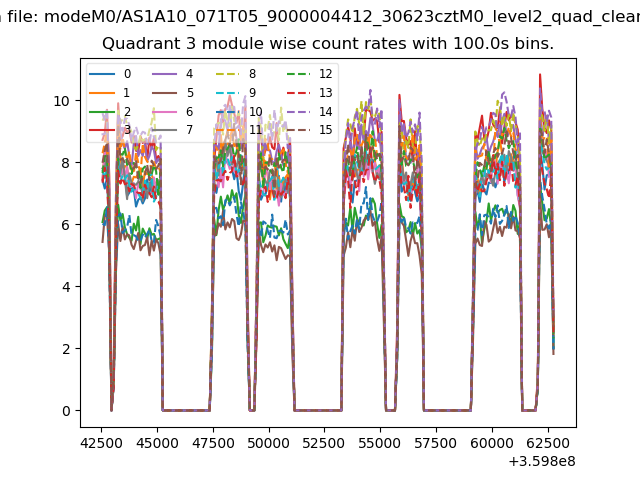 |
 |
| Parameter | Plot |
|---|---|
| CZT HV Monitor | 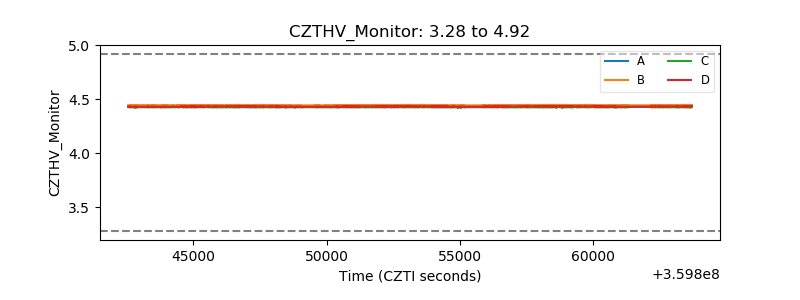 |
| D_VDD | 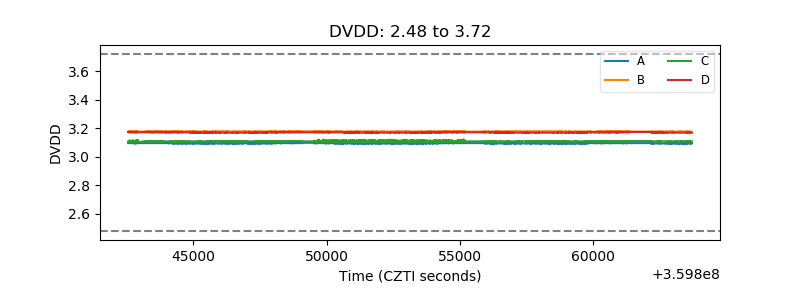 |
| Temperature 1 | 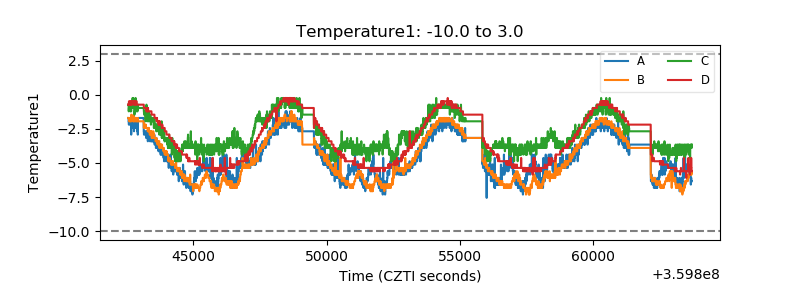 |
| Veto HV Monitor |  |
| Veto LLD | 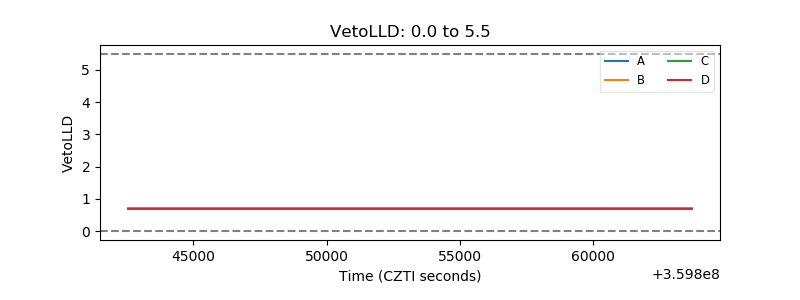 |
| Alpha Counter | 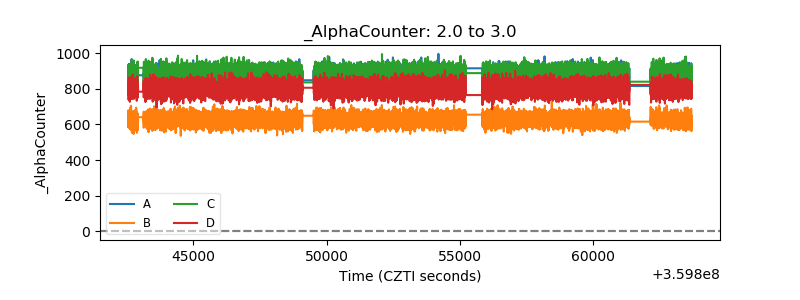 |
| _CPM_Rate | 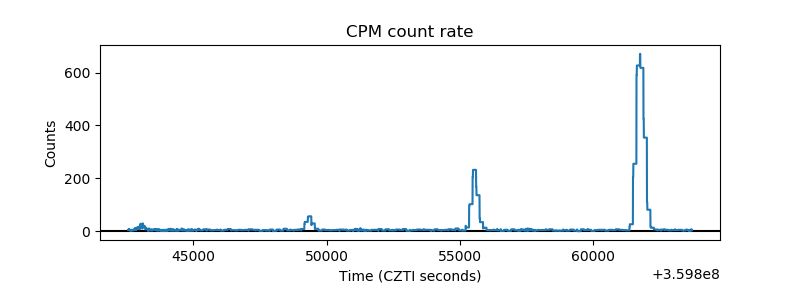 |
| CZT Counter | 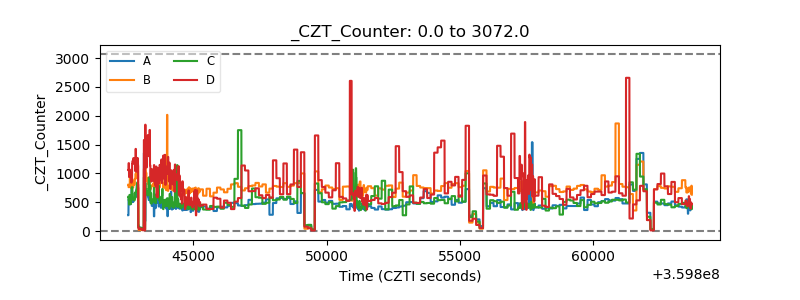 |
| +2.5 Volts monitor |  |
| +5 Volts monitor |  |
| _ROLL_ROT | 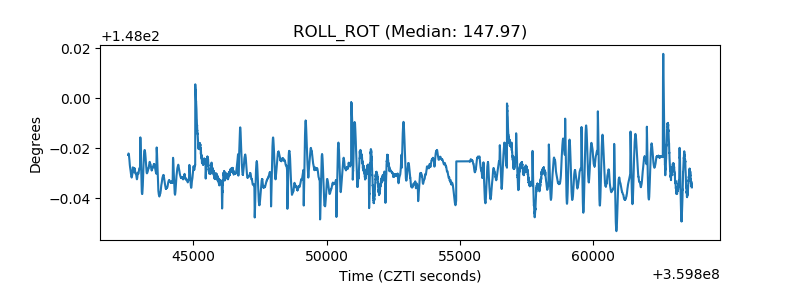 |
| _Roll_DEC | 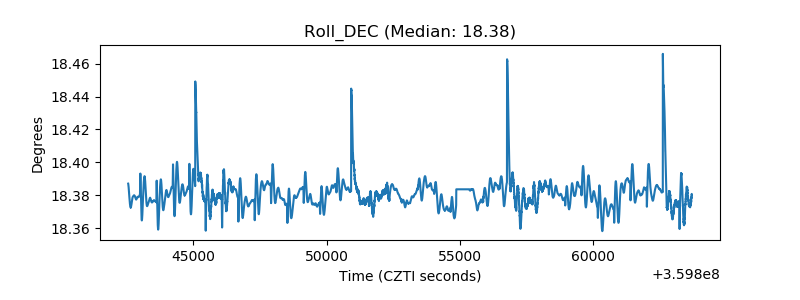 |
| _Roll_RA | 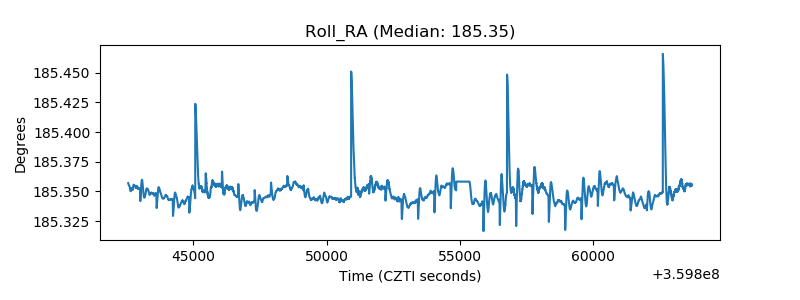 |
| Veto Counter |  |