| Param | Original file | Final file |
|---|---|---|
| Filename | modeM0/AS1A10_071T05_9000004412_30624cztM0_level2.evt | modeM0/AS1A10_071T05_9000004412_30624cztM0_level2_quad_clean.evt |
| Size (bytes) | 525,608,640 | 63,921,600 |
| Size | 501.3 MB | 61.0 MB |
| Events in quadrant A | 3,551,593 | 388,696 |
| Events in quadrant B | 4,763,030 | 385,822 |
| Events in quadrant C | 3,060,189 | 366,477 |
| Events in quadrant D | 4,121,658 | 359,979 |
| Mode M0 | |||
|---|---|---|---|
| Quadrant | BADHDUFLAG | Total packets | Discarded packets |
| A | 0 | 14444 | 6 |
| B | 0 | 18825 | 1 |
| C | 0 | 12873 | 1 |
| D | 0 | 16573 | 1 |
| Mode M9 | |||
|---|---|---|---|
| Quadrant | BADHDUFLAG | Total packets | Discarded packets |
| A | 0 | 10 | 0 |
| B | 0 | 10 | 0 |
| C | 0 | 10 | 0 |
| D | 0 | 10 | 0 |
| Mode SS | |||
|---|---|---|---|
| Quadrant | BADHDUFLAG | Total packets | Discarded packets |
| A | 0 | 124 | 0 |
| B | 0 | 124 | 0 |
| C | 0 | 124 | 0 |
| D | 0 | 124 | 0 |
| Quadrant | Total seconds | Saturated seconds | Saturation percentage |
|---|---|---|---|
| A | 6232 | 184 | 2.952503% |
| B | 6232 | 64 | 1.026958% |
| C | 6232 | 135 | 2.166239% |
| D | 6233 | 82 | 1.315578% |
Noise dominated data is calculated using 1-second bins in cleaned event files. If a bin has >2000 counts, and if more than 50% of those come from <1% of pixels, then it is considered to be noise-dominated and hence unusable.
| Quadrant | # 1 sec bins | Bins with >0 counts | Bins with >2000 counts | High rate bins dominated by noise | Noise dominated (total time) | Noise dominated (detector-on time) | Marked lightcurve |
|---|---|---|---|---|---|---|---|
| A | 7192 | 6233 | 110 | 110 | 1.53% | 1.76% | 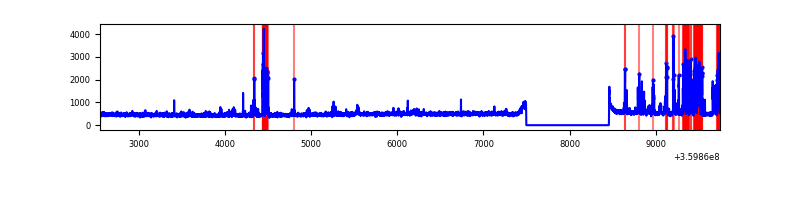 |
| B | 7192 | 6233 | 0 | 0 | 0.00% | 0.00% | 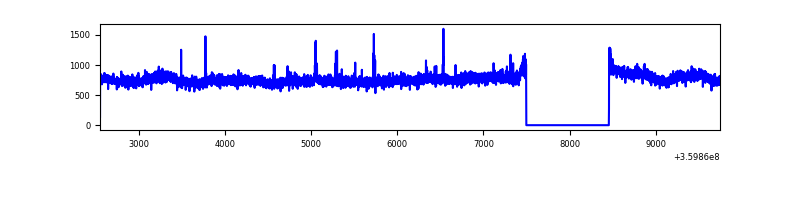 |
| C | 7192 | 6233 | 2 | 2 | 0.03% | 0.03% |  |
| D | 7193 | 6234 | 47 | 47 | 0.65% | 0.75% | 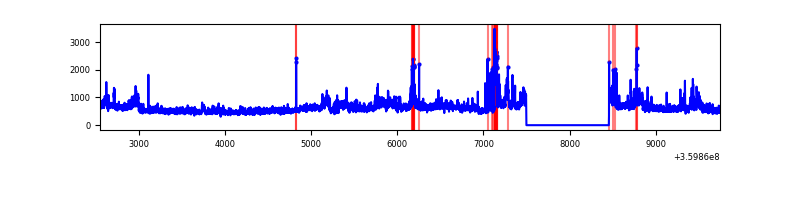 |
Top three noisy pixels from each quadrant. If the there are fewer than three noisy pixels in the level2.evt file, extra rows are filled as -1
| Pixel properties | Quadrant properties | ||||||
|---|---|---|---|---|---|---|---|
| Quadrant | DetID | PixID | Counts | Sigma | Mean | Median | Sigma |
| A | 0 | 13 | 571525 | 3684.07 | 769 | 755 | 154.9 |
| A | 13 | 254 | 11388 | 68.63 | 769 | 755 | 154.9 |
| A | 3 | 137 | 7747 | 45.13 | 769 | 755 | 154.9 |
| B | 6 | 159 | 1695517 | 11472.16 | 767 | 748 | 147.7 |
| B | 0 | 229 | 24084 | 157.97 | 767 | 748 | 147.7 |
| B | 12 | 111 | 18680 | 121.38 | 767 | 748 | 147.7 |
| C | 14 | 238 | 130631 | 757.51 | 733 | 740 | 171.5 |
| C | 14 | 254 | 17849 | 99.78 | 733 | 740 | 171.5 |
| C | 3 | 233 | 14624 | 80.97 | 733 | 740 | 171.5 |
| D | 8 | 195 | 1063914 | 5991.29 | 741 | 721 | 177.5 |
| D | 1 | 52 | 158117 | 886.96 | 741 | 721 | 177.5 |
| D | 7 | 64 | 46575 | 258.4 | 741 | 721 | 177.5 |
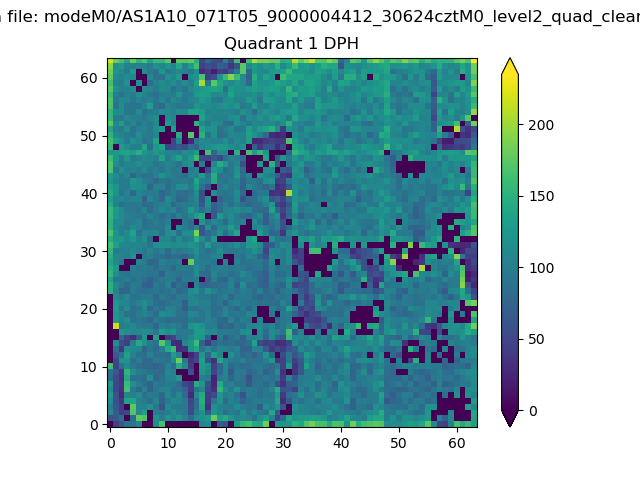
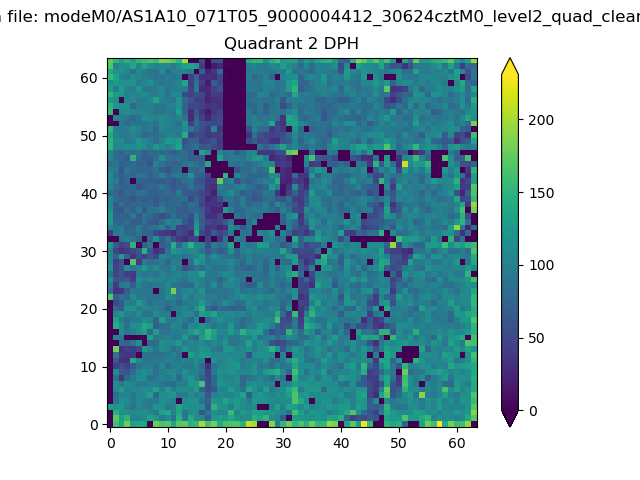
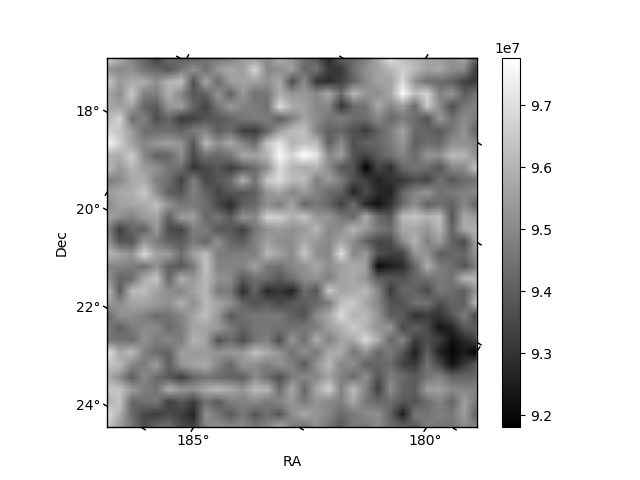
Histogram calculated using DETX and DETY for each event in the final _common_clean file
| Quadrant A | 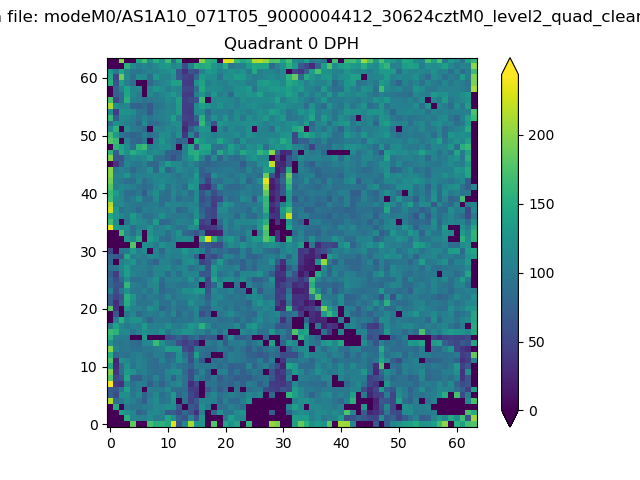 |
 |
Quadrant B |
|---|---|---|---|
| Quadrant D | 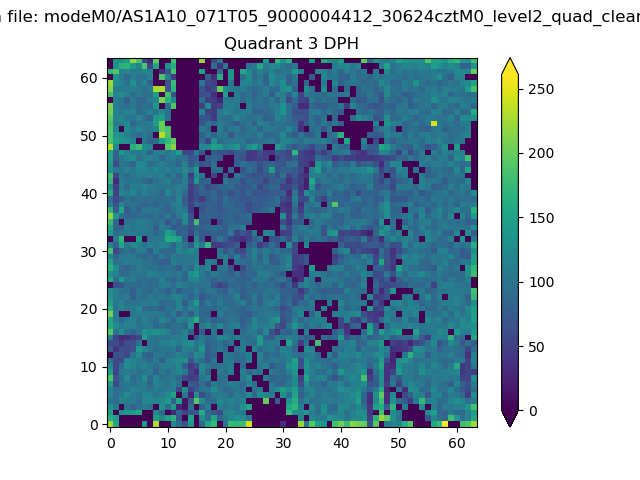 |
 |
Quadrant C |
| Plot type | Count rate plots | Images |
|---|---|---|
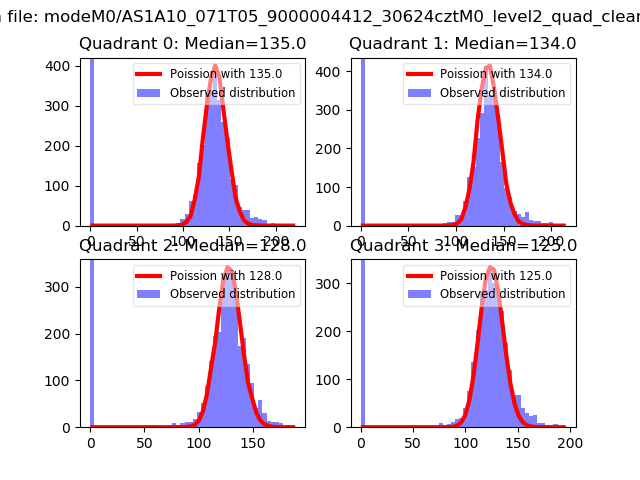
| Comparison with Poisson distribution Blue bars denote a histogram of data divided into 1 sec bins. Red curve is a Poisson curve with rate = median count rate of data. |
 |
 |
| Quadrant-wise count rates Data is divided into 100 sec bins |
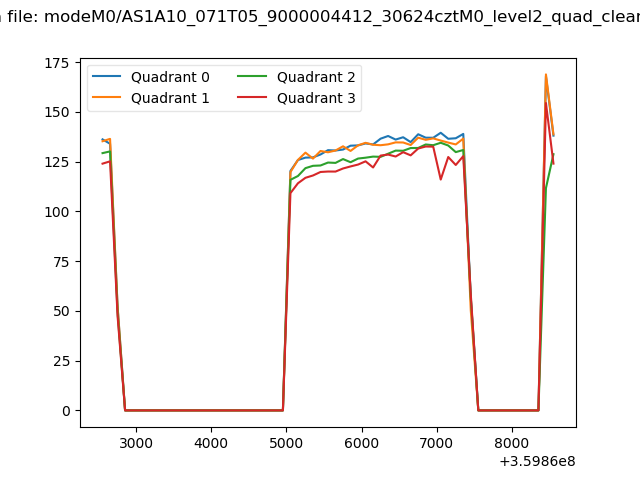 |
|
| Module-wise count rates for Quadrant A Data is divided into 100 sec bins |
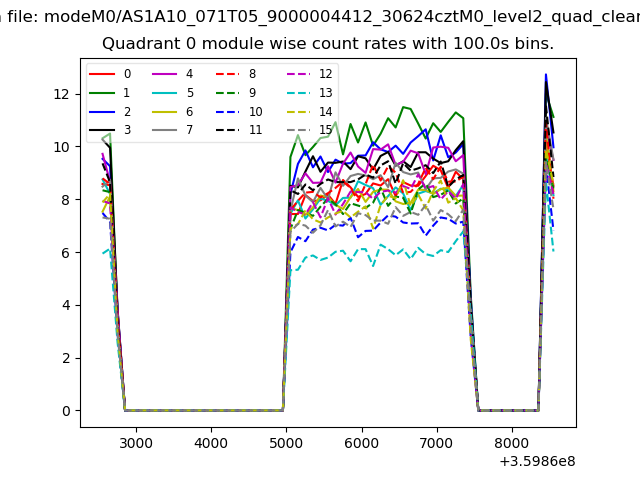 |
 |
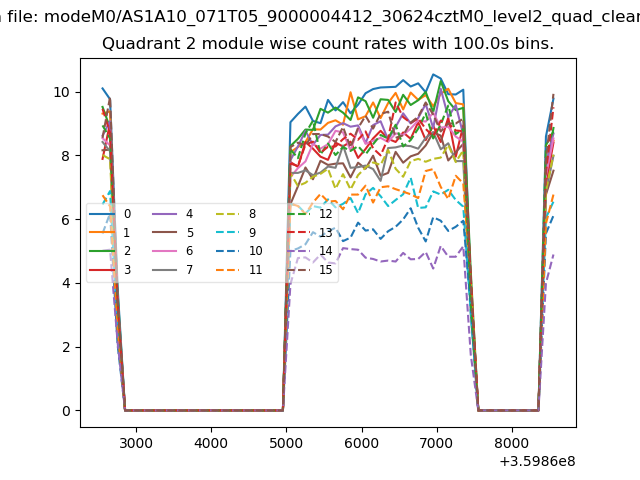
| Module-wise count rates for Quadrant B Data is divided into 100 sec bins |
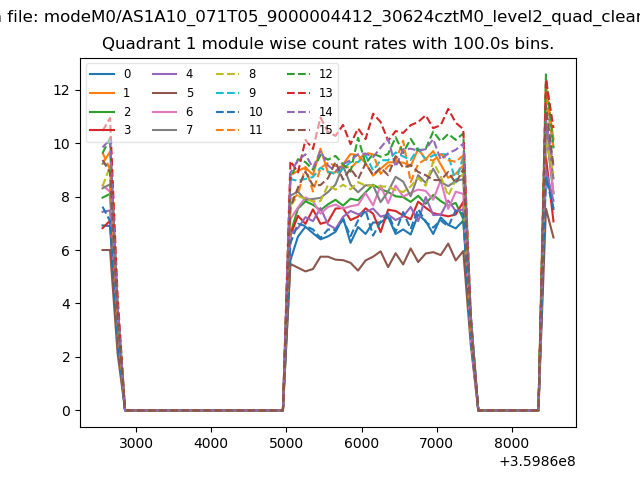 |
 |
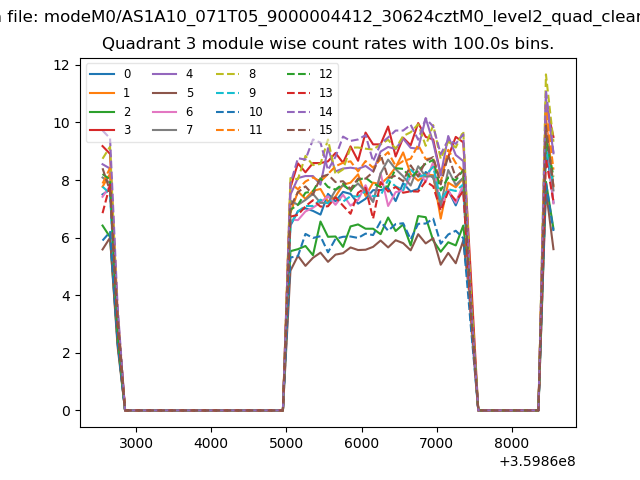
| Module-wise count rates for Quadrant C Data is divided into 100 sec bins |
 |
 |
| Module-wise count rates for Quadrant D Data is divided into 100 sec bins |
 |
 |
| Parameter | Plot |
|---|---|
| CZT HV Monitor | 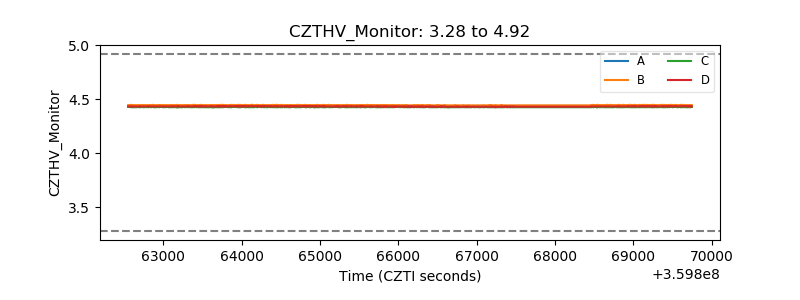 |
| D_VDD | 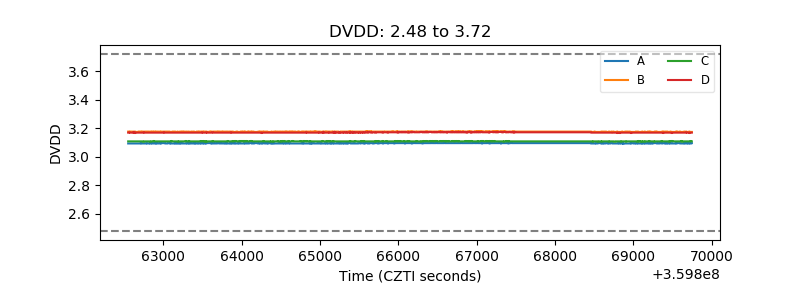 |
| Temperature 1 | 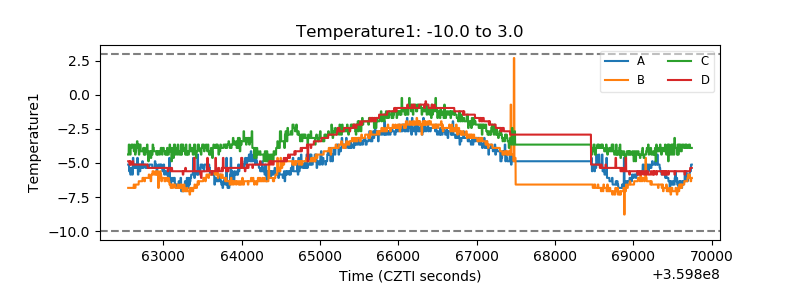 |
| Veto HV Monitor | 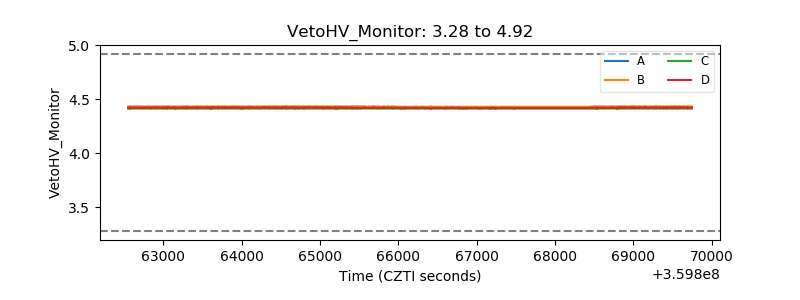 |
| Veto LLD | 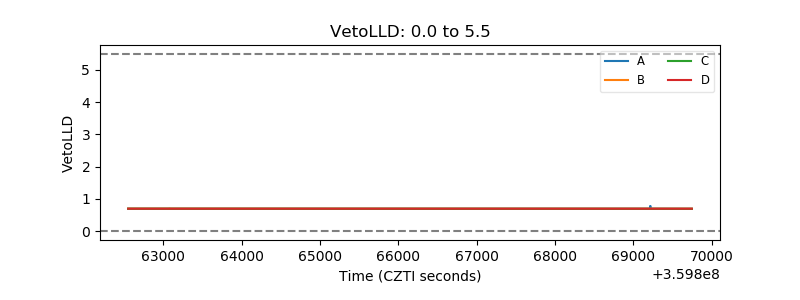 |
| Alpha Counter | 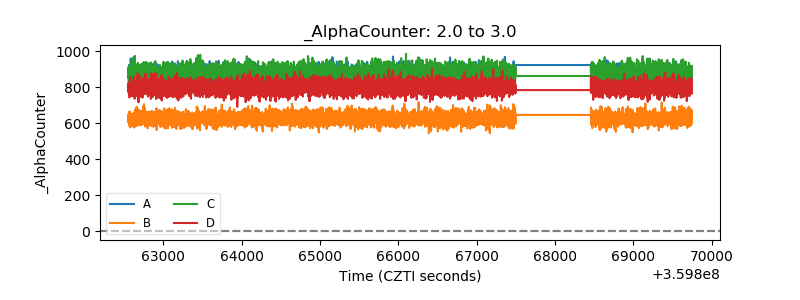 |
| _CPM_Rate | 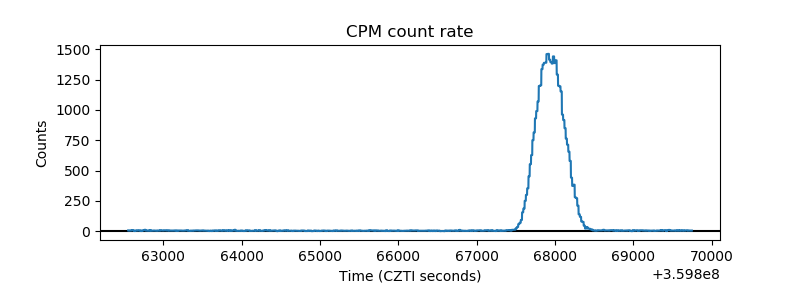 |
| CZT Counter | 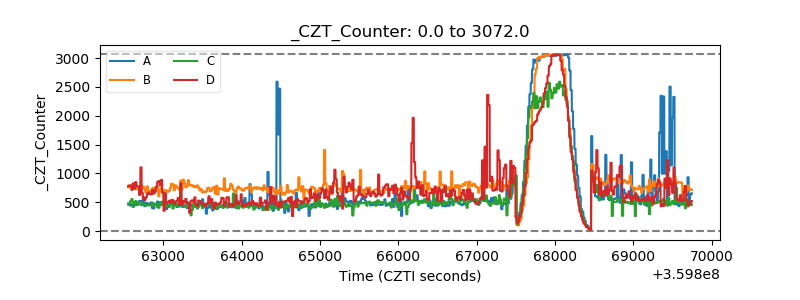 |
| +2.5 Volts monitor |  |
| +5 Volts monitor |  |
| _ROLL_ROT | 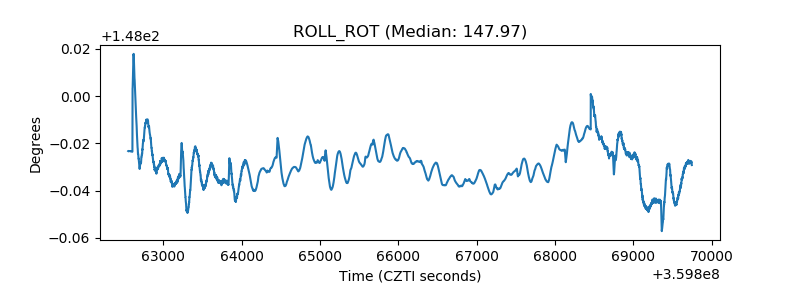 |
| _Roll_DEC | 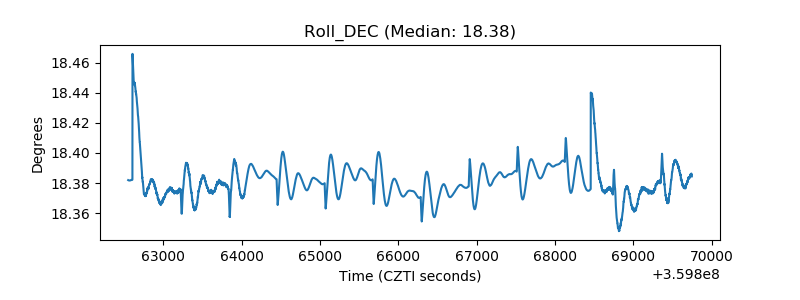 |
| _Roll_RA |  |
| Veto Counter | 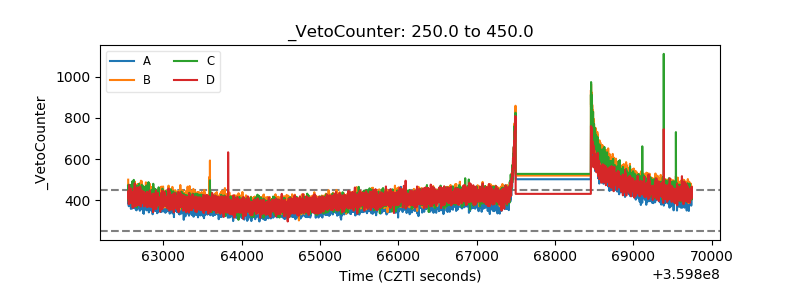 |