| Param | Original file | Final file |
|---|---|---|
| Filename | modeM0/AS1A10_071T05_9000004412_30627cztM0_level2.evt | modeM0/AS1A10_071T05_9000004412_30627cztM0_level2_quad_clean.evt |
| Size (bytes) | 586,869,120 | 70,355,520 |
| Size | 559.7 MB | 67.1 MB |
| Events in quadrant A | 3,576,136 | 436,900 |
| Events in quadrant B | 5,225,823 | 435,889 |
| Events in quadrant C | 3,546,169 | 411,929 |
| Events in quadrant D | 4,992,388 | 398,677 |
| Mode M0 | |||
|---|---|---|---|
| Quadrant | BADHDUFLAG | Total packets | Discarded packets |
| A | 0 | 14567 | 2 |
| B | 0 | 19880 | 2 |
| C | 0 | 14437 | 2 |
| D | 0 | 19578 | 2 |
| Mode M9 | |||
|---|---|---|---|
| Quadrant | BADHDUFLAG | Total packets | Discarded packets |
| A | 0 | 12 | 0 |
| B | 0 | 12 | 0 |
| C | 0 | 12 | 0 |
| D | 0 | 12 | 0 |
| Mode SS | |||
|---|---|---|---|
| Quadrant | BADHDUFLAG | Total packets | Discarded packets |
| A | 0 | 130 | 0 |
| B | 0 | 130 | 0 |
| C | 0 | 130 | 0 |
| D | 0 | 130 | 0 |
| Quadrant | Total seconds | Saturated seconds | Saturation percentage |
|---|---|---|---|
| A | 6403 | 74 | 1.155708% |
| B | 6403 | 119 | 1.858504% |
| C | 6403 | 147 | 2.295799% |
| D | 6403 | 65 | 1.015149% |
Noise dominated data is calculated using 1-second bins in cleaned event files. If a bin has >2000 counts, and if more than 50% of those come from <1% of pixels, then it is considered to be noise-dominated and hence unusable.
| Quadrant | # 1 sec bins | Bins with >0 counts | Bins with >2000 counts | High rate bins dominated by noise | Noise dominated (total time) | Noise dominated (detector-on time) | Marked lightcurve |
|---|---|---|---|---|---|---|---|
| A | 7613 | 6404 | 9 | 9 | 0.12% | 0.14% | 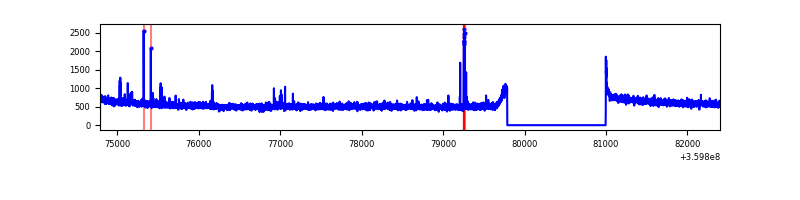 |
| B | 7613 | 6404 | 0 | 0 | 0.00% | 0.00% | 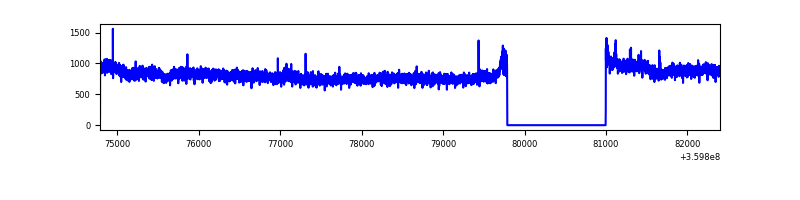 |
| C | 7613 | 6404 | 8 | 8 | 0.11% | 0.12% | 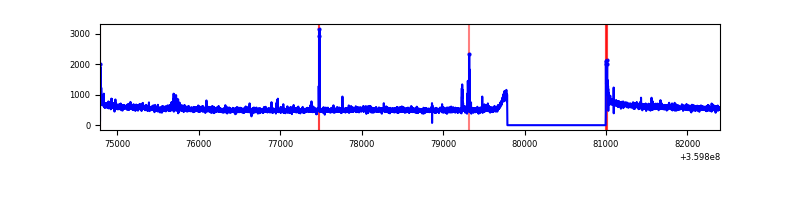 |
| D | 7613 | 6404 | 12 | 12 | 0.16% | 0.19% | 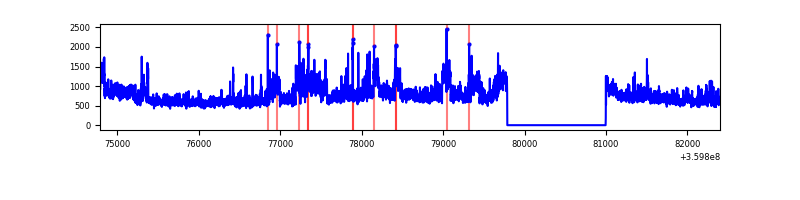 |
Top three noisy pixels from each quadrant. If the there are fewer than three noisy pixels in the level2.evt file, extra rows are filled as -1
| Pixel properties | Quadrant properties | ||||||
|---|---|---|---|---|---|---|---|
| Quadrant | DetID | PixID | Counts | Sigma | Mean | Median | Sigma |
| A | 1 | 113 | 44397 | 243.12 | 907 | 892 | 178.9 |
| A | 0 | 13 | 25869 | 139.58 | 907 | 892 | 178.9 |
| A | 13 | 254 | 12311 | 63.81 | 907 | 892 | 178.9 |
| B | 6 | 159 | 1728694 | 10360.97 | 889 | 871 | 166.8 |
| B | 12 | 111 | 20041 | 114.95 | 889 | 871 | 166.8 |
| B | 11 | 111 | 18294 | 104.48 | 889 | 871 | 166.8 |
| C | 14 | 238 | 151352 | 769.84 | 842 | 849 | 195.5 |
| C | 10 | 22 | 44577 | 223.67 | 842 | 849 | 195.5 |
| C | 0 | 10 | 34311 | 171.16 | 842 | 849 | 195.5 |
| D | 8 | 195 | 1385602 | 6928.8 | 854 | 833 | 199.9 |
| D | 1 | 52 | 300852 | 1501.17 | 854 | 833 | 199.9 |
| D | 10 | 253 | 27714 | 134.5 | 854 | 833 | 199.9 |
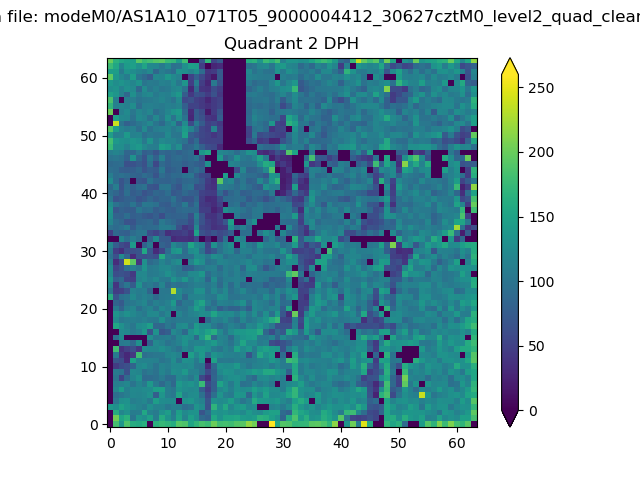
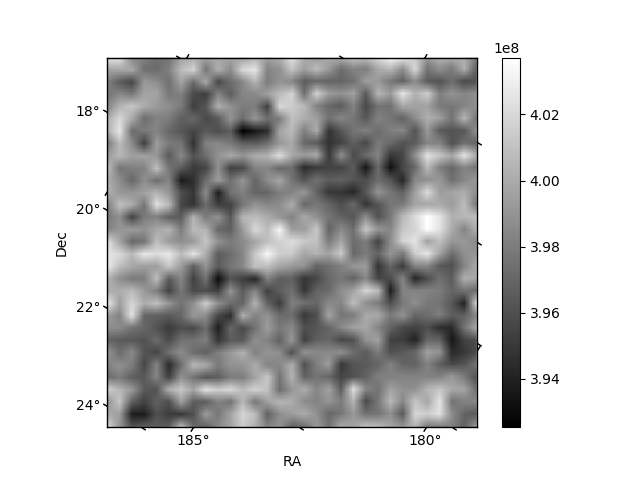
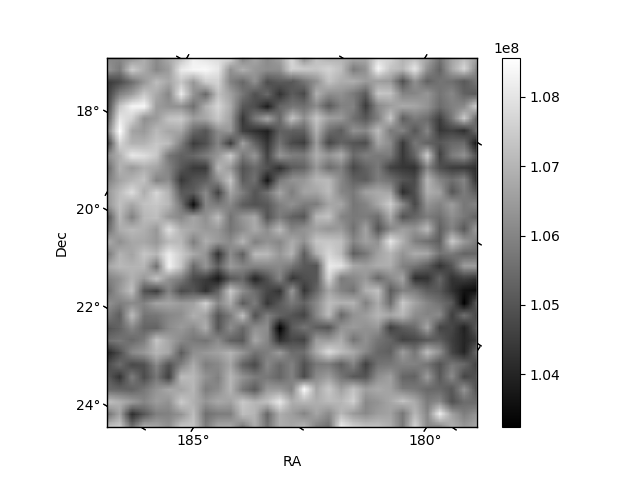
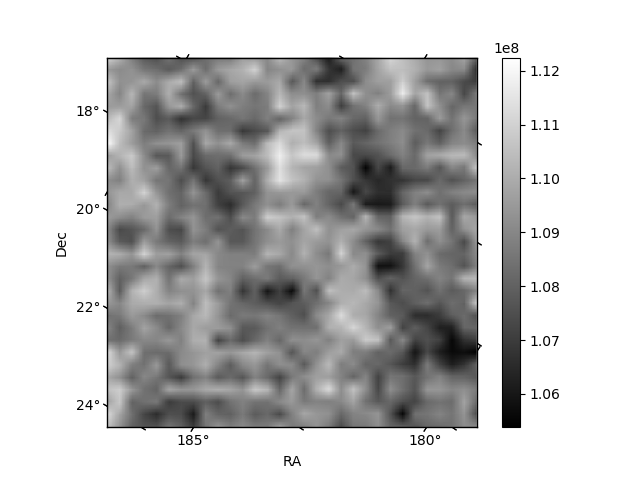
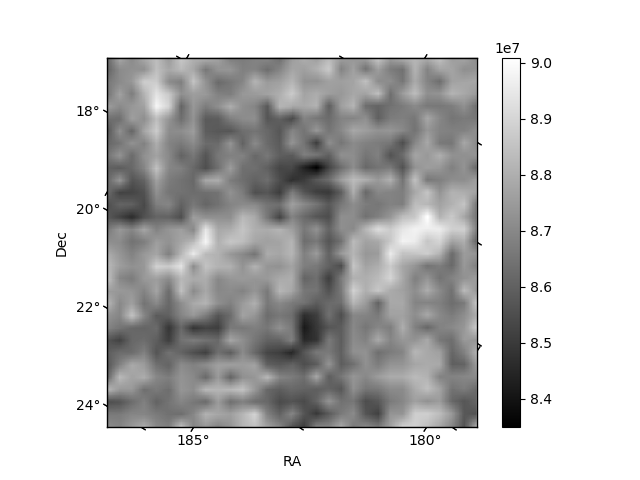
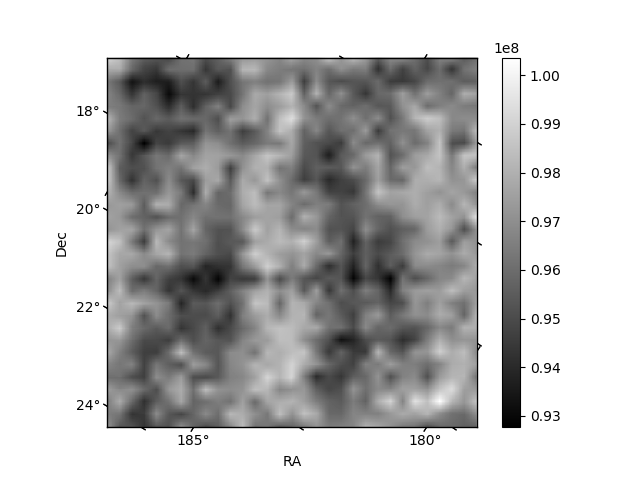
Histogram calculated using DETX and DETY for each event in the final _common_clean file
| Quadrant A | 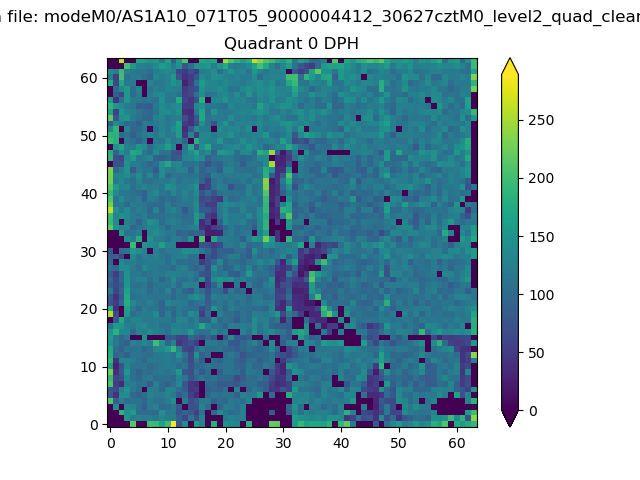 |
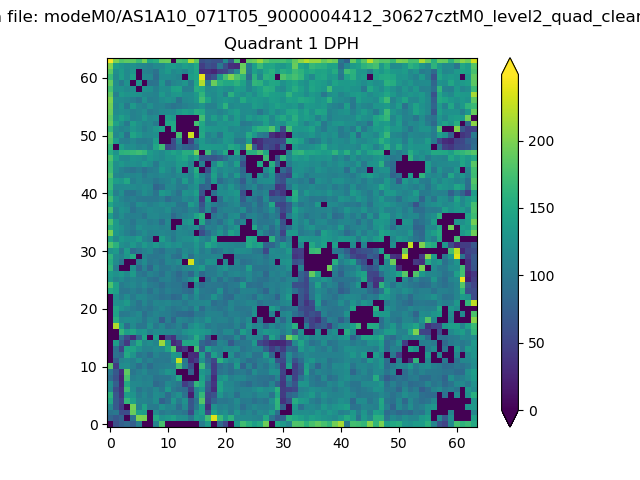 |
Quadrant B |
|---|---|---|---|
| Quadrant D | 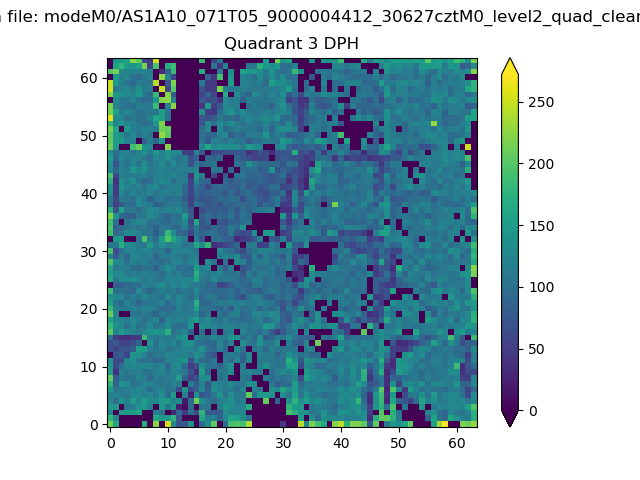 |
 |
Quadrant C |
| Plot type | Count rate plots | Images |
|---|---|---|
| Comparison with Poisson distribution Blue bars denote a histogram of data divided into 1 sec bins. Red curve is a Poisson curve with rate = median count rate of data. |
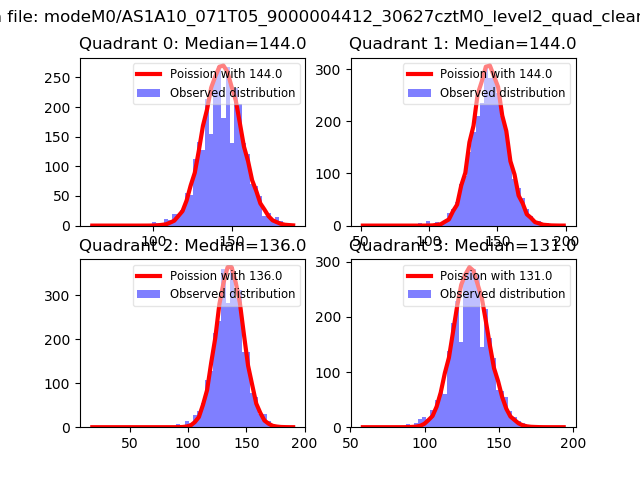 |
 |
| Quadrant-wise count rates Data is divided into 100 sec bins |
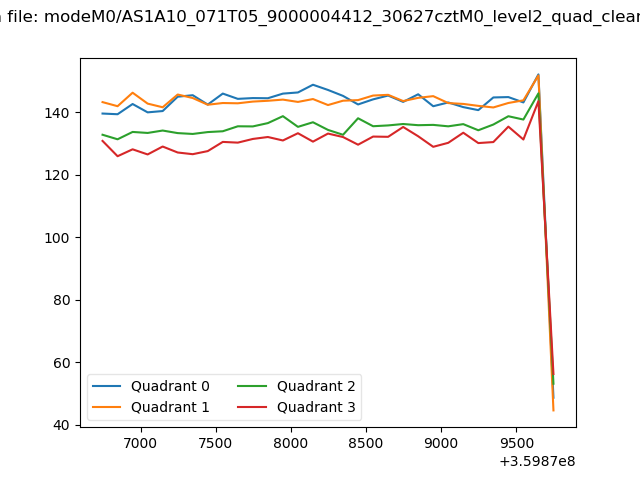 |
|
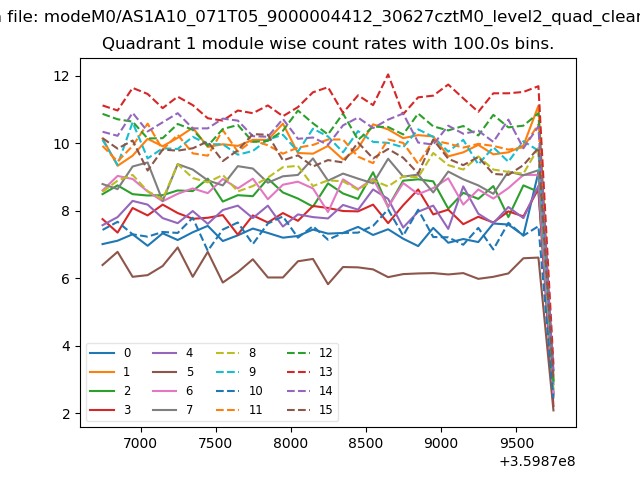
| Module-wise count rates for Quadrant A Data is divided into 100 sec bins |
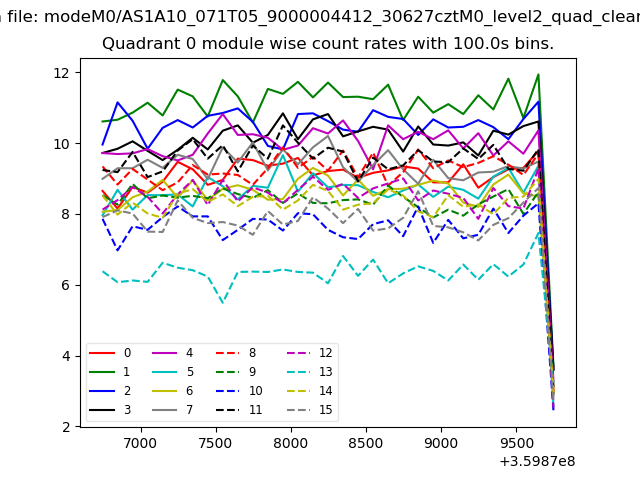 |
 |
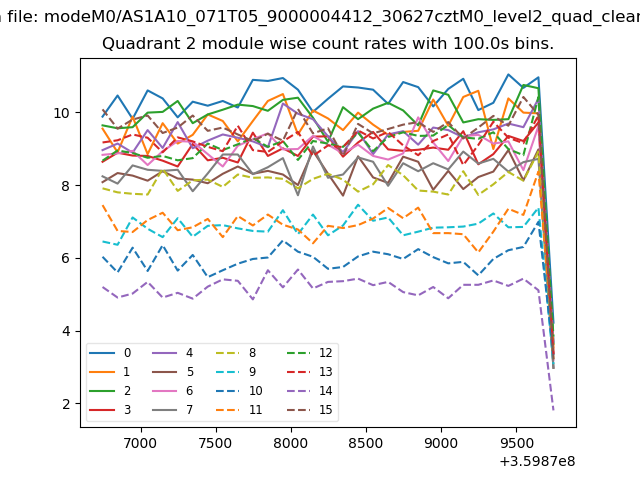
| Module-wise count rates for Quadrant B Data is divided into 100 sec bins |
 |
 |
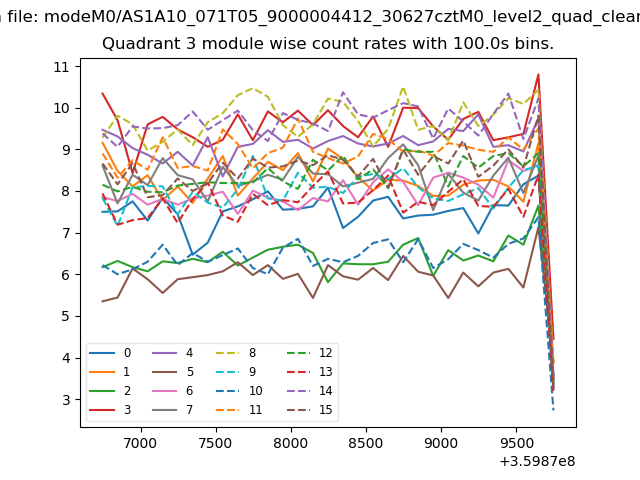
| Module-wise count rates for Quadrant C Data is divided into 100 sec bins |
 |
 |
| Module-wise count rates for Quadrant D Data is divided into 100 sec bins |
 |
 |
| Parameter | Plot |
|---|---|
| CZT HV Monitor | 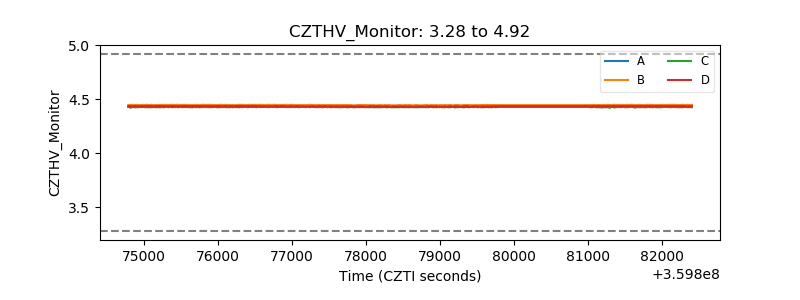 |
| D_VDD | 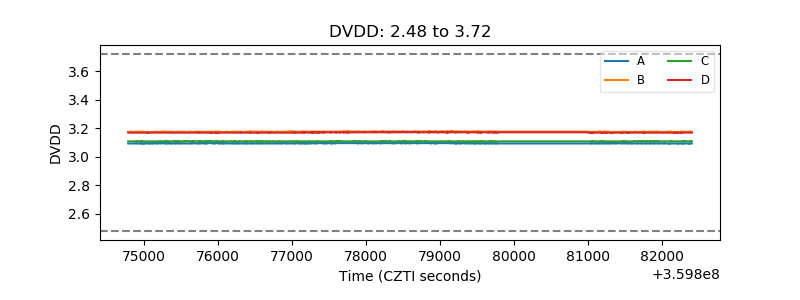 |
| Temperature 1 | 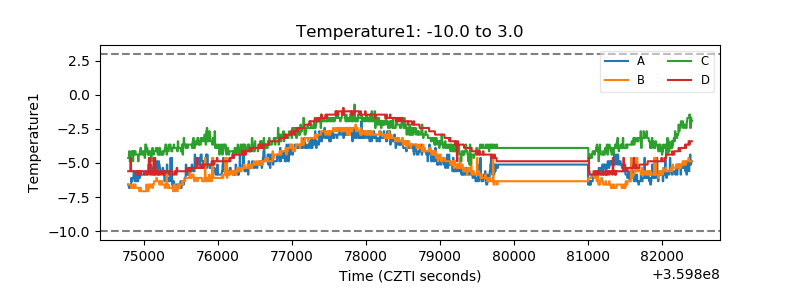 |
| Veto HV Monitor |  |
| Veto LLD | 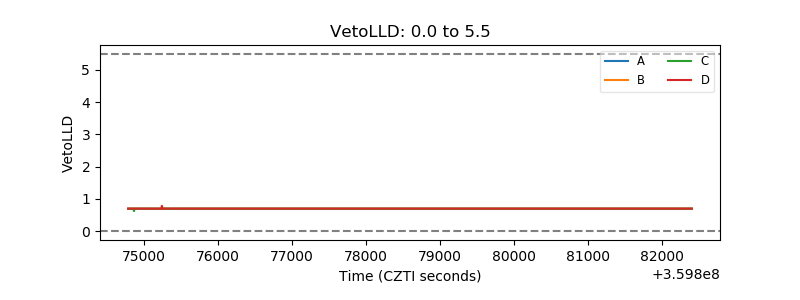 |
| Alpha Counter | 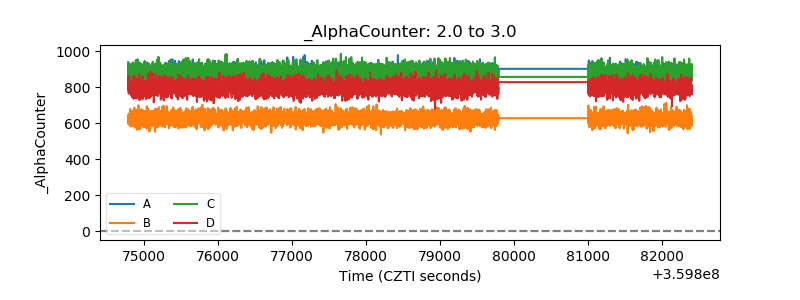 |
| _CPM_Rate | 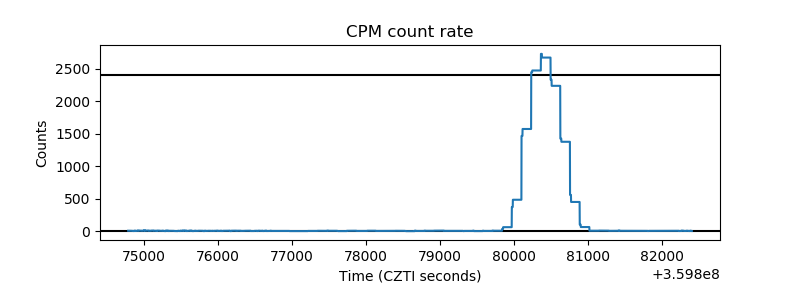 |
| CZT Counter | 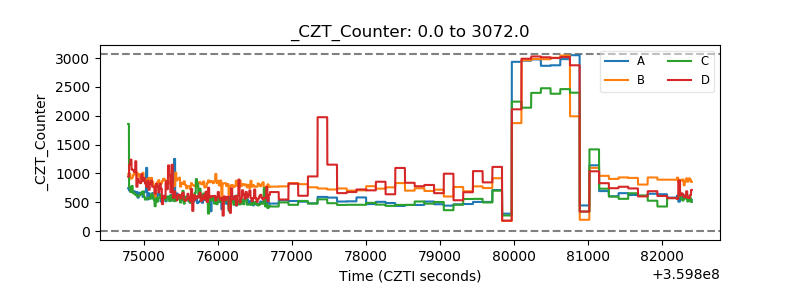 |
| +2.5 Volts monitor |  |
| +5 Volts monitor |  |
| _ROLL_ROT | 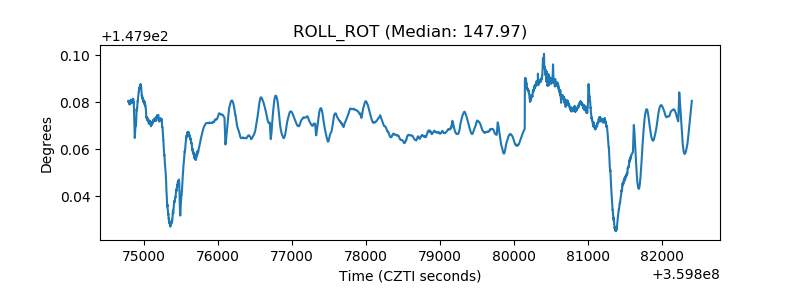 |
| _Roll_DEC | 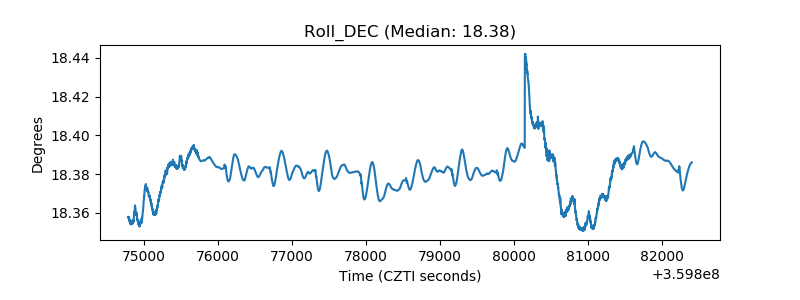 |
| _Roll_RA | 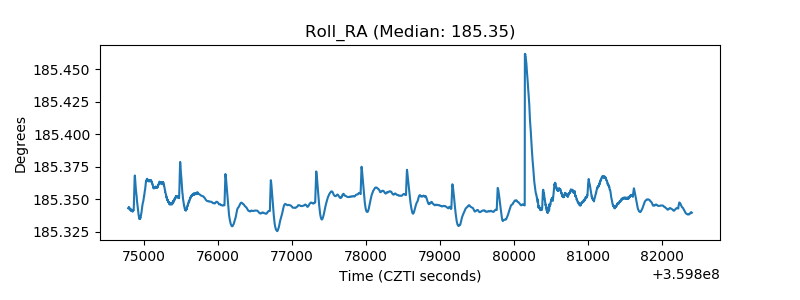 |
| Veto Counter | 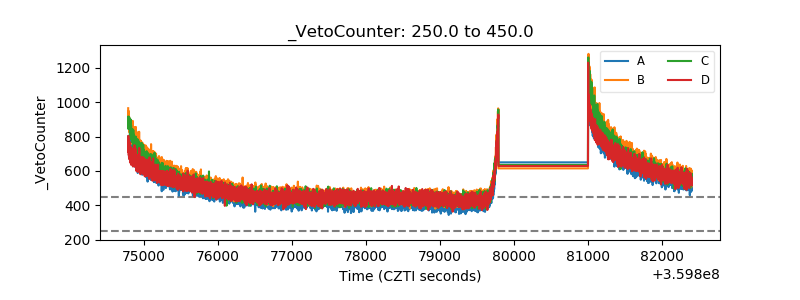 |