| Param | Original file | Final file |
|---|---|---|
| Filename | modeM0/AS1A10_055T01_9000004414_30629cztM0_level2.evt | modeM0/AS1A10_055T01_9000004414_30629cztM0_level2_quad_clean.evt |
| Size (bytes) | 667,578,240 | 88,289,280 |
| Size | 636.7 MB | 84.2 MB |
| Events in quadrant A | 3,631,377 | 585,581 |
| Events in quadrant B | 5,324,639 | 578,780 |
| Events in quadrant C | 3,799,329 | 551,468 |
| Events in quadrant D | 7,042,936 | 523,722 |
| Mode M9 | |||
|---|---|---|---|
| Quadrant | BADHDUFLAG | Total packets | Discarded packets |
| A | 0 | 23 | 0 |
| B | 0 | 24 | 0 |
| C | 0 | 24 | 0 |
| D | 0 | 24 | 0 |
| Mode M0 | |||
|---|---|---|---|
| Quadrant | BADHDUFLAG | Total packets | Discarded packets |
| A | 0 | 14827 | 2 |
| B | 0 | 19806 | 2 |
| C | 0 | 15572 | 2 |
| D | 0 | 25447 | 2 |
| Mode SS | |||
|---|---|---|---|
| Quadrant | BADHDUFLAG | Total packets | Discarded packets |
| A | 0 | 128 | 0 |
| B | 0 | 128 | 0 |
| C | 0 | 128 | 0 |
| D | 0 | 128 | 0 |
| Quadrant | Total seconds | Saturated seconds | Saturation percentage |
|---|---|---|---|
| A | 6213 | 124 | 1.995815% |
| B | 6213 | 206 | 3.315629% |
| C | 6213 | 356 | 5.729921% |
| D | 6213 | 520 | 8.369548% |
Noise dominated data is calculated using 1-second bins in cleaned event files. If a bin has >2000 counts, and if more than 50% of those come from <1% of pixels, then it is considered to be noise-dominated and hence unusable.
| Quadrant | # 1 sec bins | Bins with >0 counts | Bins with >2000 counts | High rate bins dominated by noise | Noise dominated (total time) | Noise dominated (detector-on time) | Marked lightcurve |
|---|---|---|---|---|---|---|---|
| A | 7548 | 6214 | 0 | 0 | 0.00% | 0.00% | 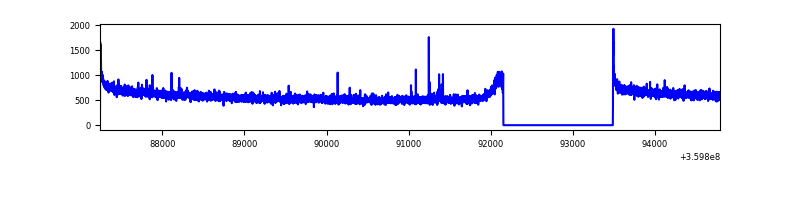 |
| B | 7548 | 6214 | 0 | 0 | 0.00% | 0.00% | 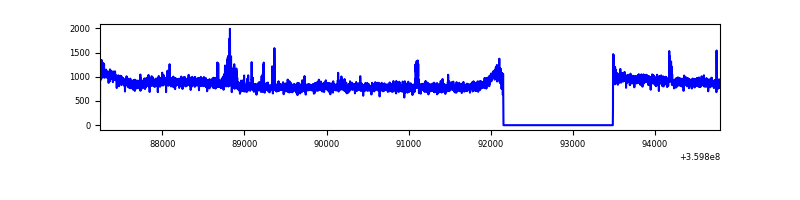 |
| C | 7548 | 6214 | 19 | 19 | 0.25% | 0.31% | 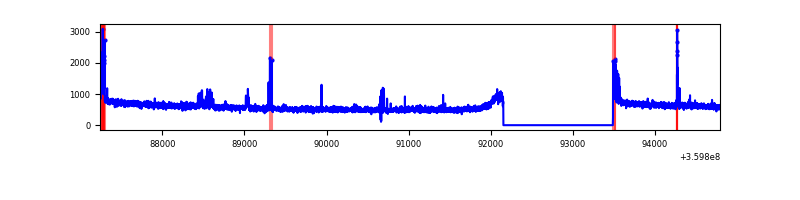 |
| D | 7548 | 6214 | 379 | 379 | 5.02% | 6.10% | 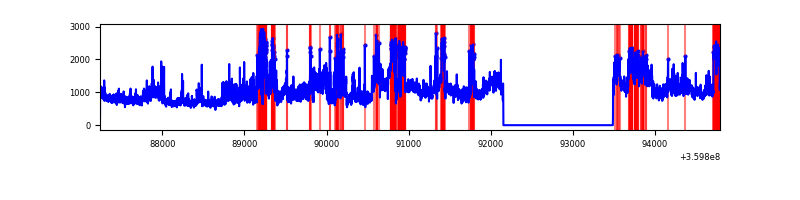 |
Top three noisy pixels from each quadrant. If the there are fewer than three noisy pixels in the level2.evt file, extra rows are filled as -1
| Pixel properties | Quadrant properties | ||||||
|---|---|---|---|---|---|---|---|
| Quadrant | DetID | PixID | Counts | Sigma | Mean | Median | Sigma |
| A | 8 | 192 | 20031 | 105.14 | 932 | 918 | 181.8 |
| A | 13 | 254 | 11918 | 60.51 | 932 | 918 | 181.8 |
| A | 1 | 113 | 10403 | 52.18 | 932 | 918 | 181.8 |
| B | 6 | 159 | 1691569 | 10051.08 | 908 | 891 | 168.2 |
| B | 0 | 190 | 60805 | 356.19 | 908 | 891 | 168.2 |
| B | 12 | 111 | 19320 | 109.56 | 908 | 891 | 168.2 |
| C | 14 | 238 | 166385 | 837.73 | 873 | 882 | 197.6 |
| C | 0 | 10 | 103951 | 521.71 | 873 | 882 | 197.6 |
| C | 10 | 22 | 59268 | 295.53 | 873 | 882 | 197.6 |
| D | 8 | 195 | 2963220 | 14487.69 | 885 | 867 | 204.5 |
| D | 10 | 253 | 595347 | 2907.37 | 885 | 867 | 204.5 |
| D | 1 | 52 | 87939 | 425.83 | 885 | 867 | 204.5 |
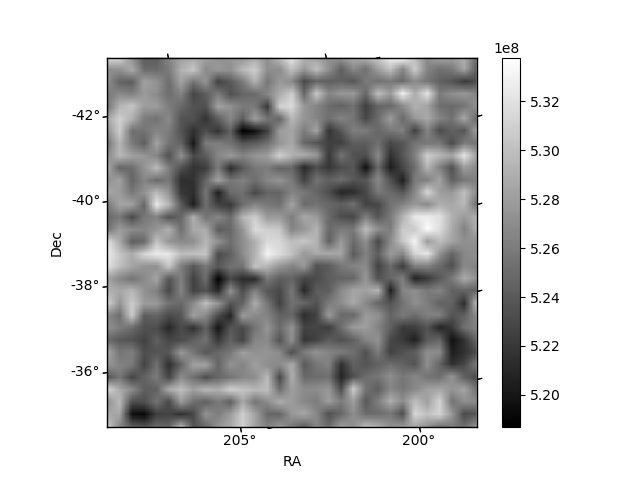
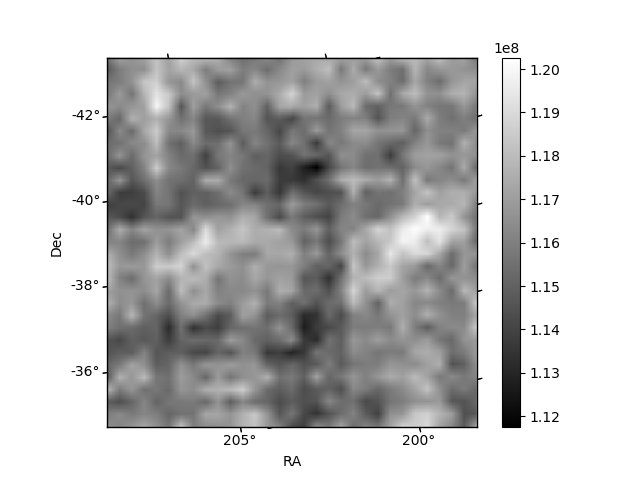
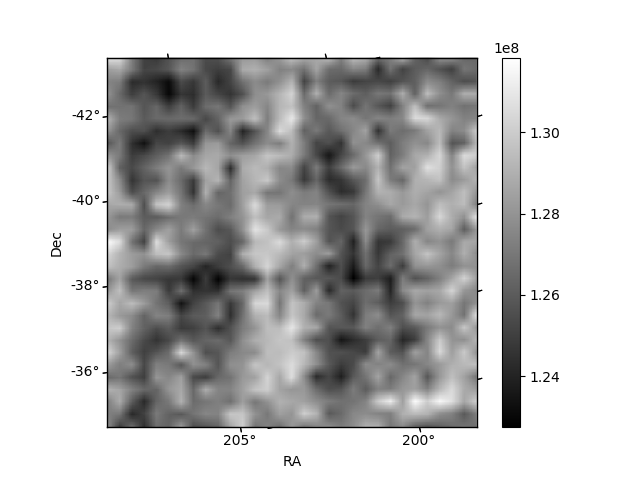
Histogram calculated using DETX and DETY for each event in the final _common_clean file
| Quadrant A | 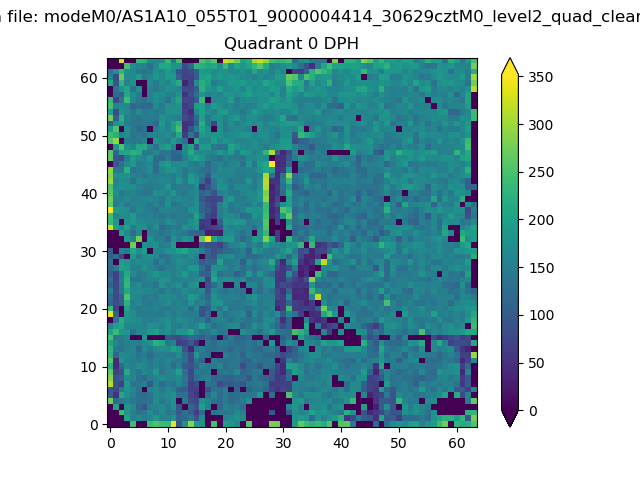 |
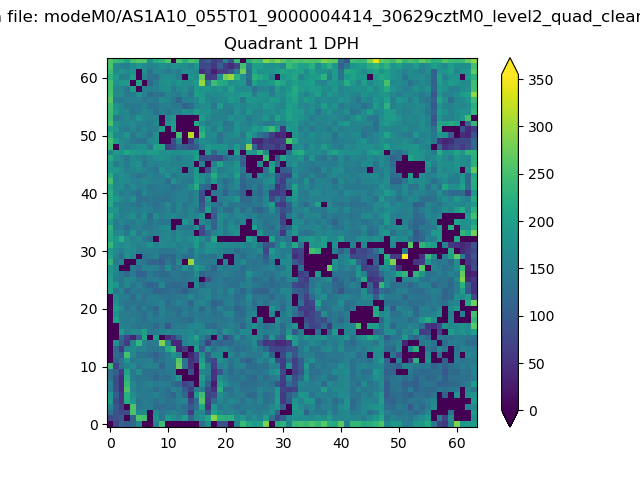 |
Quadrant B |
|---|---|---|---|
| Quadrant D | 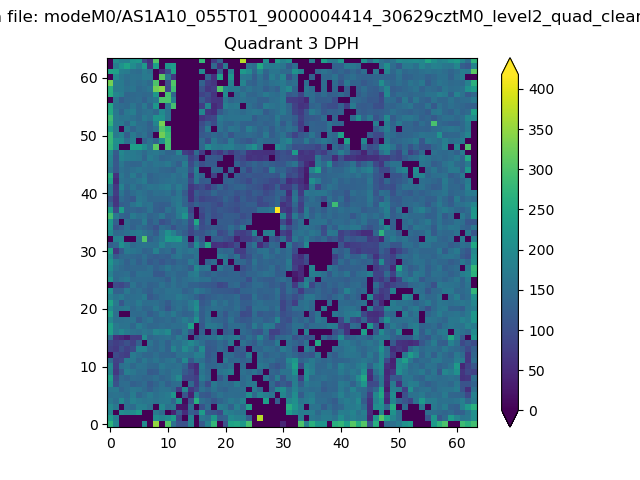 |
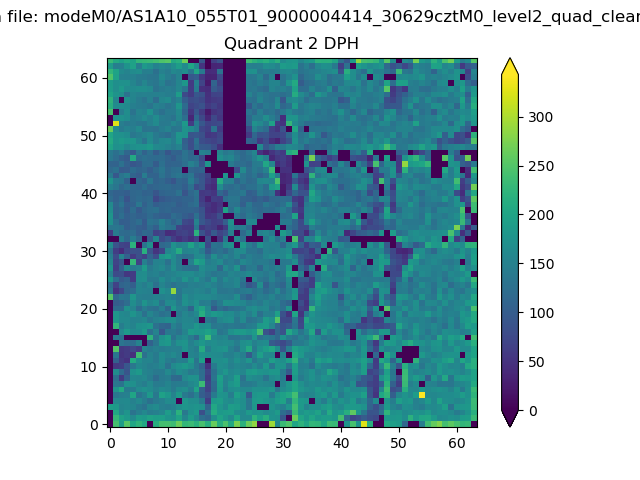 |
Quadrant C |
| Plot type | Count rate plots | Images |
|---|---|---|
| Comparison with Poisson distribution Blue bars denote a histogram of data divided into 1 sec bins. Red curve is a Poisson curve with rate = median count rate of data. |
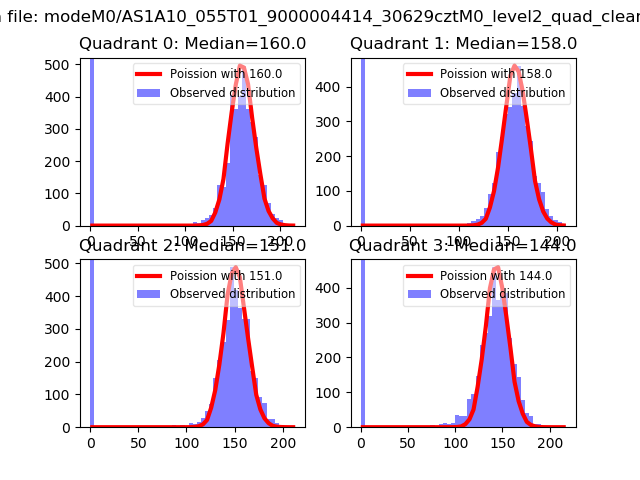 |
 |
| Quadrant-wise count rates Data is divided into 100 sec bins |
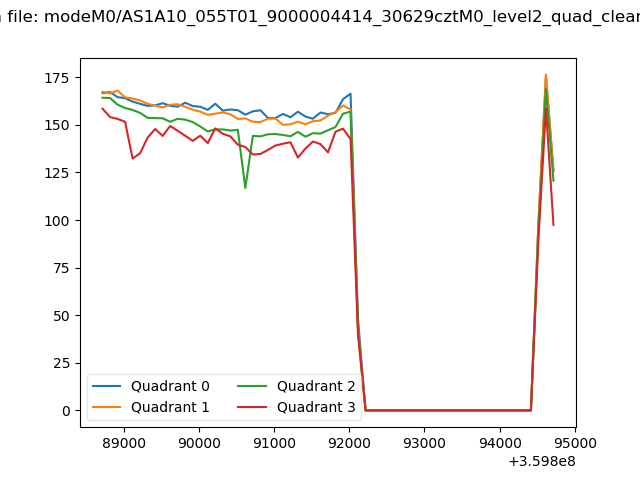 |
|
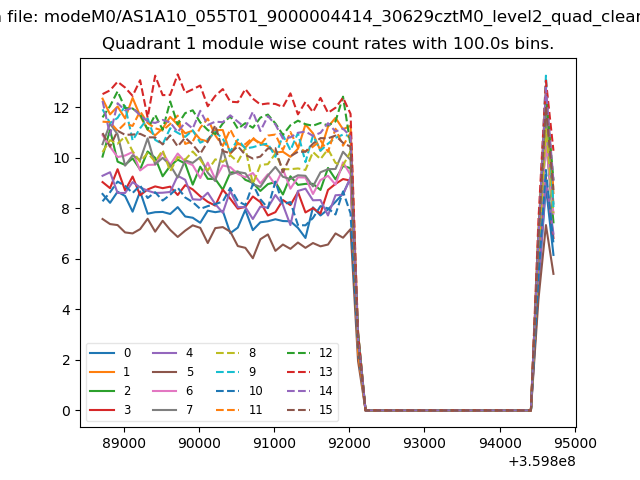
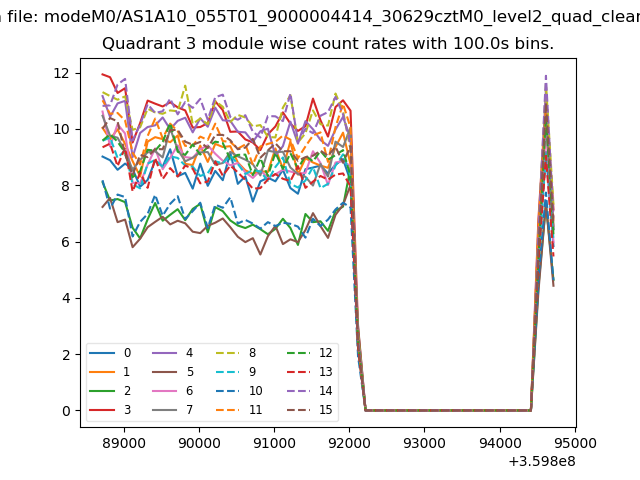
| Module-wise count rates for Quadrant A Data is divided into 100 sec bins |
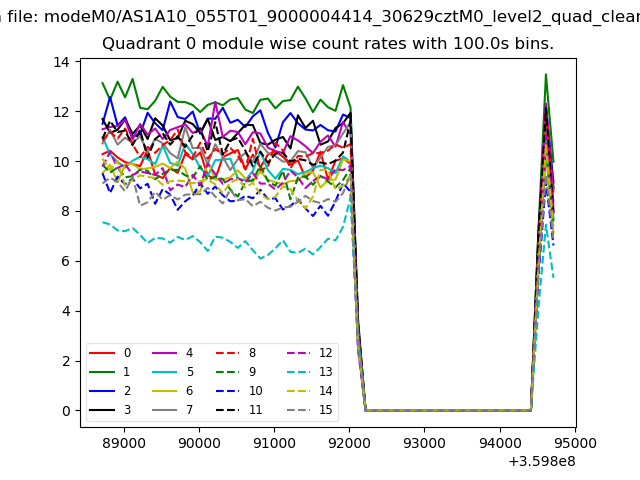 |
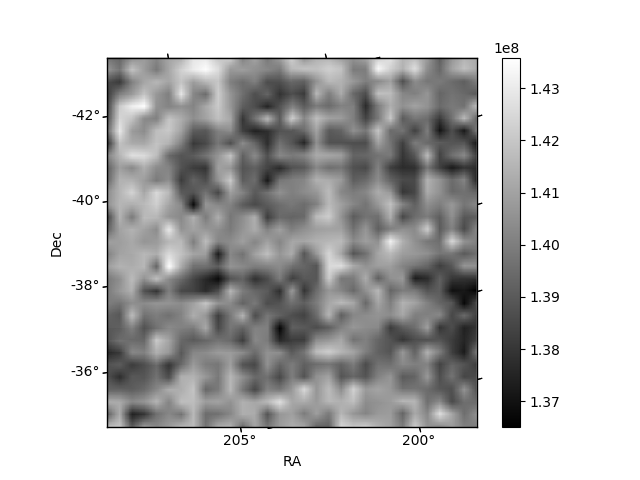 |
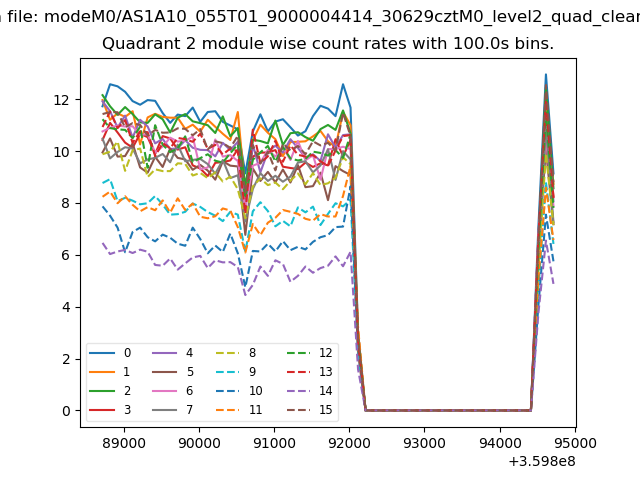
| Module-wise count rates for Quadrant B Data is divided into 100 sec bins |
 |
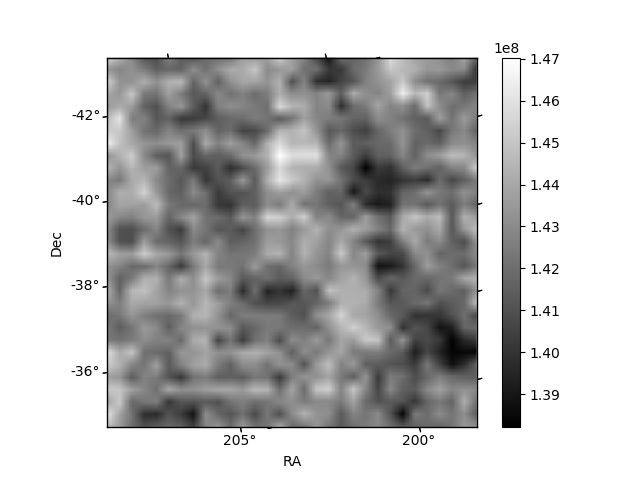 |
| Module-wise count rates for Quadrant C Data is divided into 100 sec bins |
 |
 |
| Module-wise count rates for Quadrant D Data is divided into 100 sec bins |
 |
 |
| Parameter | Plot |
|---|---|
| CZT HV Monitor | 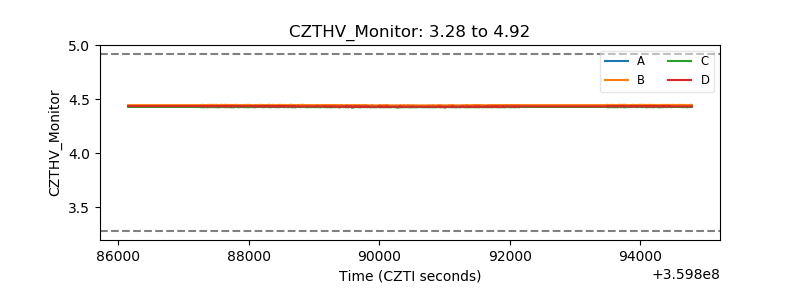 |
| D_VDD | 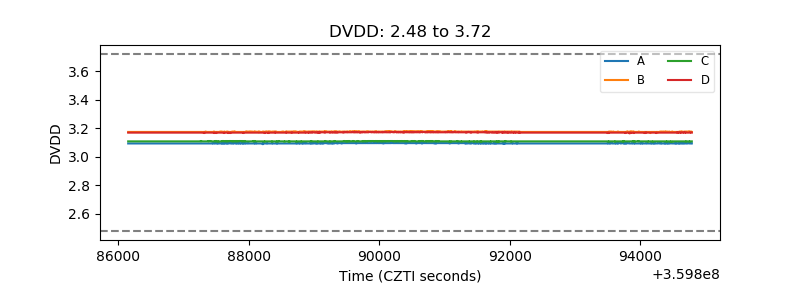 |
| Temperature 1 |  |
| Veto HV Monitor |  |
| Veto LLD | 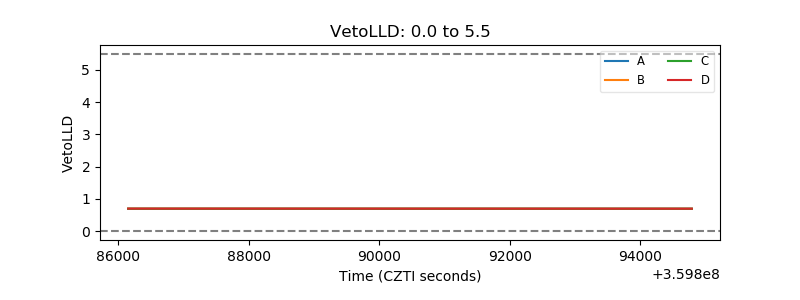 |
| Alpha Counter | 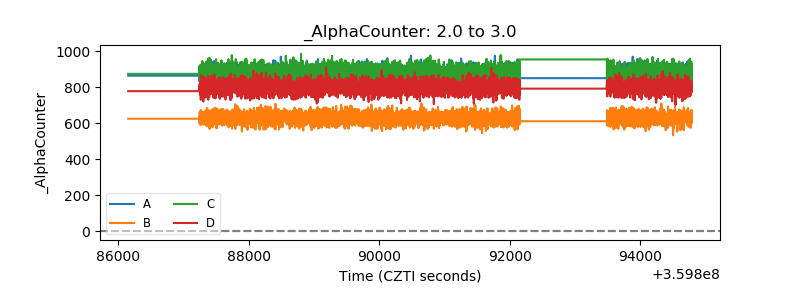 |
| _CPM_Rate | 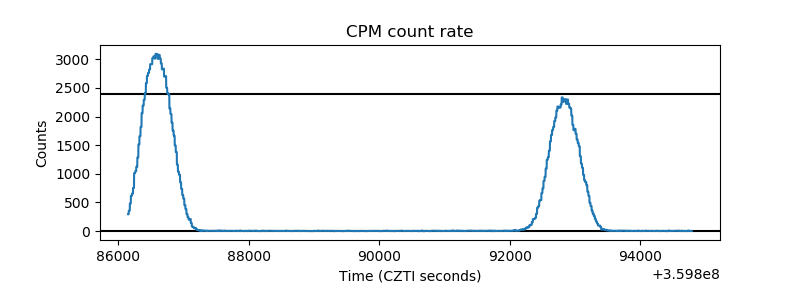 |
| CZT Counter | 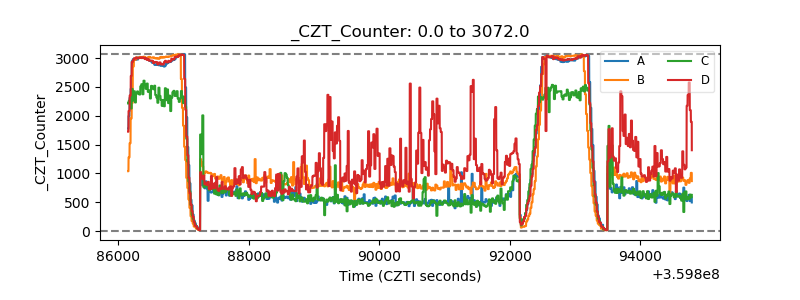 |
| +2.5 Volts monitor |  |
| +5 Volts monitor | 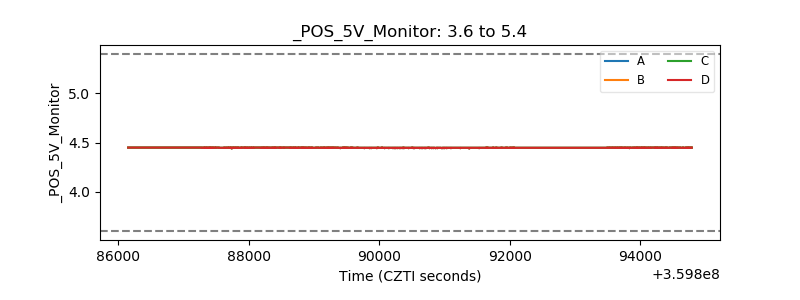 |
| _ROLL_ROT | 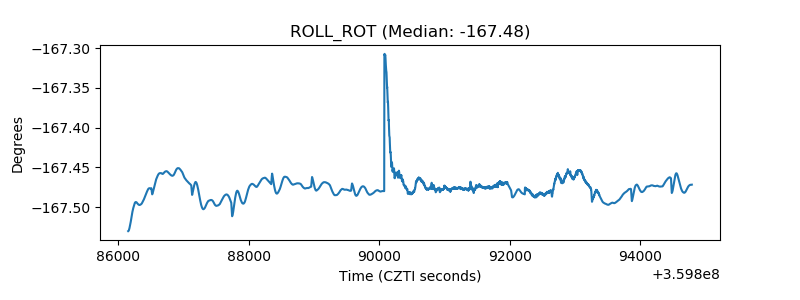 |
| _Roll_DEC | 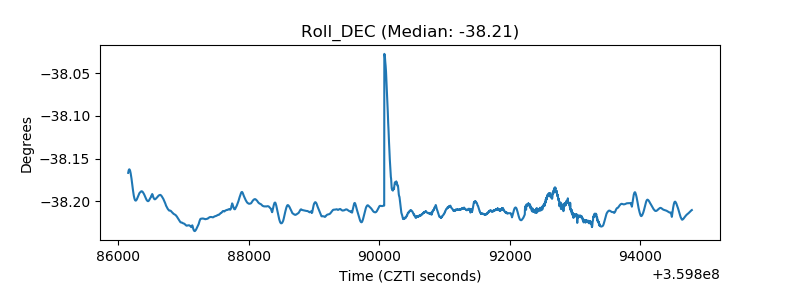 |
| _Roll_RA | 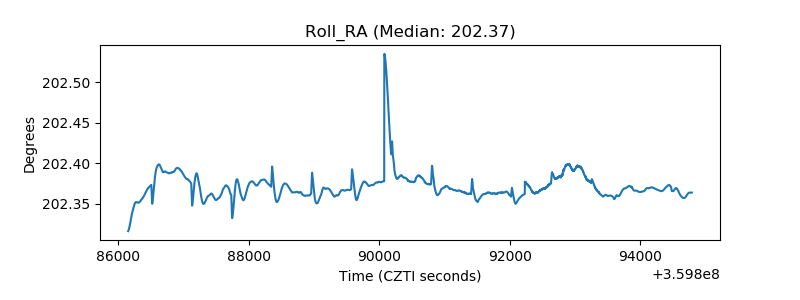 |
| Veto Counter | 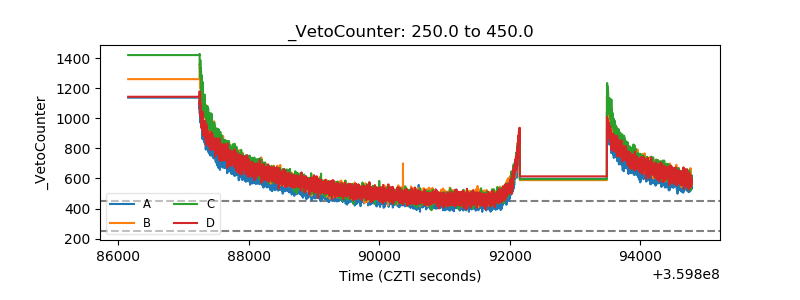 |