| Param | Original file | Final file |
|---|---|---|
| Filename | modeM0/AS1A10_055T01_9000004414_30630cztM0_level2.evt | modeM0/AS1A10_055T01_9000004414_30630cztM0_level2_quad_clean.evt |
| Size (bytes) | 689,601,600 | 103,299,840 |
| Size | 657.7 MB | 98.5 MB |
| Events in quadrant A | 3,410,019 | 714,602 |
| Events in quadrant B | 5,093,384 | 707,790 |
| Events in quadrant C | 3,492,847 | 672,168 |
| Events in quadrant D | 8,478,903 | 609,375 |
| Mode M9 | |||
|---|---|---|---|
| Quadrant | BADHDUFLAG | Total packets | Discarded packets |
| A | 0 | 13 | 0 |
| B | 0 | 13 | 0 |
| C | 0 | 13 | 0 |
| D | 0 | 13 | 0 |
| Mode M0 | |||
|---|---|---|---|
| Quadrant | BADHDUFLAG | Total packets | Discarded packets |
| A | 0 | 13945 | 1 |
| B | 0 | 19043 | 2 |
| C | 0 | 14351 | 1 |
| D | 0 | 29460 | 1 |
| Mode SS | |||
|---|---|---|---|
| Quadrant | BADHDUFLAG | Total packets | Discarded packets |
| A | 0 | 124 | 0 |
| B | 0 | 124 | 0 |
| C | 0 | 124 | 0 |
| D | 0 | 124 | 0 |
| Quadrant | Total seconds | Saturated seconds | Saturation percentage |
|---|---|---|---|
| A | 6073 | 119 | 1.959493% |
| B | 6072 | 193 | 3.178524% |
| C | 6072 | 230 | 3.787879% |
| D | 6072 | 1119 | 18.428854% |
Noise dominated data is calculated using 1-second bins in cleaned event files. If a bin has >2000 counts, and if more than 50% of those come from <1% of pixels, then it is considered to be noise-dominated and hence unusable.
| Quadrant | # 1 sec bins | Bins with >0 counts | Bins with >2000 counts | High rate bins dominated by noise | Noise dominated (total time) | Noise dominated (detector-on time) | Marked lightcurve |
|---|---|---|---|---|---|---|---|
| A | 7363 | 6074 | 0 | 0 | 0.00% | 0.00% |  |
| B | 7362 | 6073 | 1 | 1 | 0.01% | 0.02% |  |
| C | 7362 | 6073 | 13 | 13 | 0.18% | 0.21% |  |
| D | 7362 | 6073 | 953 | 953 | 12.94% | 15.69% | 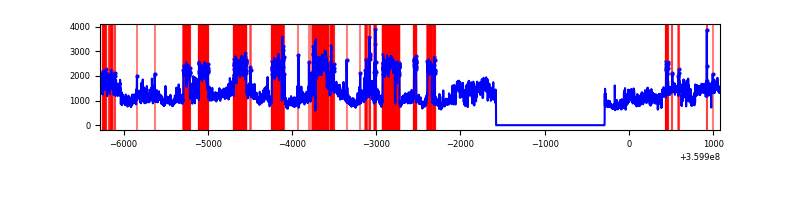 |
Top three noisy pixels from each quadrant. If the there are fewer than three noisy pixels in the level2.evt file, extra rows are filled as -1
| Pixel properties | Quadrant properties | ||||||
|---|---|---|---|---|---|---|---|
| Quadrant | DetID | PixID | Counts | Sigma | Mean | Median | Sigma |
| A | 0 | 13 | 19280 | 107.67 | 876 | 864 | 171.0 |
| A | 13 | 254 | 11417 | 61.7 | 876 | 864 | 171.0 |
| A | 8 | 192 | 11323 | 61.15 | 876 | 864 | 171.0 |
| B | 6 | 159 | 1689803 | 10619.67 | 851 | 833 | 159.0 |
| B | 0 | 190 | 44174 | 272.51 | 851 | 833 | 159.0 |
| B | 12 | 111 | 18289 | 109.76 | 851 | 833 | 159.0 |
| C | 14 | 238 | 137152 | 731.53 | 820 | 828 | 186.4 |
| C | 10 | 22 | 69761 | 369.9 | 820 | 828 | 186.4 |
| C | 0 | 10 | 48745 | 257.13 | 820 | 828 | 186.4 |
| D | 8 | 195 | 4726334 | 25100.9 | 813 | 795 | 188.3 |
| D | 1 | 52 | 247471 | 1310.28 | 813 | 795 | 188.3 |
| D | 10 | 253 | 227575 | 1204.6 | 813 | 795 | 188.3 |
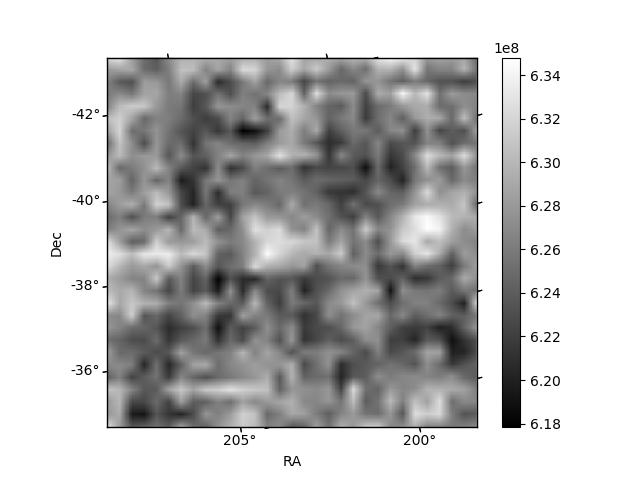
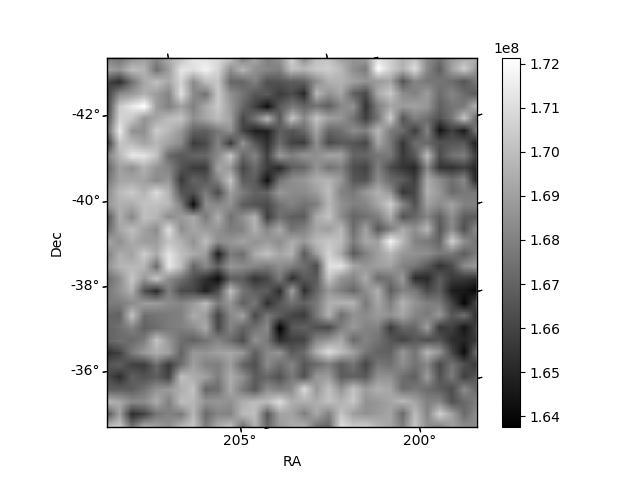
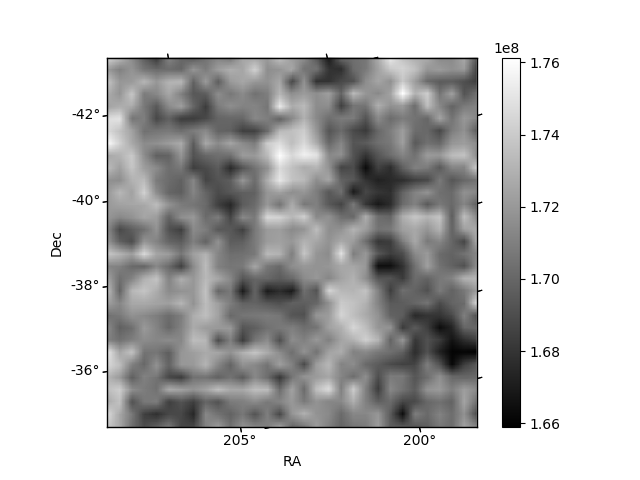
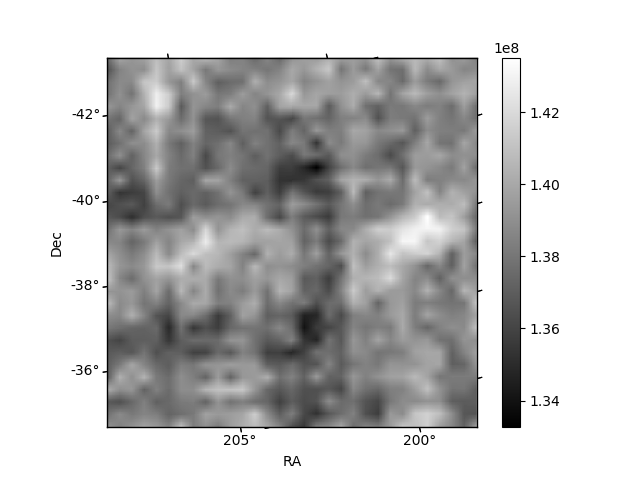
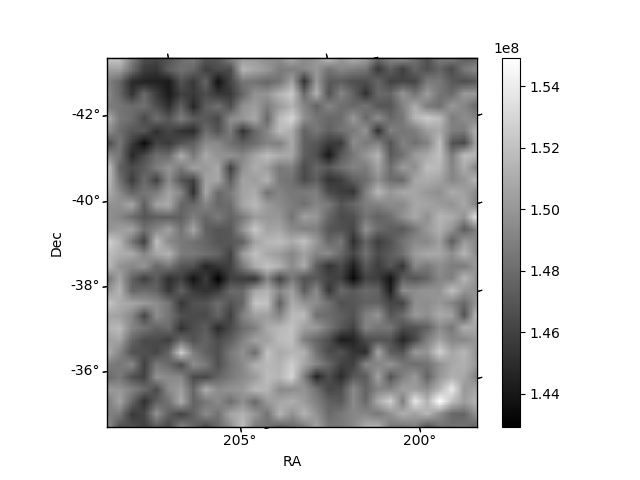
Histogram calculated using DETX and DETY for each event in the final _common_clean file
| Quadrant A | 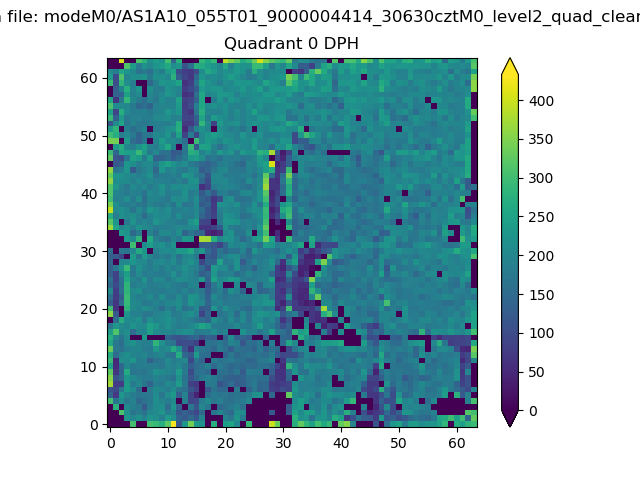 |
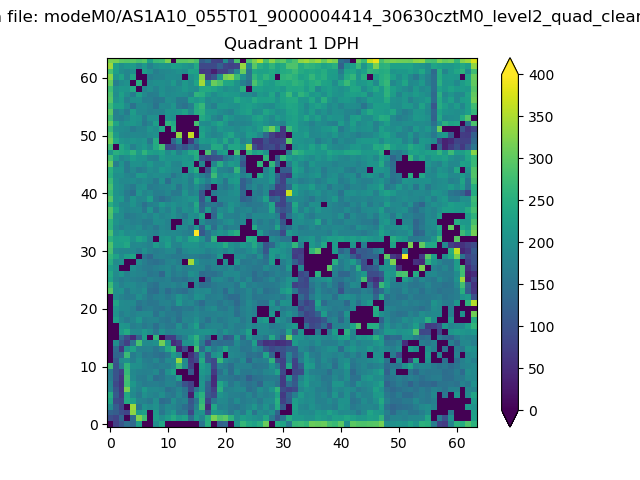 |
Quadrant B |
|---|---|---|---|
| Quadrant D | 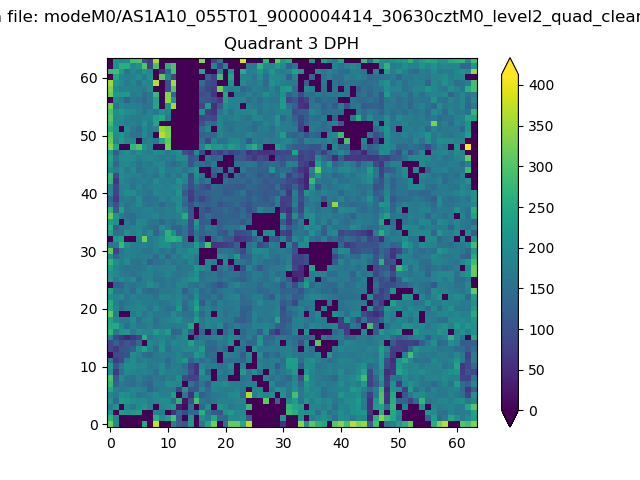 |
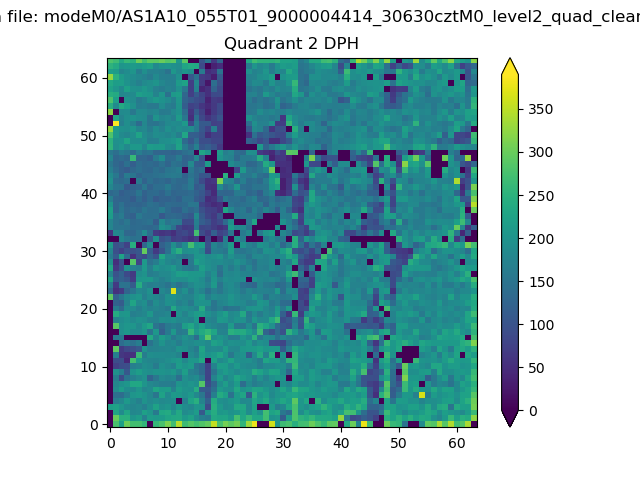 |
Quadrant C |
| Plot type | Count rate plots | Images |
|---|---|---|
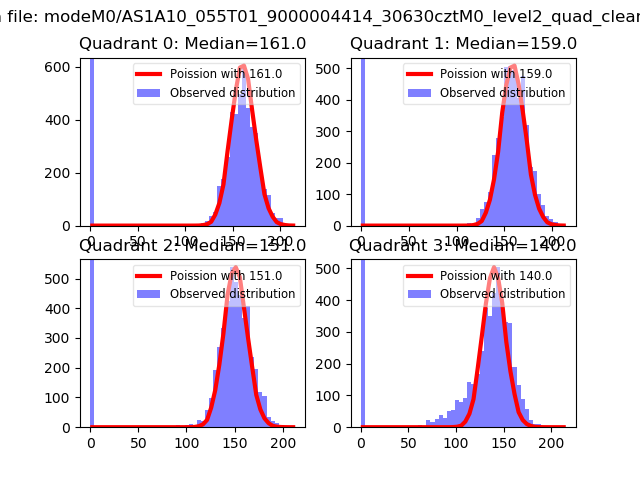
| Comparison with Poisson distribution Blue bars denote a histogram of data divided into 1 sec bins. Red curve is a Poisson curve with rate = median count rate of data. |
 |
 |
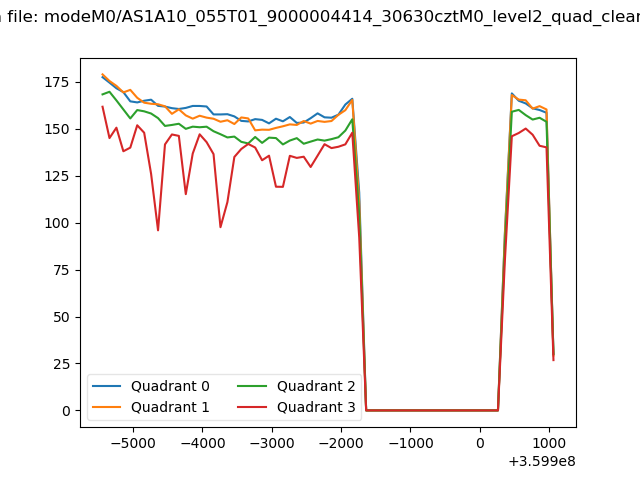
| Quadrant-wise count rates Data is divided into 100 sec bins |
 |
|
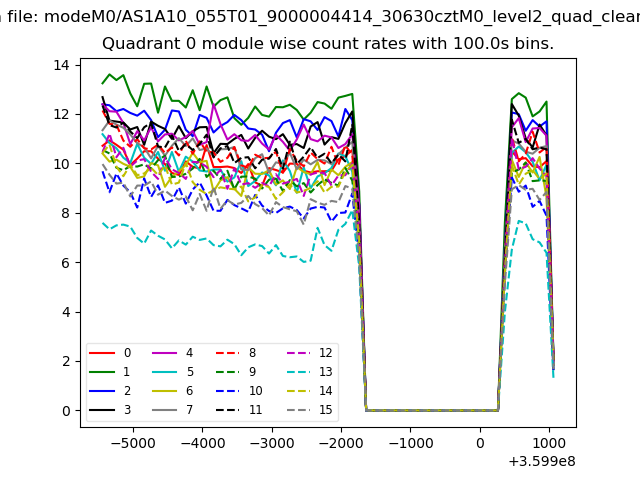
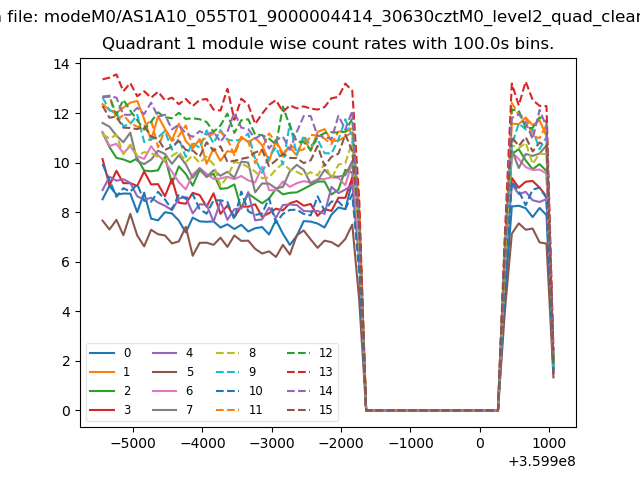
| Module-wise count rates for Quadrant A Data is divided into 100 sec bins |
 |
 |
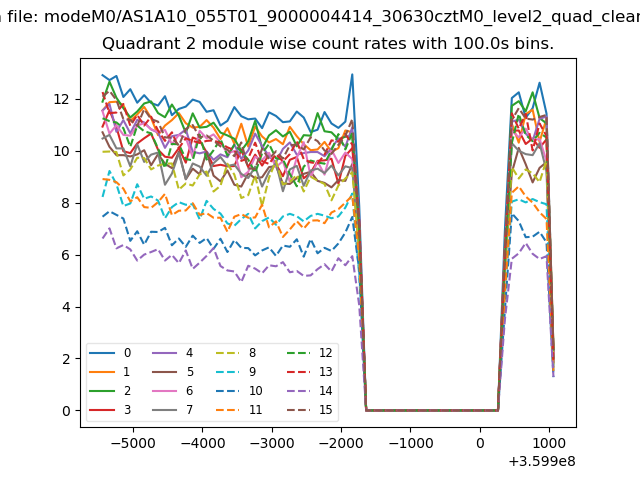
| Module-wise count rates for Quadrant B Data is divided into 100 sec bins |
 |
 |
| Module-wise count rates for Quadrant C Data is divided into 100 sec bins |
 |
 |
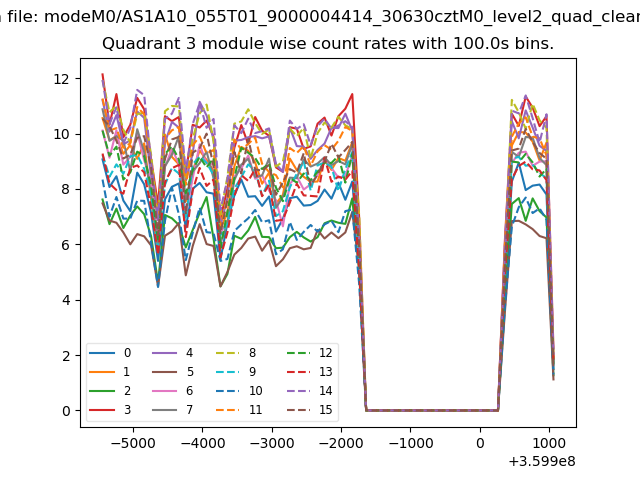
| Module-wise count rates for Quadrant D Data is divided into 100 sec bins |
 |
 |
| Parameter | Plot |
|---|---|
| CZT HV Monitor | 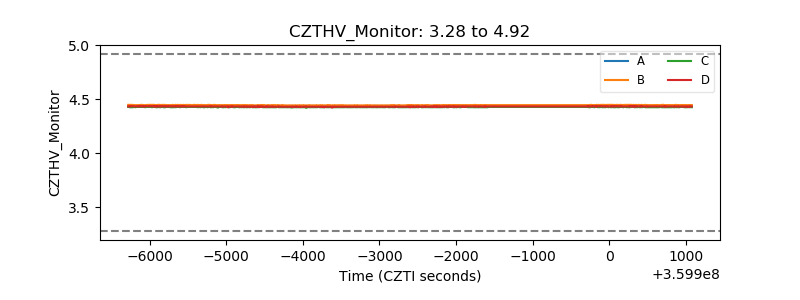 |
| D_VDD | 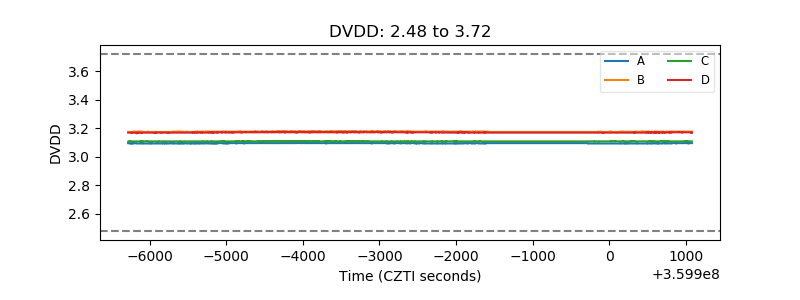 |
| Temperature 1 | 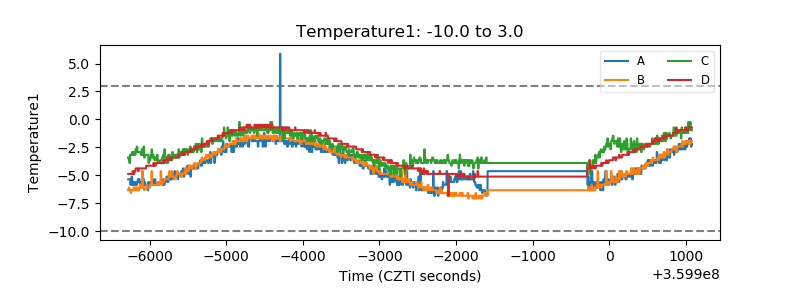 |
| Veto HV Monitor |  |
| Veto LLD | 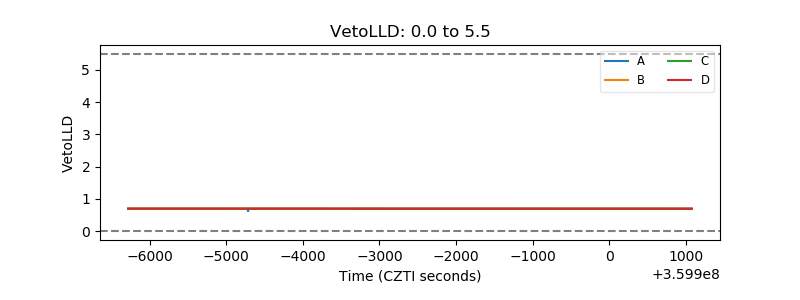 |
| Alpha Counter | 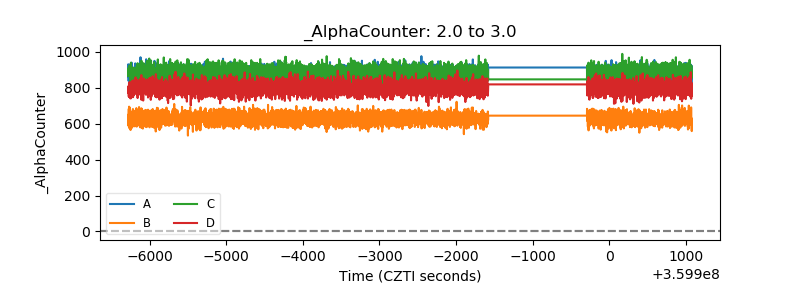 |
| _CPM_Rate | 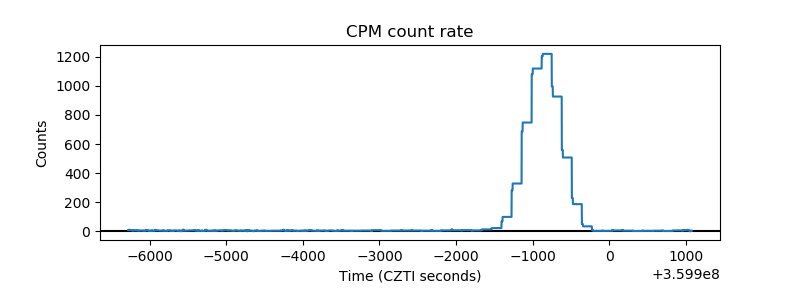 |
| CZT Counter | 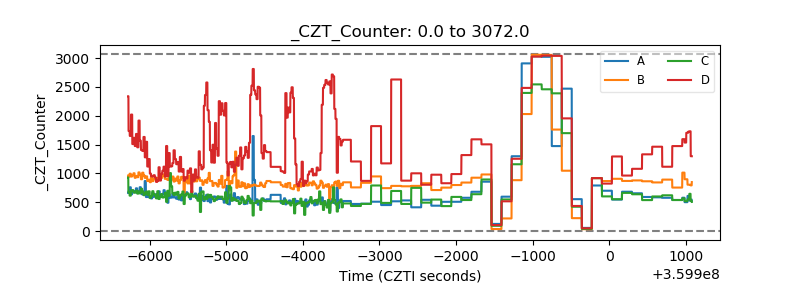 |
| +2.5 Volts monitor |  |
| +5 Volts monitor |  |
| _ROLL_ROT | 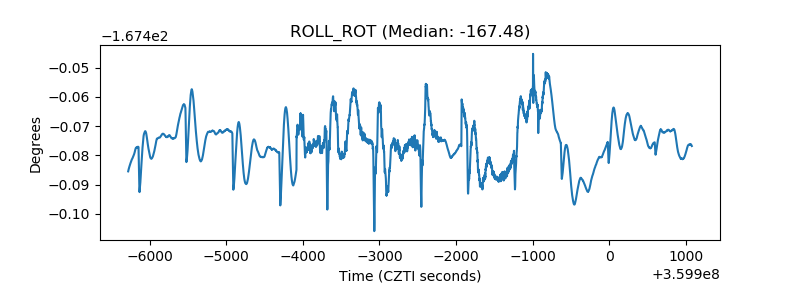 |
| _Roll_DEC |  |
| _Roll_RA | 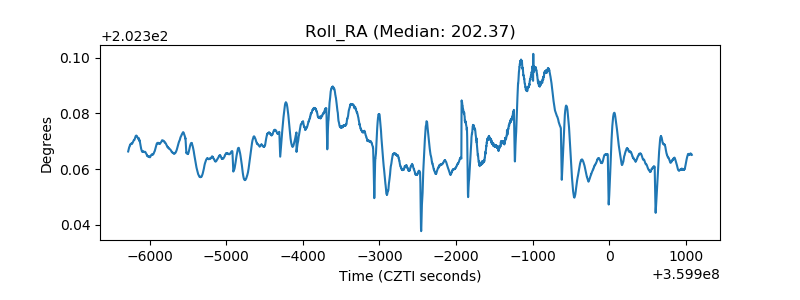 |
| Veto Counter | 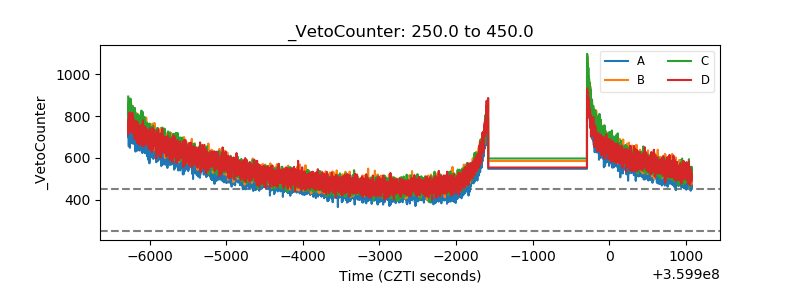 |