| Param | Original file | Final file |
|---|---|---|
| Filename | modeM0/AS1A10_055T01_9000004414_30631cztM0_level2.evt | modeM0/AS1A10_055T01_9000004414_30631cztM0_level2_quad_clean.evt |
| Size (bytes) | 672,963,840 | 106,168,320 |
| Size | 641.8 MB | 101.2 MB |
| Events in quadrant A | 3,439,331 | 731,641 |
| Events in quadrant B | 5,154,583 | 722,846 |
| Events in quadrant C | 3,728,936 | 685,514 |
| Events in quadrant D | 7,630,810 | 633,615 |
| Mode M9 | |||
|---|---|---|---|
| Quadrant | BADHDUFLAG | Total packets | Discarded packets |
| A | 0 | 12 | 0 |
| B | 0 | 12 | 0 |
| C | 0 | 12 | 0 |
| D | 0 | 12 | 0 |
| Mode M0 | |||
|---|---|---|---|
| Quadrant | BADHDUFLAG | Total packets | Discarded packets |
| A | 0 | 14008 | 1 |
| B | 0 | 19547 | 1 |
| C | 0 | 14986 | 1 |
| D | 0 | 27125 | 1 |
| Mode SS | |||
|---|---|---|---|
| Quadrant | BADHDUFLAG | Total packets | Discarded packets |
| A | 0 | 126 | 0 |
| B | 0 | 126 | 0 |
| C | 0 | 126 | 0 |
| D | 0 | 126 | 0 |
| Quadrant | Total seconds | Saturated seconds | Saturation percentage |
|---|---|---|---|
| A | 6337 | 133 | 2.098785% |
| B | 6338 | 223 | 3.518460% |
| C | 6338 | 275 | 4.338908% |
| D | 6338 | 852 | 13.442726% |
Noise dominated data is calculated using 1-second bins in cleaned event files. If a bin has >2000 counts, and if more than 50% of those come from <1% of pixels, then it is considered to be noise-dominated and hence unusable.
| Quadrant | # 1 sec bins | Bins with >0 counts | Bins with >2000 counts | High rate bins dominated by noise | Noise dominated (total time) | Noise dominated (detector-on time) | Marked lightcurve |
|---|---|---|---|---|---|---|---|
| A | 7447 | 6338 | 7 | 7 | 0.09% | 0.11% | 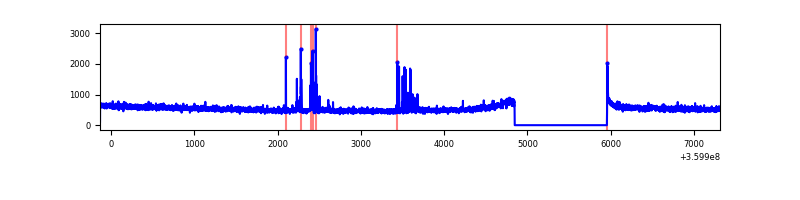 |
| B | 7448 | 6339 | 20 | 20 | 0.27% | 0.32% | 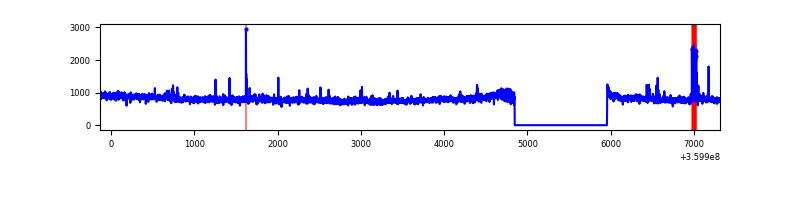 |
| C | 7448 | 6339 | 43 | 43 | 0.58% | 0.68% |  |
| D | 7448 | 6339 | 804 | 804 | 10.79% | 12.68% | 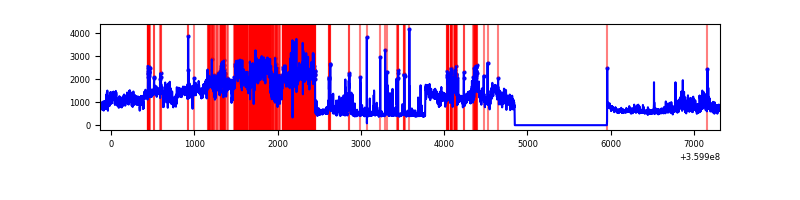 |
Top three noisy pixels from each quadrant. If the there are fewer than three noisy pixels in the level2.evt file, extra rows are filled as -1
| Pixel properties | Quadrant properties | ||||||
|---|---|---|---|---|---|---|---|
| Quadrant | DetID | PixID | Counts | Sigma | Mean | Median | Sigma |
| A | 0 | 13 | 90652 | 522.79 | 865 | 852 | 171.8 |
| A | 8 | 192 | 13230 | 72.06 | 865 | 852 | 171.8 |
| A | 13 | 254 | 12604 | 68.42 | 865 | 852 | 171.8 |
| B | 6 | 159 | 1727762 | 10857.04 | 841 | 822 | 159.1 |
| B | 6 | 36 | 62525 | 387.92 | 841 | 822 | 159.1 |
| B | 12 | 111 | 18867 | 113.45 | 841 | 822 | 159.1 |
| C | 3 | 233 | 245285 | 1328.25 | 805 | 813 | 184.1 |
| C | 10 | 22 | 138992 | 750.75 | 805 | 813 | 184.1 |
| C | 14 | 238 | 134472 | 726.19 | 805 | 813 | 184.1 |
| D | 8 | 195 | 3741675 | 19859.59 | 804 | 786 | 188.4 |
| D | 12 | 218 | 226140 | 1196.36 | 804 | 786 | 188.4 |
| D | 13 | 249 | 206551 | 1092.36 | 804 | 786 | 188.4 |
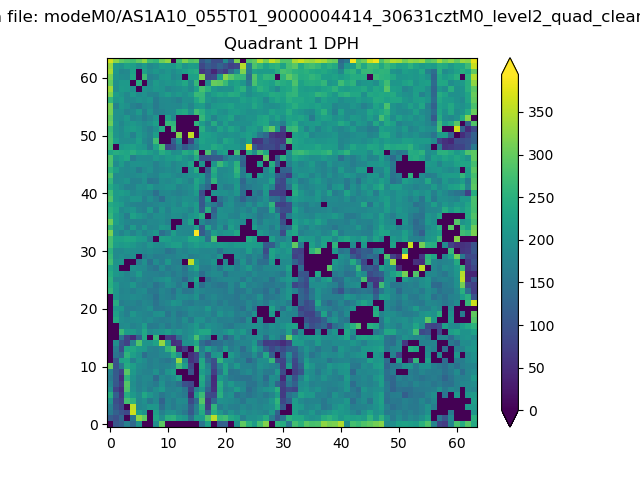
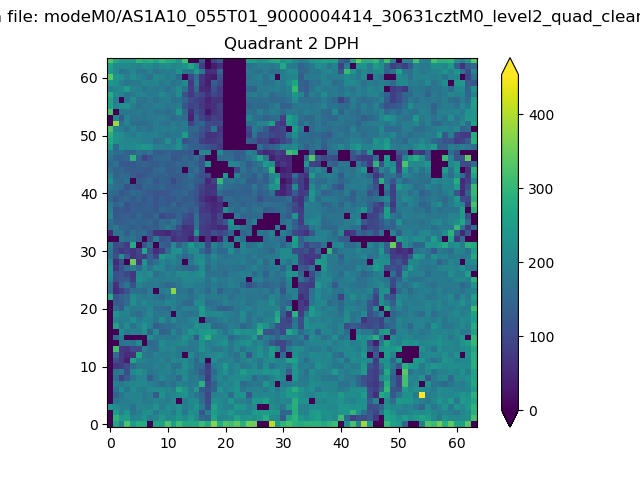
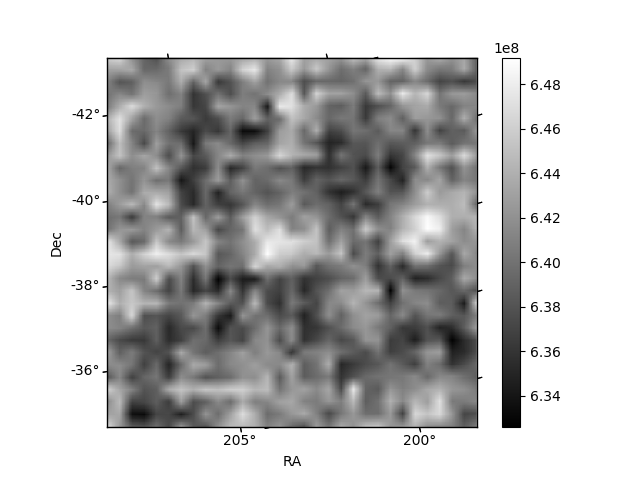
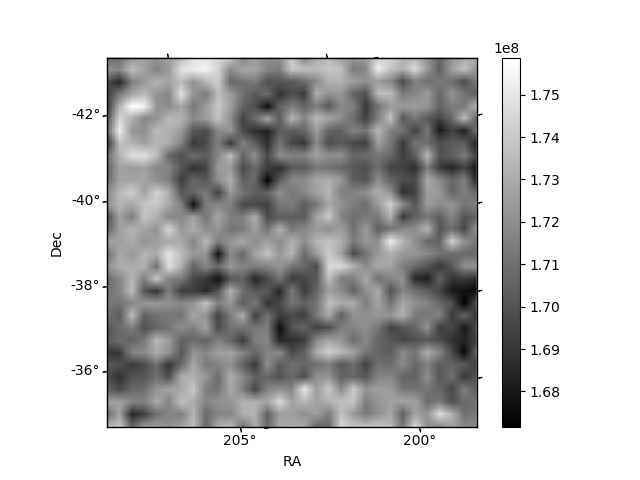
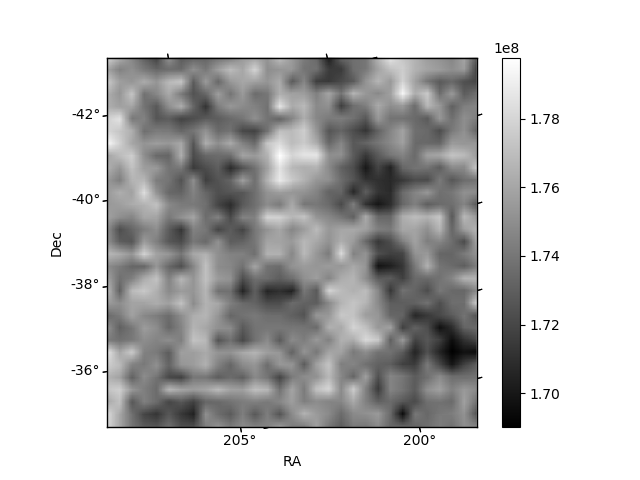
Histogram calculated using DETX and DETY for each event in the final _common_clean file
| Quadrant A | 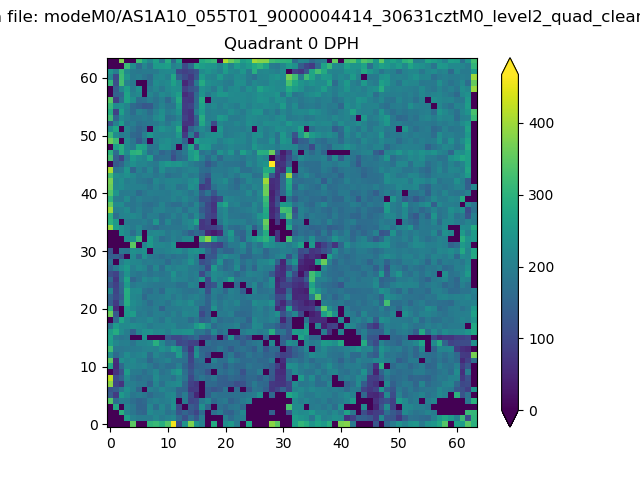 |
 |
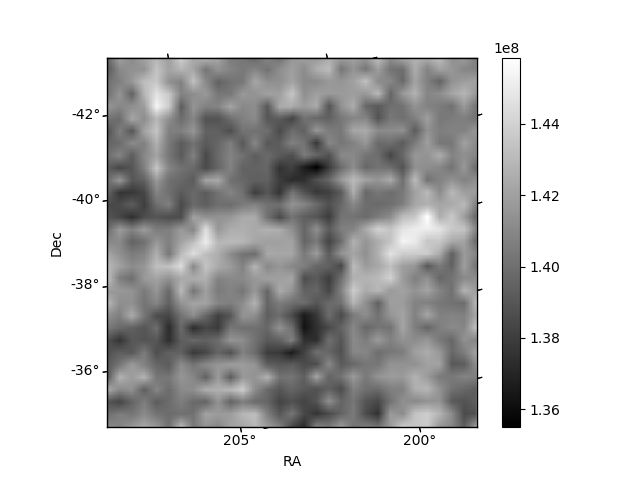
Quadrant B |
|---|---|---|---|
| Quadrant D | 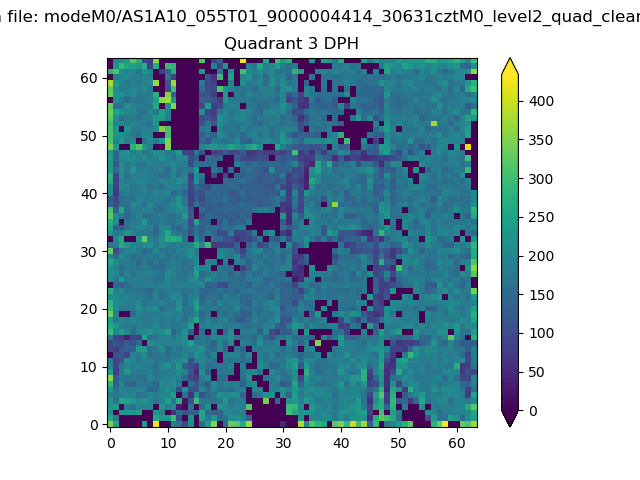 |
 |
Quadrant C |
| Plot type | Count rate plots | Images |
|---|---|---|
| Comparison with Poisson distribution Blue bars denote a histogram of data divided into 1 sec bins. Red curve is a Poisson curve with rate = median count rate of data. |
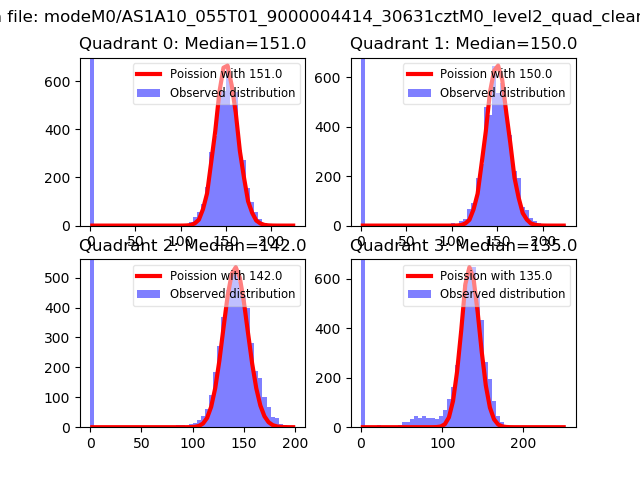 |
 |
| Quadrant-wise count rates Data is divided into 100 sec bins |
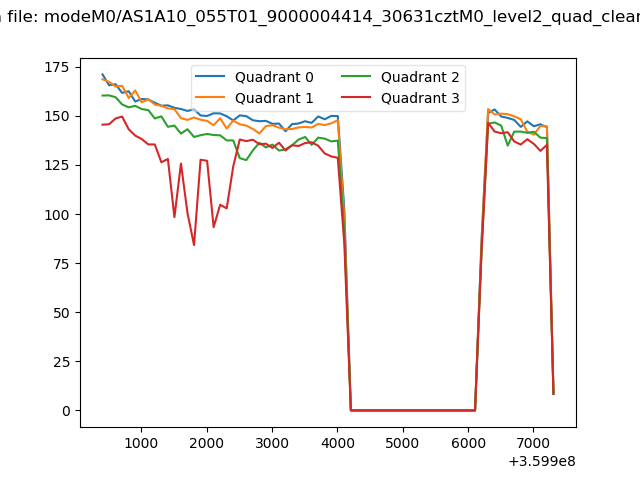 |
|
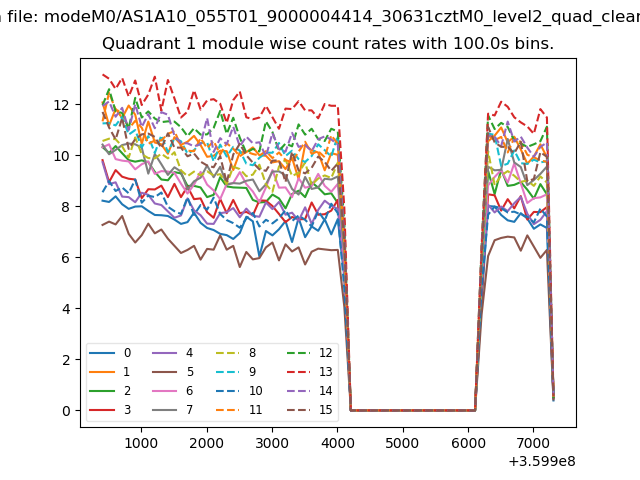
| Module-wise count rates for Quadrant A Data is divided into 100 sec bins |
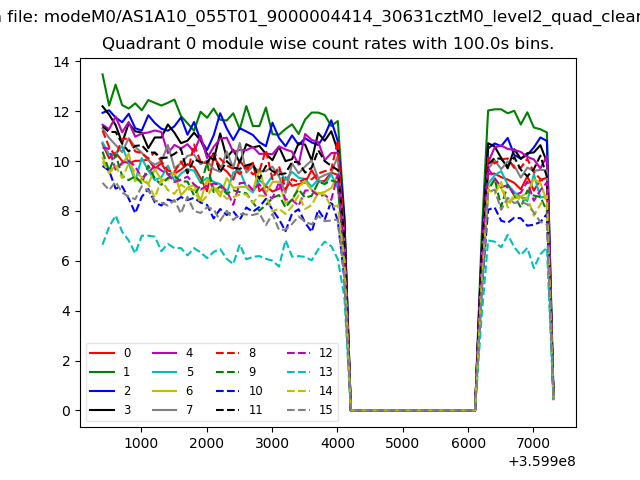 |
 |
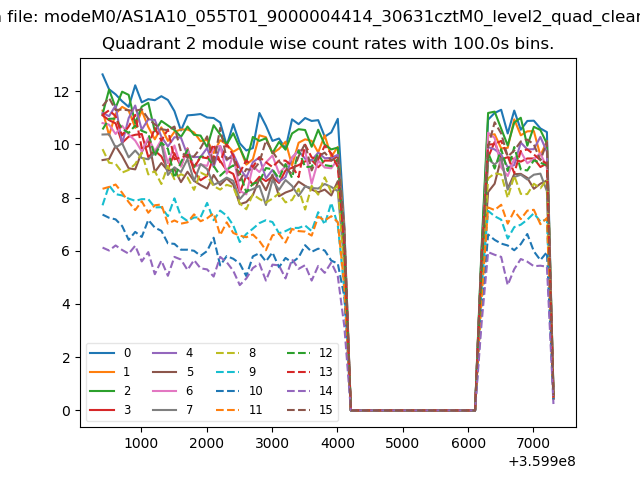
| Module-wise count rates for Quadrant B Data is divided into 100 sec bins |
 |
 |
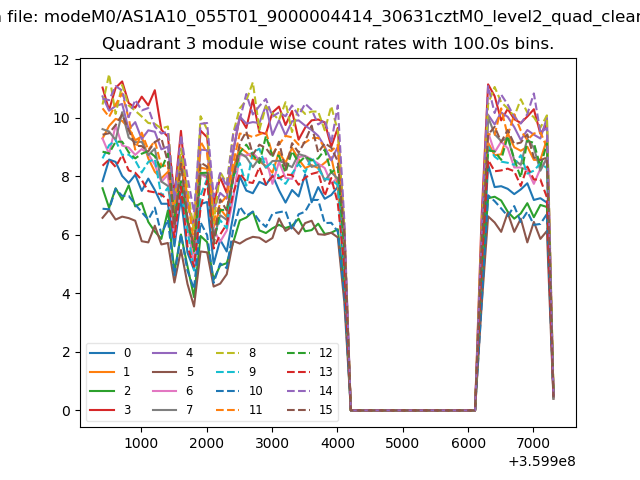
| Module-wise count rates for Quadrant C Data is divided into 100 sec bins |
 |
 |
| Module-wise count rates for Quadrant D Data is divided into 100 sec bins |
 |
 |
| Parameter | Plot |
|---|---|
| CZT HV Monitor | 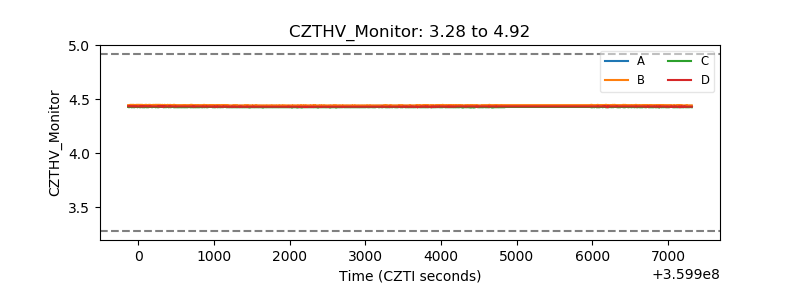 |
| D_VDD | 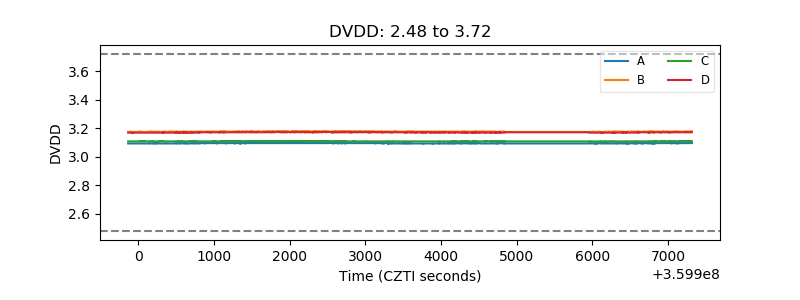 |
| Temperature 1 | 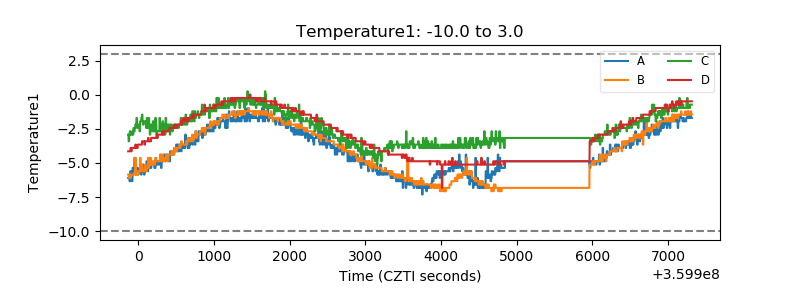 |
| Veto HV Monitor | 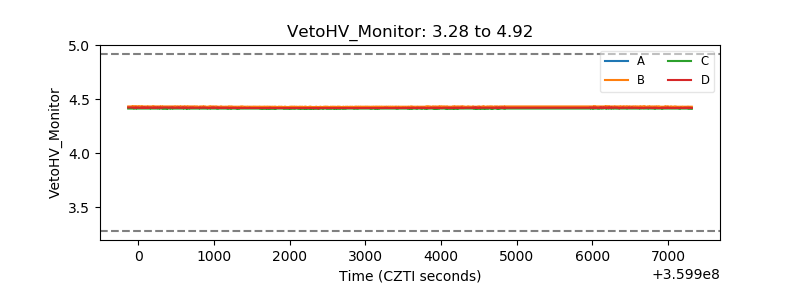 |
| Veto LLD | 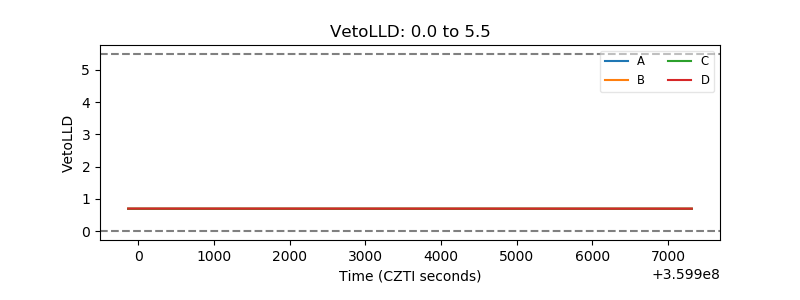 |
| Alpha Counter | 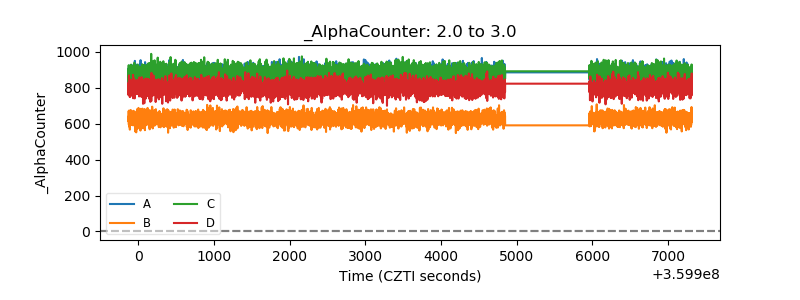 |
| _CPM_Rate | 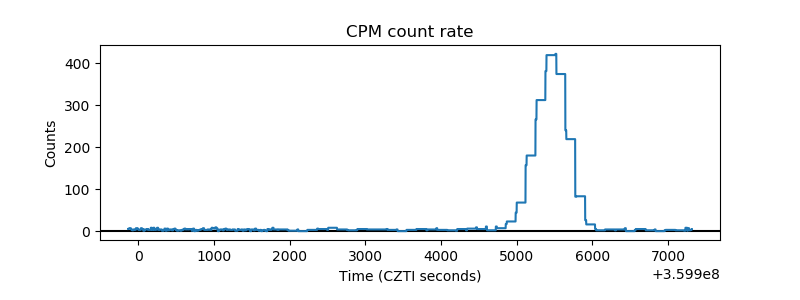 |
| CZT Counter | 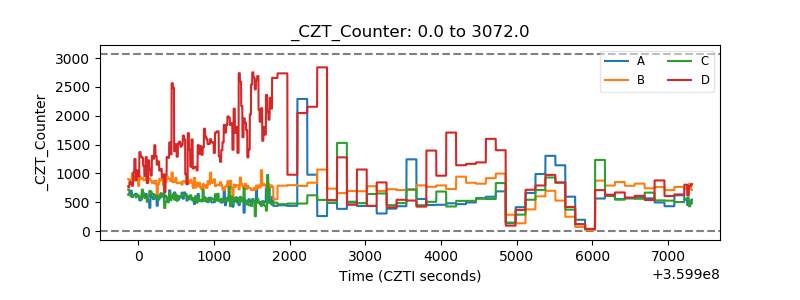 |
| +2.5 Volts monitor |  |
| +5 Volts monitor |  |
| _ROLL_ROT | 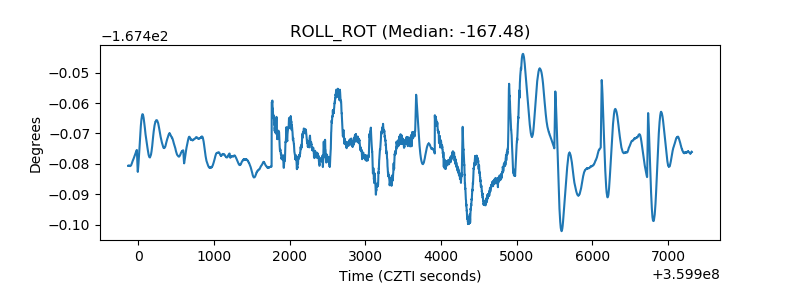 |
| _Roll_DEC |  |
| _Roll_RA | 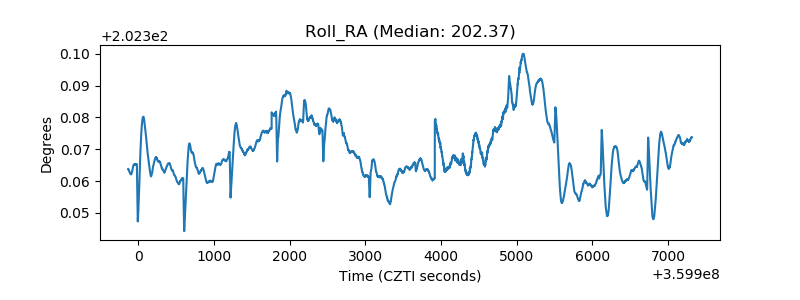 |
| Veto Counter | 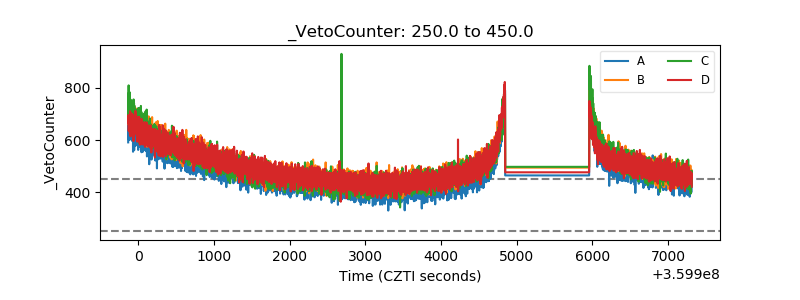 |