| Param | Original file | Final file |
|---|---|---|
| Filename | modeM0/AS1A10_055T01_9000004414_30632cztM0_level2.evt | modeM0/AS1A10_055T01_9000004414_30632cztM0_level2_quad_clean.evt |
| Size (bytes) | 662,463,360 | 107,328,960 |
| Size | 631.8 MB | 102.4 MB |
| Events in quadrant A | 3,454,044 | 731,299 |
| Events in quadrant B | 5,339,439 | 725,418 |
| Events in quadrant C | 3,732,827 | 686,423 |
| Events in quadrant D | 7,078,892 | 635,258 |
| Mode M9 | |||
|---|---|---|---|
| Quadrant | BADHDUFLAG | Total packets | Discarded packets |
| A | 0 | 8 | 0 |
| B | 0 | 8 | 0 |
| C | 0 | 8 | 0 |
| D | 0 | 8 | 0 |
| Mode M0 | |||
|---|---|---|---|
| Quadrant | BADHDUFLAG | Total packets | Discarded packets |
| A | 0 | 14334 | 2 |
| B | 0 | 20737 | 2 |
| C | 0 | 15335 | 2 |
| D | 0 | 25878 | 4 |
| Mode SS | |||
|---|---|---|---|
| Quadrant | BADHDUFLAG | Total packets | Discarded packets |
| A | 0 | 136 | 0 |
| B | 0 | 136 | 0 |
| C | 0 | 136 | 0 |
| D | 0 | 136 | 0 |
| Quadrant | Total seconds | Saturated seconds | Saturation percentage |
|---|---|---|---|
| A | 6776 | 98 | 1.446281% |
| B | 6776 | 180 | 2.656434% |
| C | 6776 | 326 | 4.811098% |
| D | 6775 | 718 | 10.597786% |
Noise dominated data is calculated using 1-second bins in cleaned event files. If a bin has >2000 counts, and if more than 50% of those come from <1% of pixels, then it is considered to be noise-dominated and hence unusable.
| Quadrant | # 1 sec bins | Bins with >0 counts | Bins with >2000 counts | High rate bins dominated by noise | Noise dominated (total time) | Noise dominated (detector-on time) | Marked lightcurve |
|---|---|---|---|---|---|---|---|
| A | 7526 | 6777 | 1 | 1 | 0.01% | 0.01% | 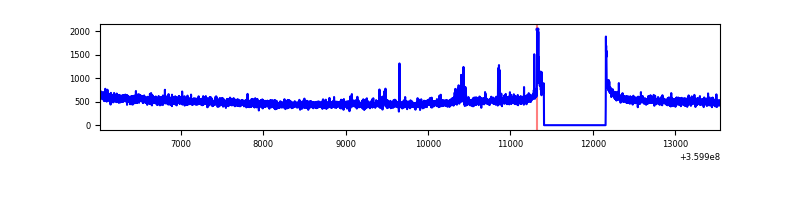 |
| B | 7526 | 6777 | 21 | 21 | 0.28% | 0.31% | 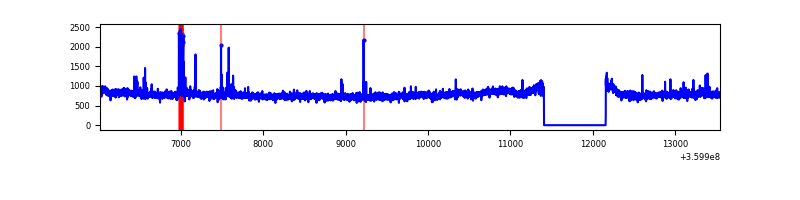 |
| C | 7526 | 6777 | 22 | 22 | 0.29% | 0.32% | 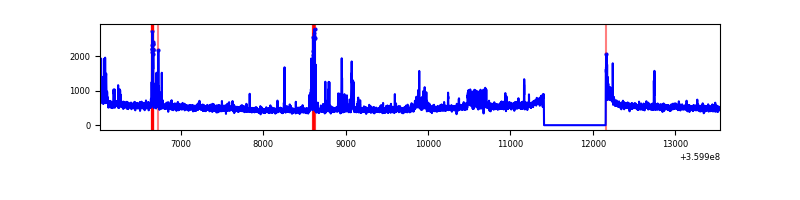 |
| D | 7525 | 6776 | 751 | 751 | 9.98% | 11.08% | 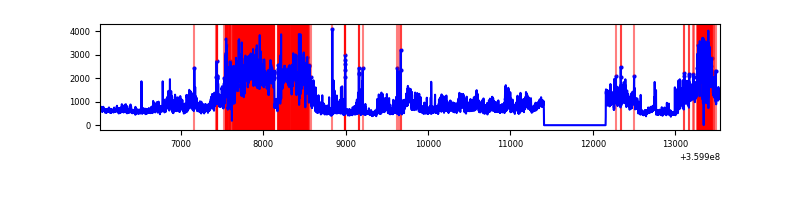 |
Top three noisy pixels from each quadrant. If the there are fewer than three noisy pixels in the level2.evt file, extra rows are filled as -1
| Pixel properties | Quadrant properties | ||||||
|---|---|---|---|---|---|---|---|
| Quadrant | DetID | PixID | Counts | Sigma | Mean | Median | Sigma |
| A | 0 | 13 | 65789 | 370.91 | 875 | 859 | 175.1 |
| A | 13 | 254 | 12926 | 68.93 | 875 | 859 | 175.1 |
| A | 8 | 192 | 10805 | 56.82 | 875 | 859 | 175.1 |
| B | 6 | 159 | 1847380 | 11267.33 | 859 | 840 | 163.9 |
| B | 6 | 36 | 61790 | 371.91 | 859 | 840 | 163.9 |
| B | 12 | 111 | 19811 | 115.76 | 859 | 840 | 163.9 |
| C | 10 | 22 | 194107 | 1020.09 | 814 | 820 | 189.5 |
| C | 14 | 238 | 180514 | 948.36 | 814 | 820 | 189.5 |
| C | 14 | 254 | 65862 | 343.27 | 814 | 820 | 189.5 |
| D | 8 | 195 | 2777893 | 14565.61 | 813 | 794 | 190.7 |
| D | 13 | 249 | 742286 | 3889.05 | 813 | 794 | 190.7 |
| D | 12 | 218 | 234671 | 1226.66 | 813 | 794 | 190.7 |
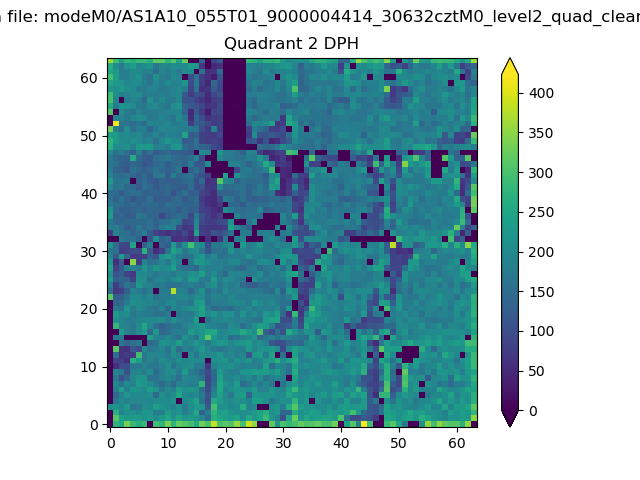
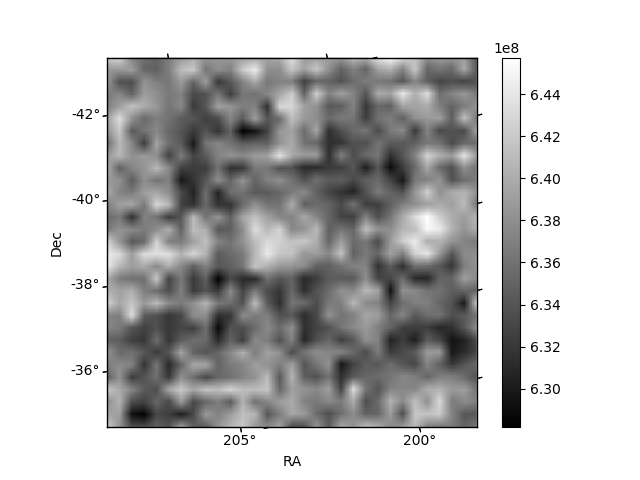
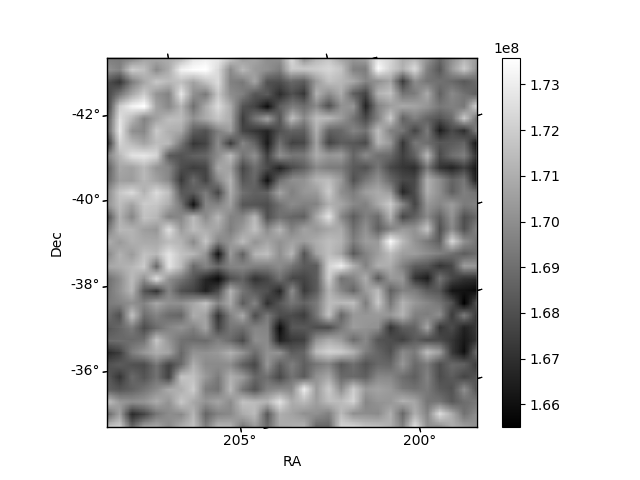
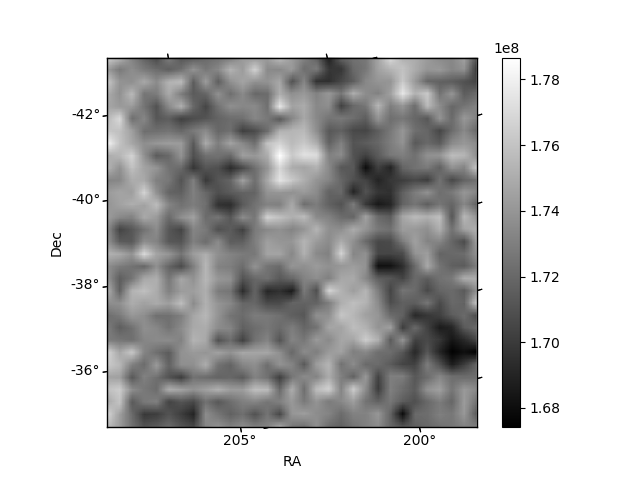
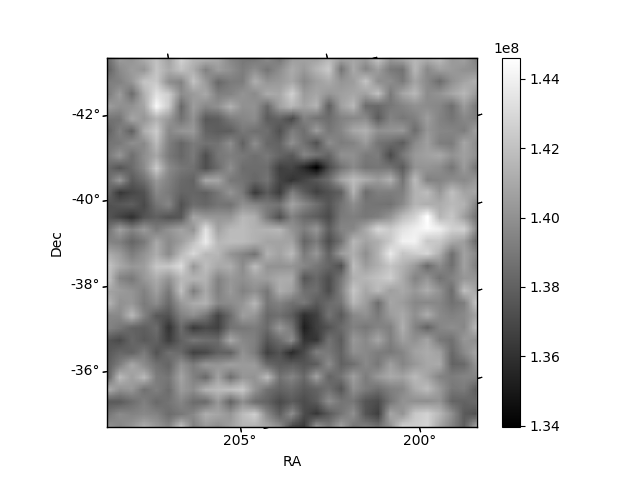
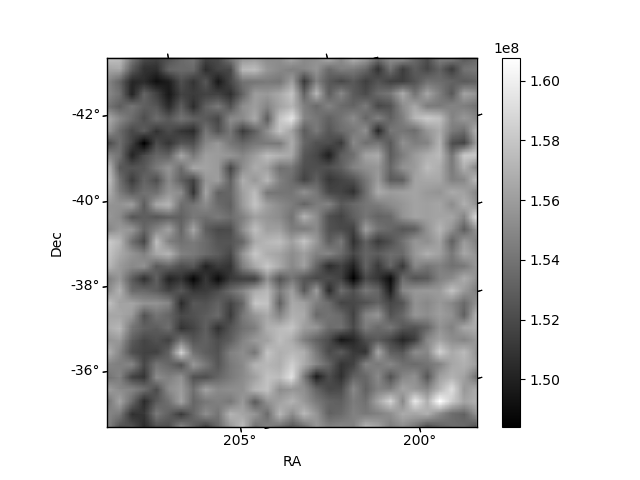
Histogram calculated using DETX and DETY for each event in the final _common_clean file
| Quadrant A | 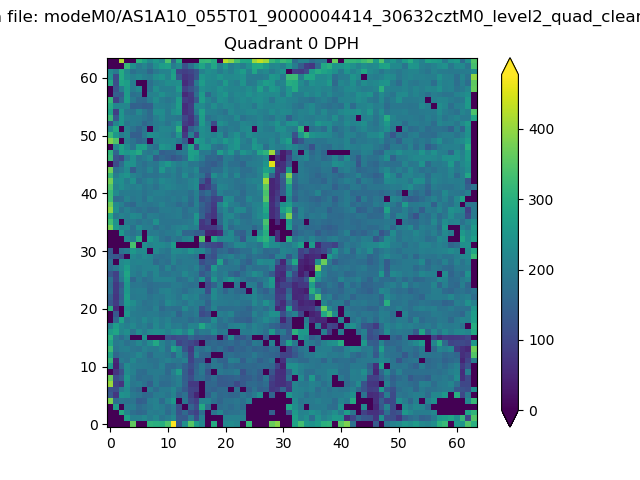 |
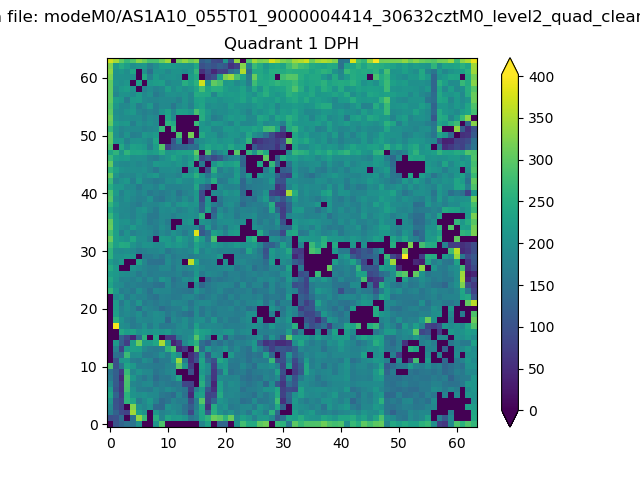 |
Quadrant B |
|---|---|---|---|
| Quadrant D | 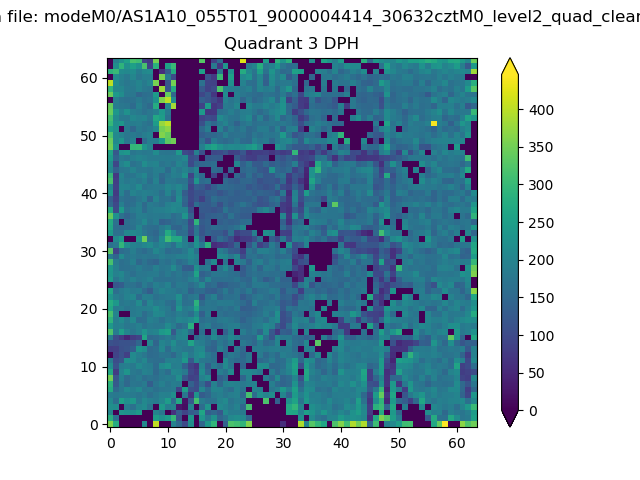 |
 |
Quadrant C |
| Plot type | Count rate plots | Images |
|---|---|---|
| Comparison with Poisson distribution Blue bars denote a histogram of data divided into 1 sec bins. Red curve is a Poisson curve with rate = median count rate of data. |
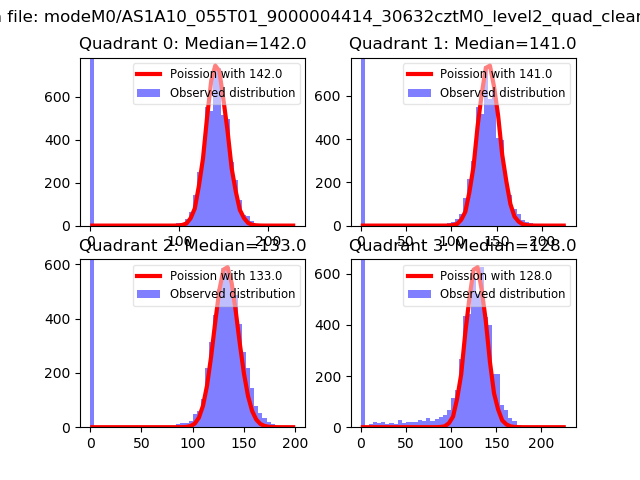 |
 |
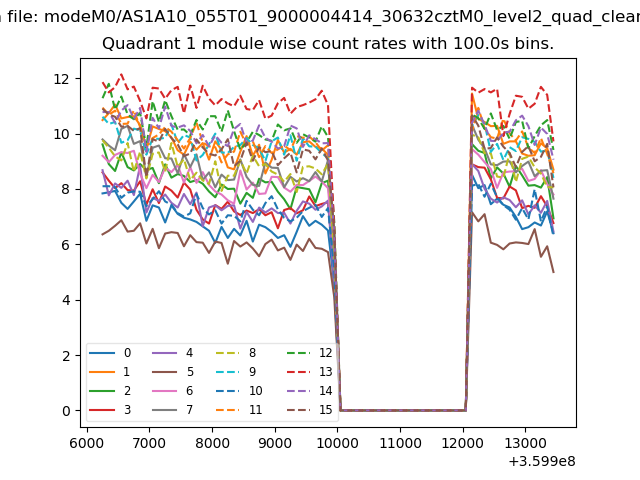
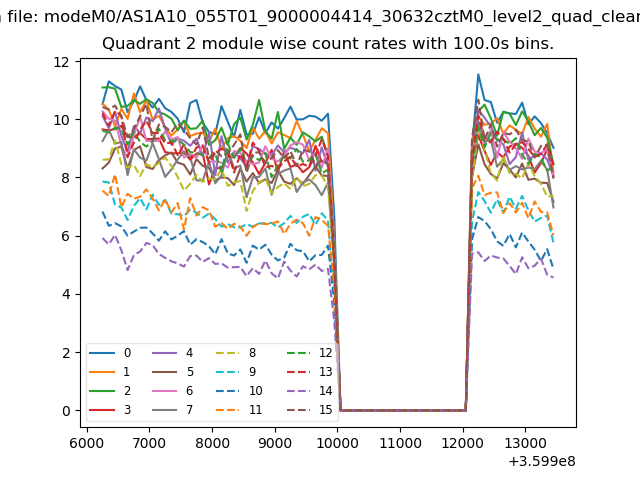
| Quadrant-wise count rates Data is divided into 100 sec bins |
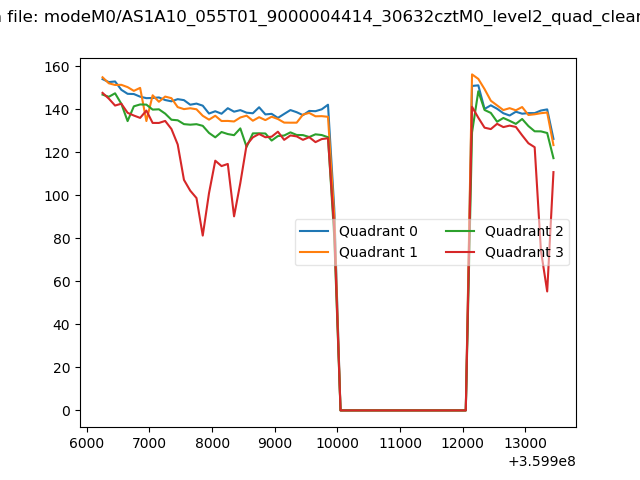 |
|
| Module-wise count rates for Quadrant A Data is divided into 100 sec bins |
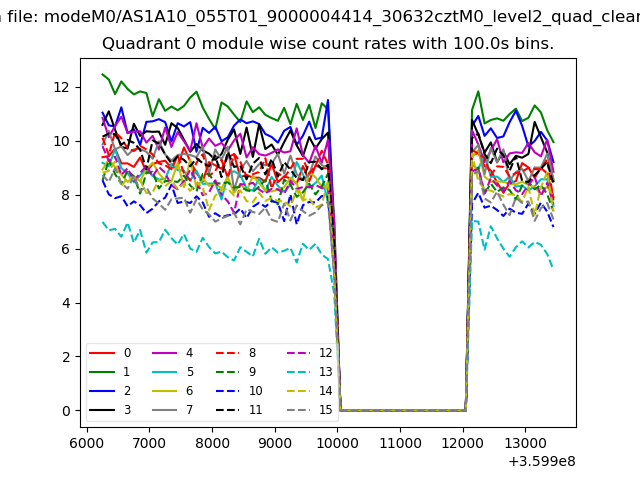 |
 |
| Module-wise count rates for Quadrant B Data is divided into 100 sec bins |
 |
 |
| Module-wise count rates for Quadrant C Data is divided into 100 sec bins |
 |
 |
| Module-wise count rates for Quadrant D Data is divided into 100 sec bins |
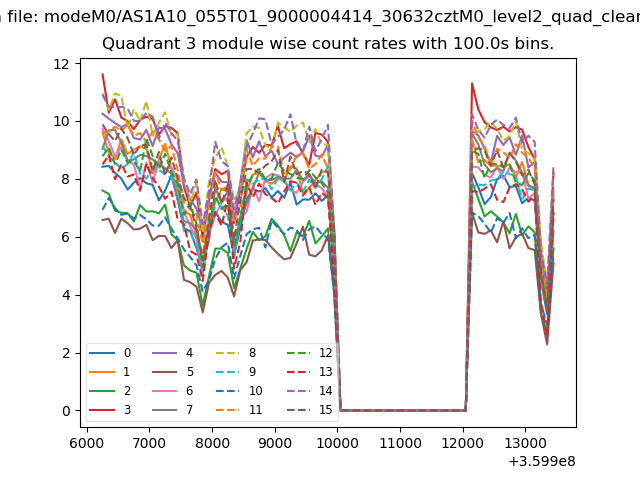 |
 |
| Parameter | Plot |
|---|---|
| CZT HV Monitor | 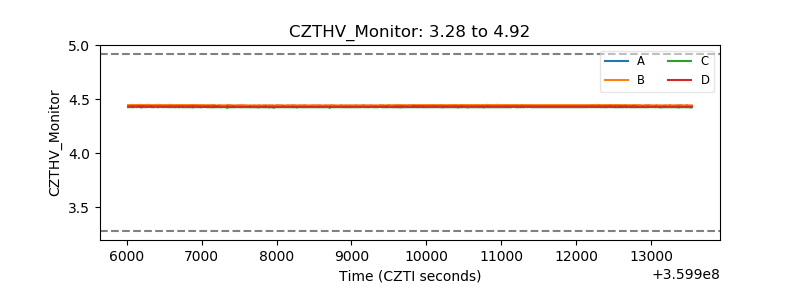 |
| D_VDD | 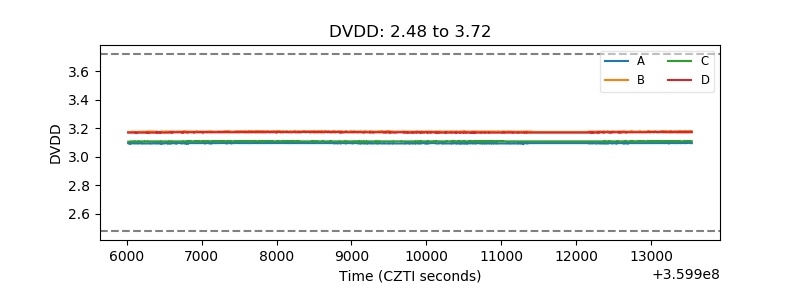 |
| Temperature 1 | 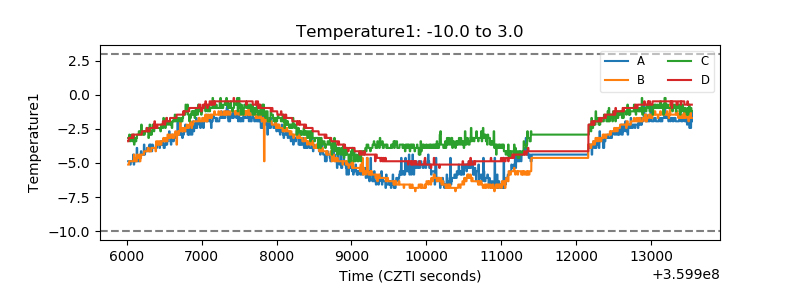 |
| Veto HV Monitor | 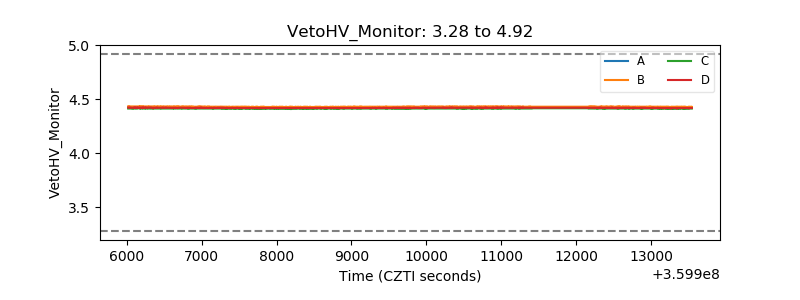 |
| Veto LLD | 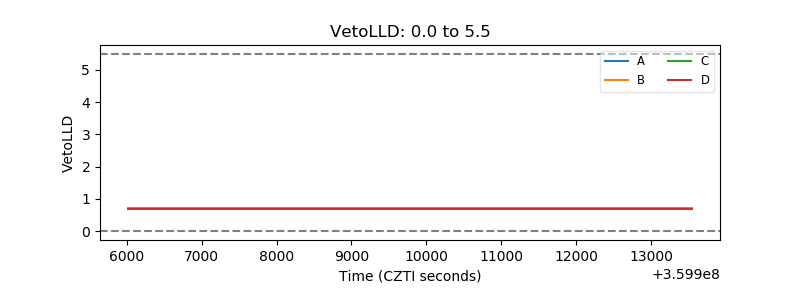 |
| Alpha Counter | 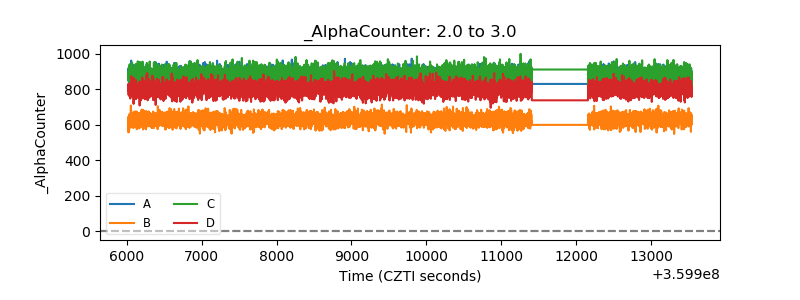 |
| _CPM_Rate | 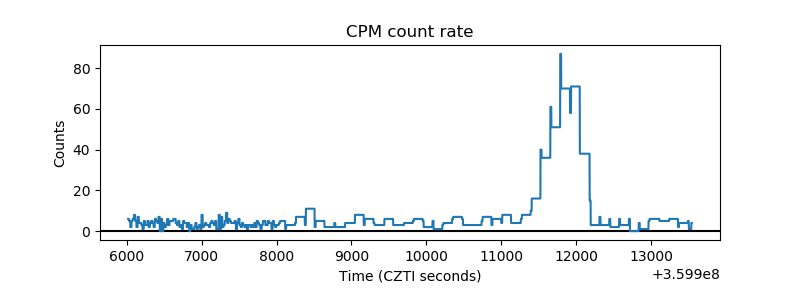 |
| CZT Counter | 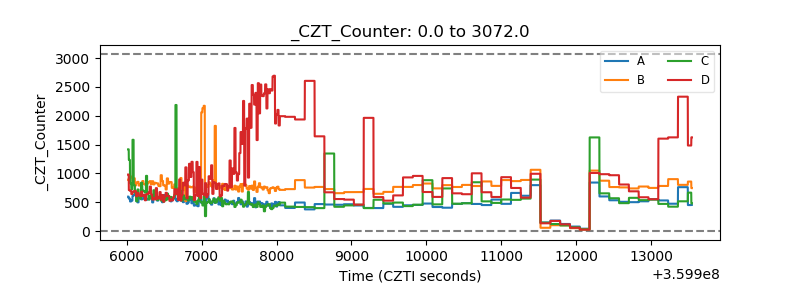 |
| +2.5 Volts monitor | 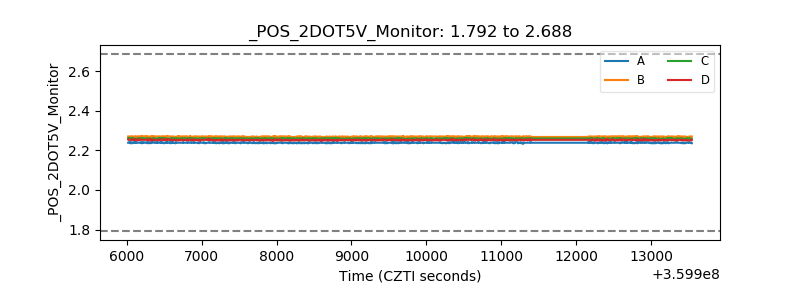 |
| +5 Volts monitor |  |
| _ROLL_ROT | 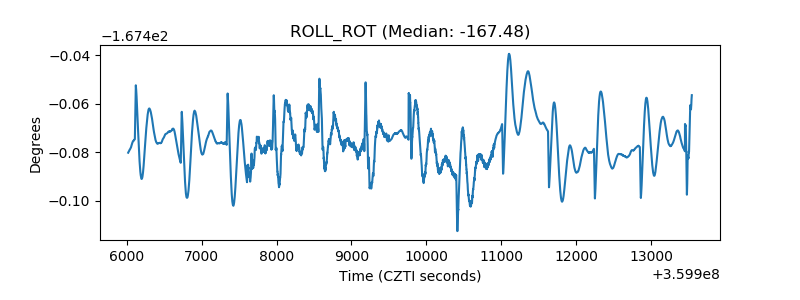 |
| _Roll_DEC | 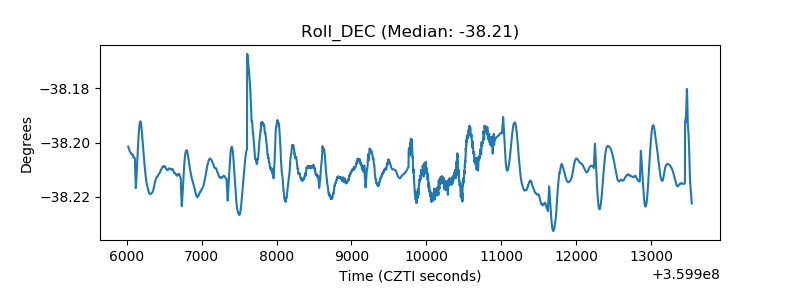 |
| _Roll_RA | 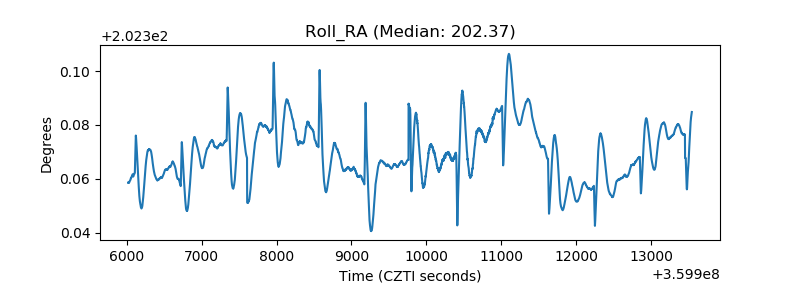 |
| Veto Counter | 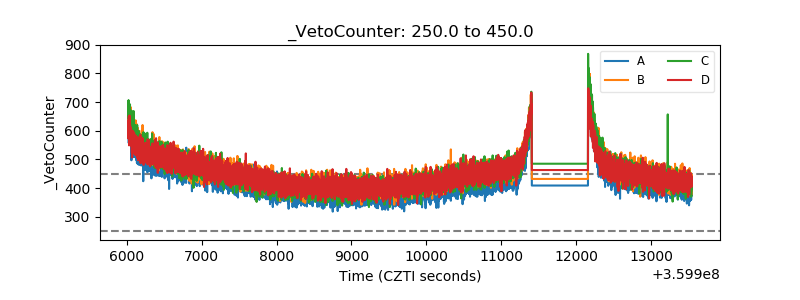 |