| Param | Original file | Final file |
|---|---|---|
| Filename | modeM0/AS1A10_055T01_9000004414_30633cztM0_level2.evt | modeM0/AS1A10_055T01_9000004414_30633cztM0_level2_quad_clean.evt |
| Size (bytes) | 727,989,120 | 116,075,520 |
| Size | 694.3 MB | 110.7 MB |
| Events in quadrant A | 3,865,596 | 778,033 |
| Events in quadrant B | 6,099,746 | 771,196 |
| Events in quadrant C | 3,974,866 | 734,863 |
| Events in quadrant D | 7,582,480 | 690,703 |
| Mode M9 | |||
|---|---|---|---|
| Quadrant | BADHDUFLAG | Total packets | Discarded packets |
| A | 0 | 2 | 0 |
| B | 0 | 3 | 0 |
| C | 0 | 3 | 0 |
| D | 0 | 3 | 0 |
| Mode M0 | |||
|---|---|---|---|
| Quadrant | BADHDUFLAG | Total packets | Discarded packets |
| A | 0 | 16358 | 2 |
| B | 0 | 23749 | 2 |
| C | 0 | 16704 | 2 |
| D | 0 | 27878 | 2 |
| Mode SS | |||
|---|---|---|---|
| Quadrant | BADHDUFLAG | Total packets | Discarded packets |
| A | 0 | 158 | 0 |
| B | 0 | 158 | 0 |
| C | 0 | 158 | 0 |
| D | 0 | 158 | 0 |
| Quadrant | Total seconds | Saturated seconds | Saturation percentage |
|---|---|---|---|
| A | 7769 | 93 | 1.197065% |
| B | 7768 | 229 | 2.947992% |
| C | 7768 | 160 | 2.059732% |
| D | 7768 | 528 | 6.797116% |
Noise dominated data is calculated using 1-second bins in cleaned event files. If a bin has >2000 counts, and if more than 50% of those come from <1% of pixels, then it is considered to be noise-dominated and hence unusable.
| Quadrant | # 1 sec bins | Bins with >0 counts | Bins with >2000 counts | High rate bins dominated by noise | Noise dominated (total time) | Noise dominated (detector-on time) | Marked lightcurve |
|---|---|---|---|---|---|---|---|
| A | 8044 | 7769 | 4 | 4 | 0.05% | 0.05% | 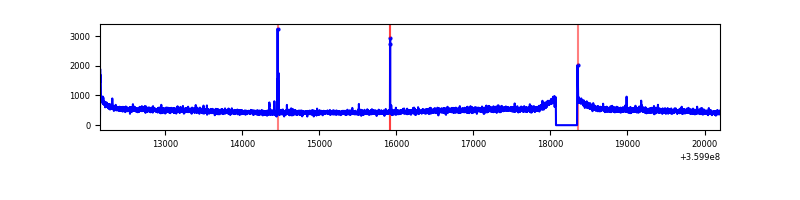 |
| B | 8043 | 7768 | 7 | 7 | 0.09% | 0.09% | 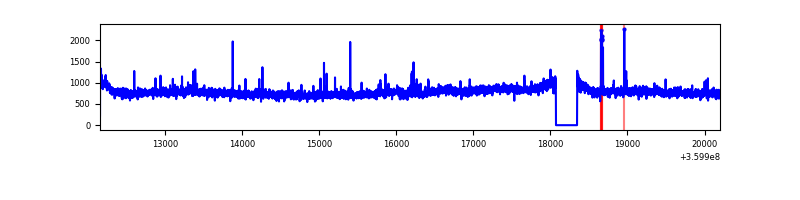 |
| C | 8043 | 7768 | 6 | 6 | 0.07% | 0.08% |  |
| D | 8043 | 7768 | 433 | 433 | 5.38% | 5.57% | 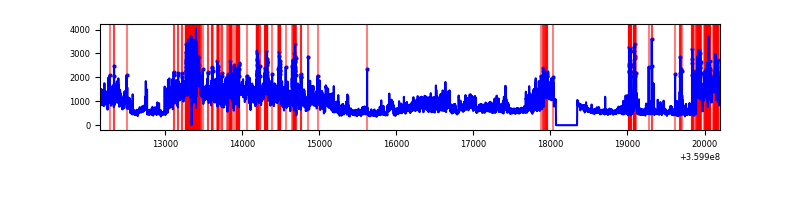 |
Top three noisy pixels from each quadrant. If the there are fewer than three noisy pixels in the level2.evt file, extra rows are filled as -1
| Pixel properties | Quadrant properties | ||||||
|---|---|---|---|---|---|---|---|
| Quadrant | DetID | PixID | Counts | Sigma | Mean | Median | Sigma |
| A | 0 | 13 | 26705 | 129.12 | 989 | 969 | 199.3 |
| A | 8 | 192 | 23405 | 112.56 | 989 | 969 | 199.3 |
| A | 13 | 254 | 14746 | 69.12 | 989 | 969 | 199.3 |
| B | 6 | 159 | 2173130 | 11690.61 | 971 | 949 | 185.8 |
| B | 6 | 36 | 32106 | 167.69 | 971 | 949 | 185.8 |
| B | 0 | 229 | 29909 | 155.86 | 971 | 949 | 185.8 |
| C | 14 | 238 | 149325 | 682.19 | 928 | 933 | 217.5 |
| C | 10 | 22 | 80149 | 364.17 | 928 | 933 | 217.5 |
| C | 3 | 233 | 66316 | 300.58 | 928 | 933 | 217.5 |
| D | 8 | 195 | 3009664 | 13713.98 | 926 | 903 | 219.4 |
| D | 13 | 249 | 544911 | 2479.6 | 926 | 903 | 219.4 |
| D | 12 | 218 | 217413 | 986.86 | 926 | 903 | 219.4 |
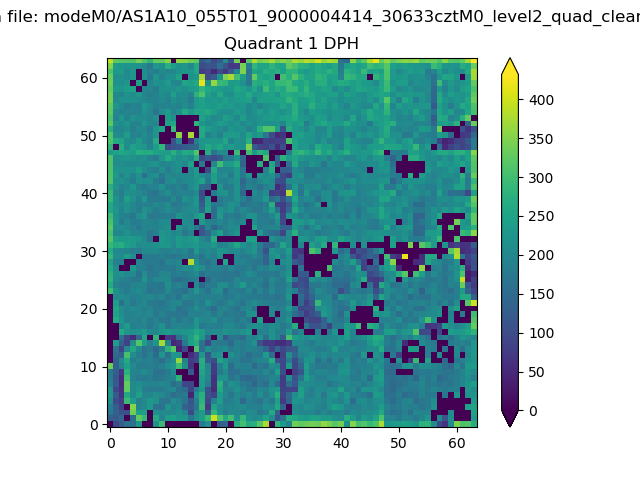
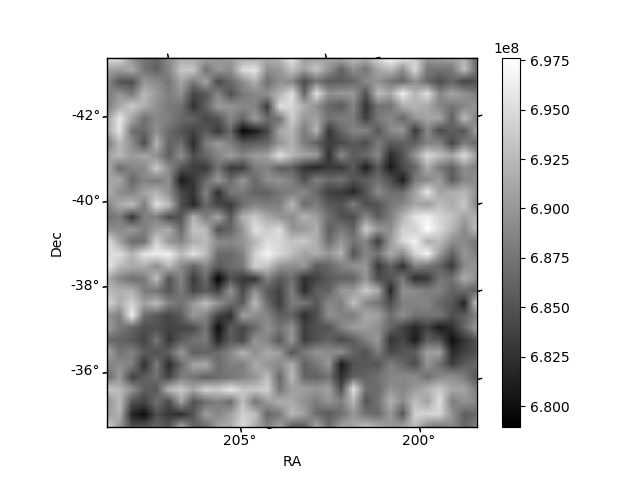
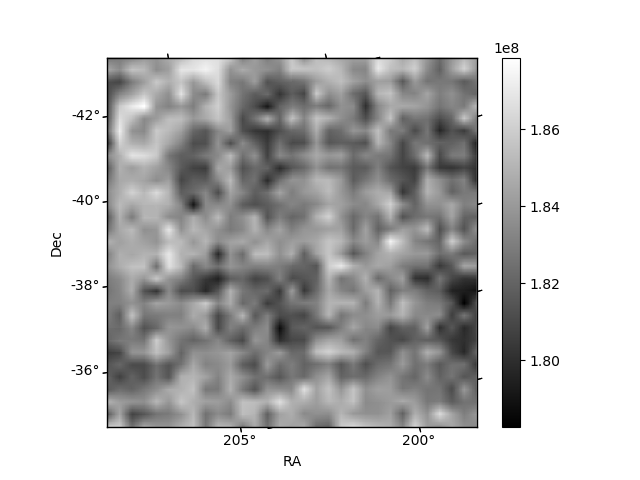
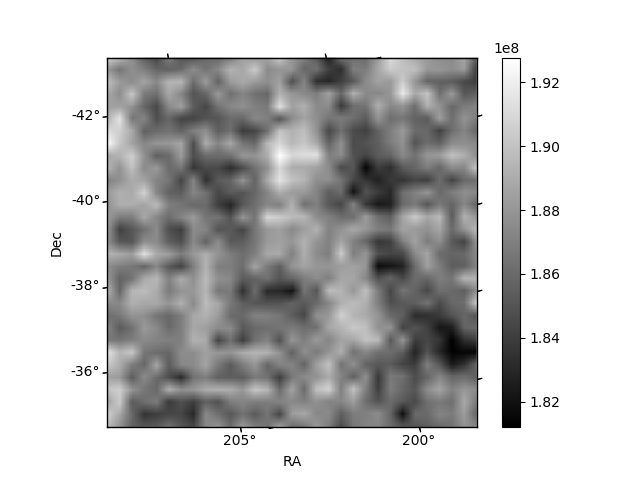
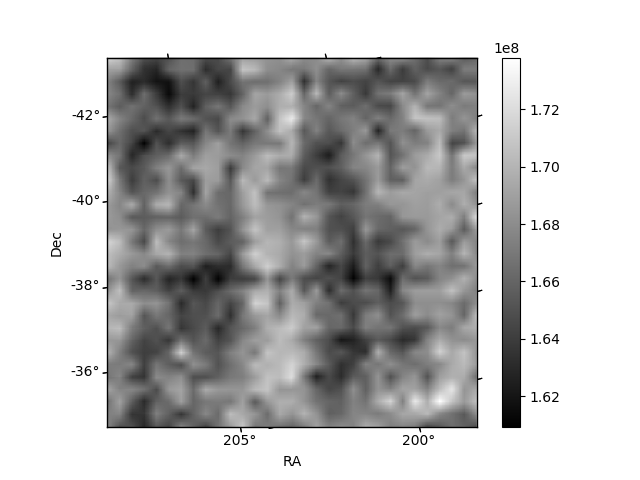
Histogram calculated using DETX and DETY for each event in the final _common_clean file
| Quadrant A | 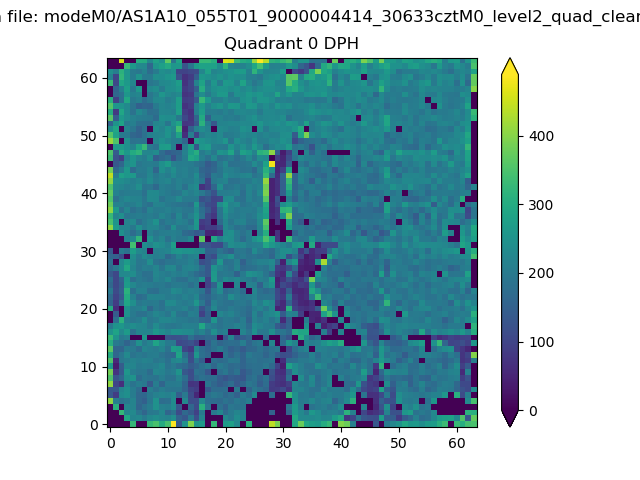 |
 |
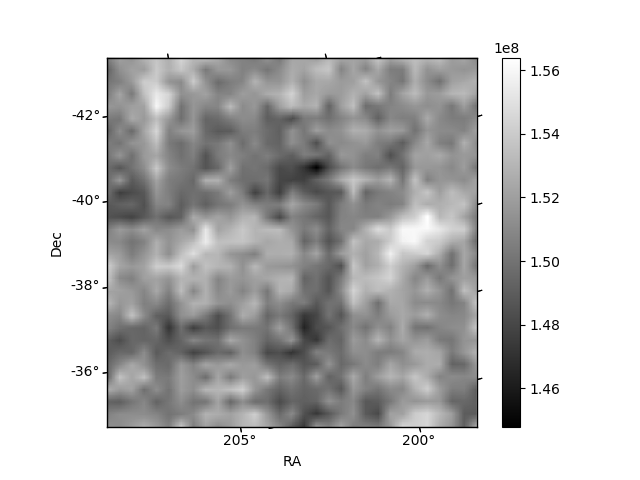
Quadrant B |
|---|---|---|---|
| Quadrant D | 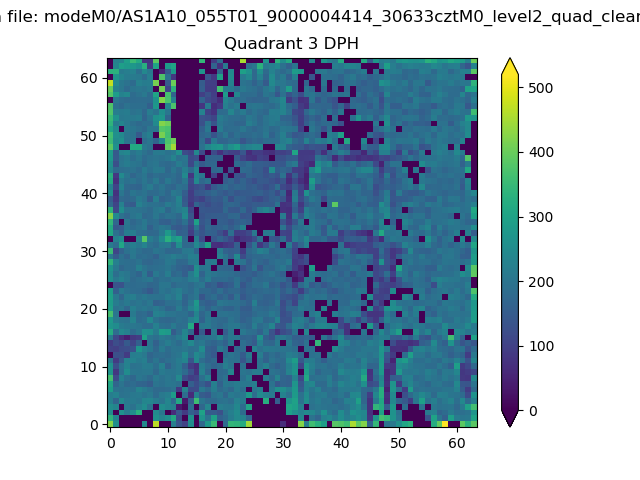 |
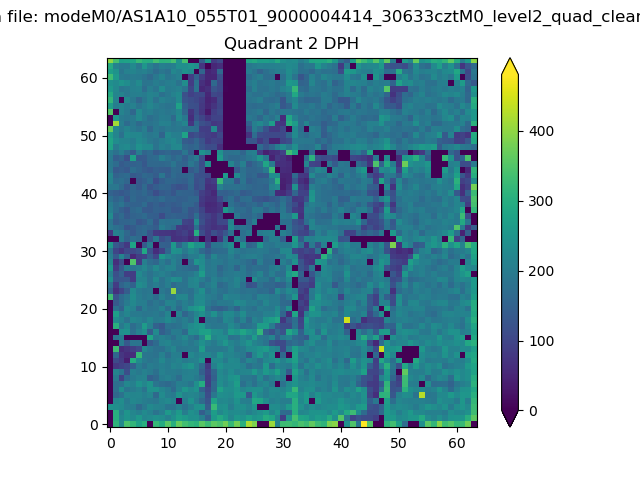 |
Quadrant C |
| Plot type | Count rate plots | Images |
|---|---|---|
| Comparison with Poisson distribution Blue bars denote a histogram of data divided into 1 sec bins. Red curve is a Poisson curve with rate = median count rate of data. |
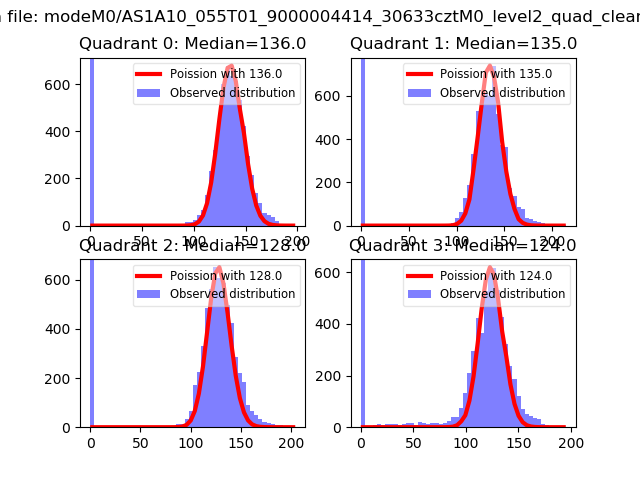 |
 |
| Quadrant-wise count rates Data is divided into 100 sec bins |
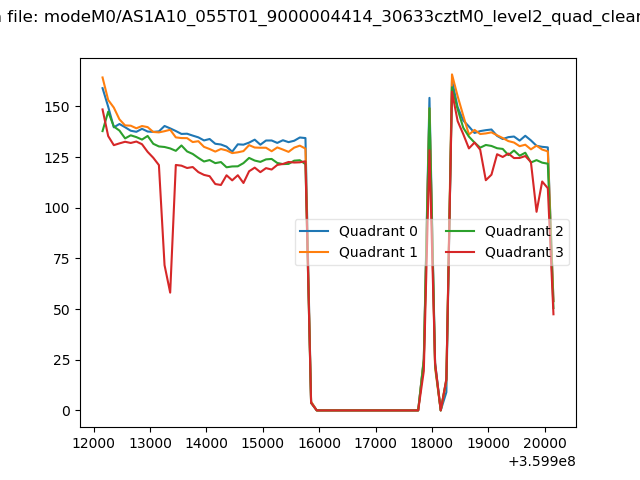 |
|
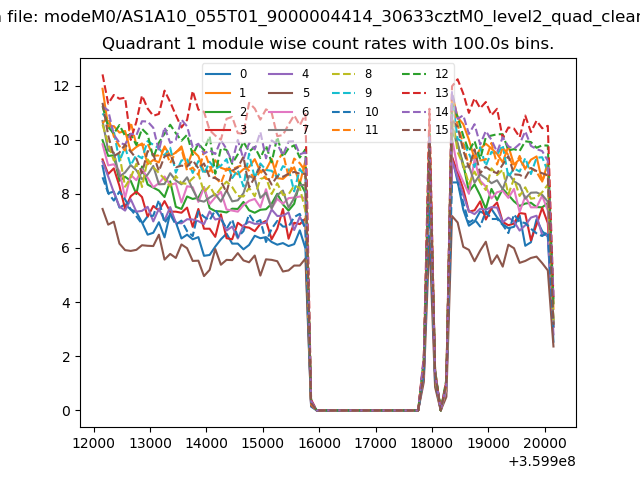
| Module-wise count rates for Quadrant A Data is divided into 100 sec bins |
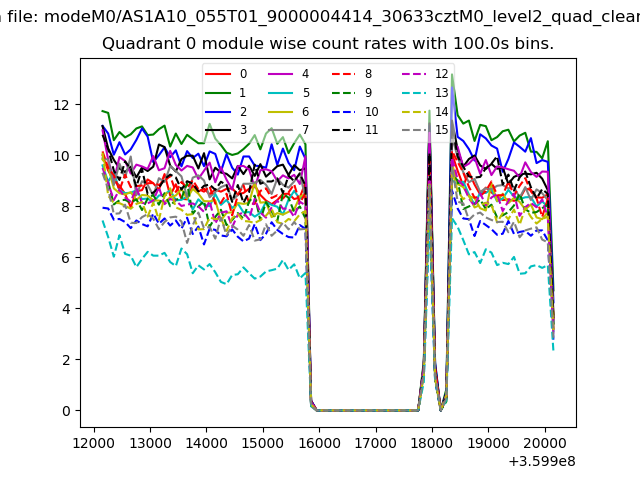 |
 |
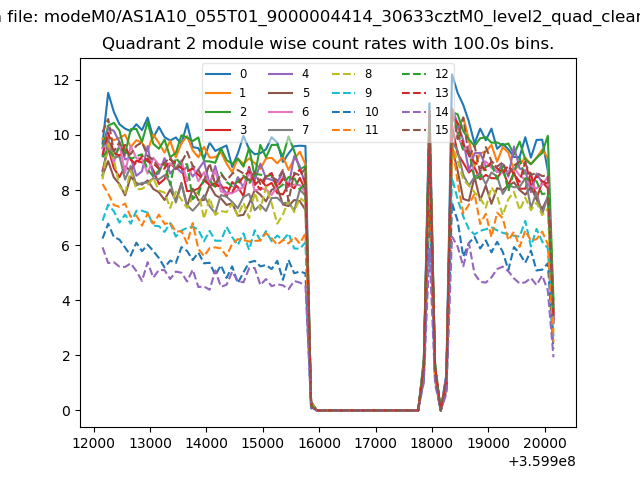
| Module-wise count rates for Quadrant B Data is divided into 100 sec bins |
 |
 |
| Module-wise count rates for Quadrant C Data is divided into 100 sec bins |
 |
 |
| Module-wise count rates for Quadrant D Data is divided into 100 sec bins |
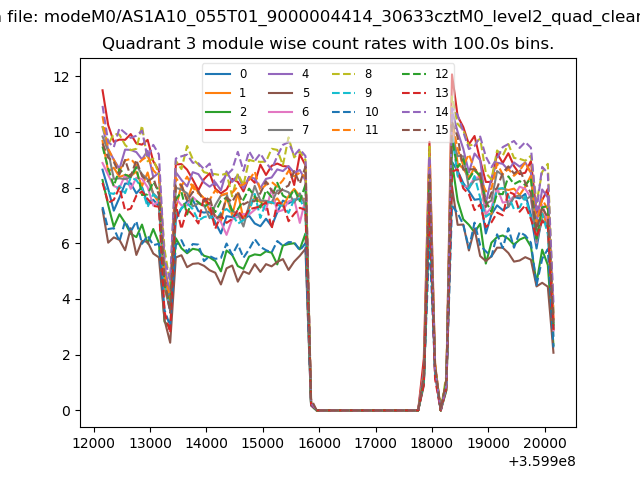 |
 |
| Parameter | Plot |
|---|---|
| CZT HV Monitor | 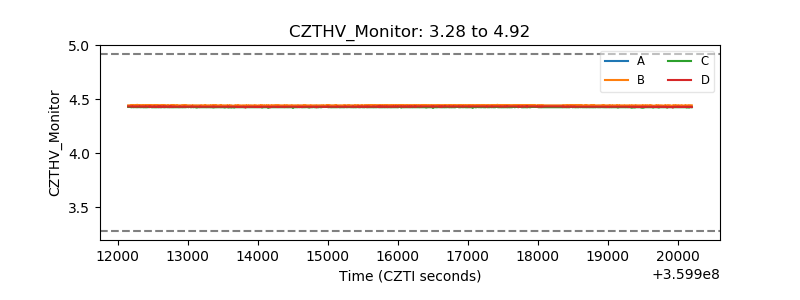 |
| D_VDD | 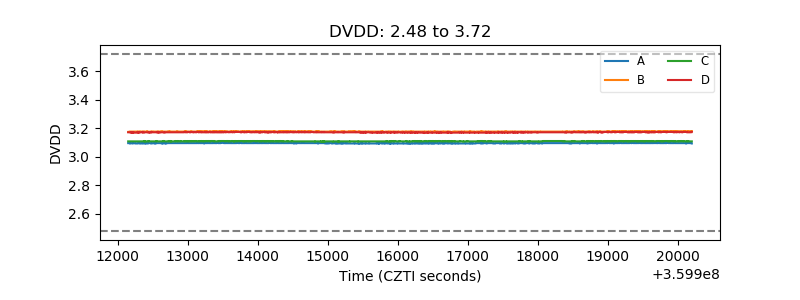 |
| Temperature 1 |  |
| Veto HV Monitor | 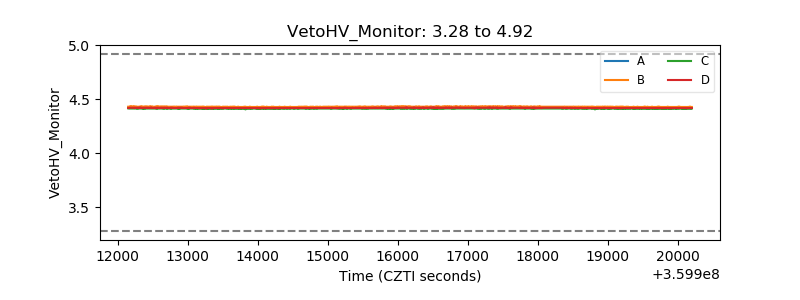 |
| Veto LLD | 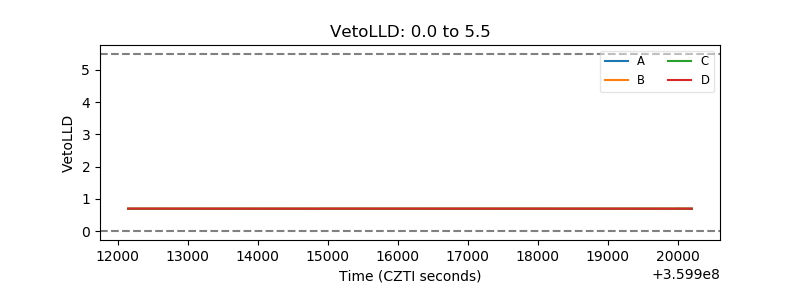 |
| Alpha Counter | 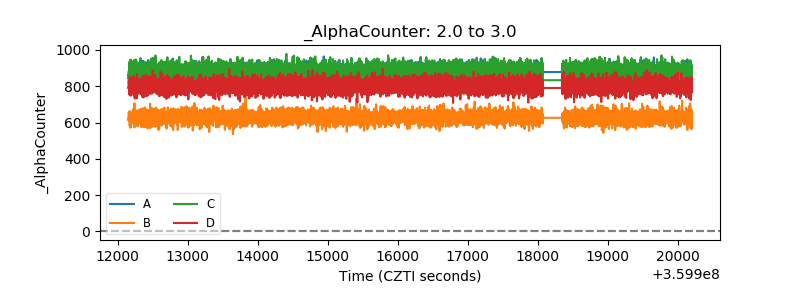 |
| _CPM_Rate | 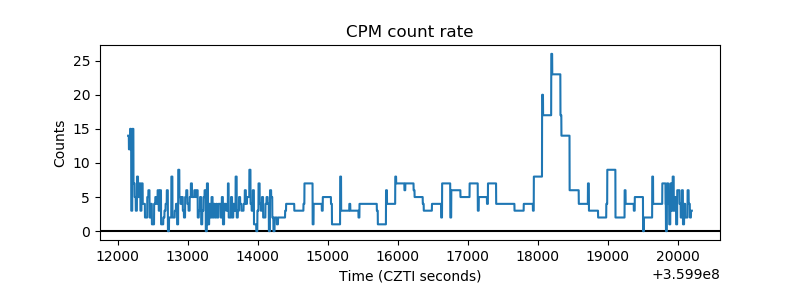 |
| CZT Counter | 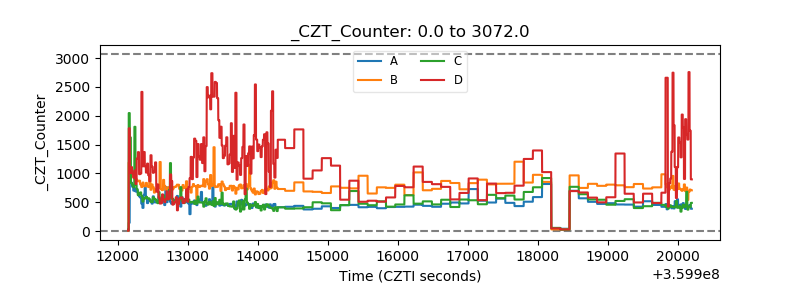 |
| +2.5 Volts monitor |  |
| +5 Volts monitor |  |
| _ROLL_ROT | 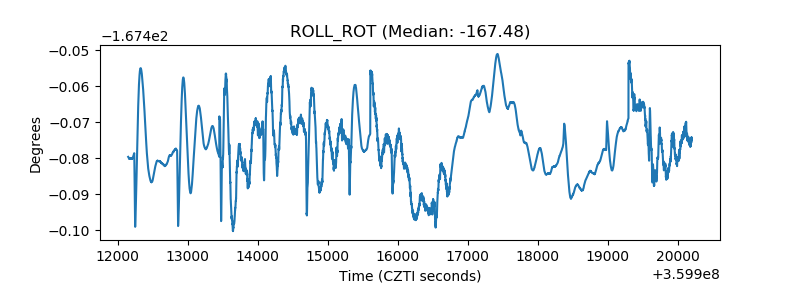 |
| _Roll_DEC | 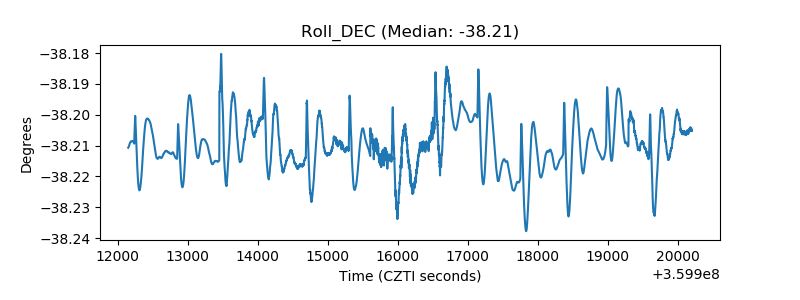 |
| _Roll_RA | 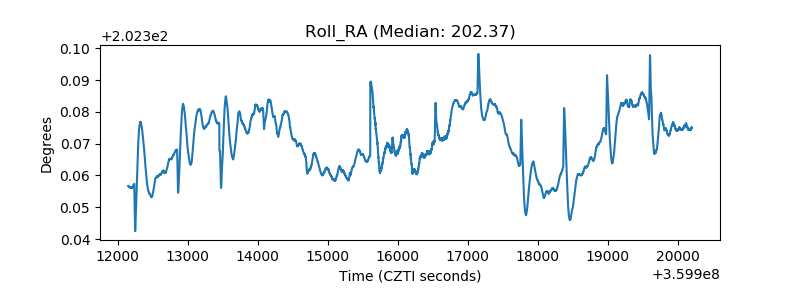 |
| Veto Counter | 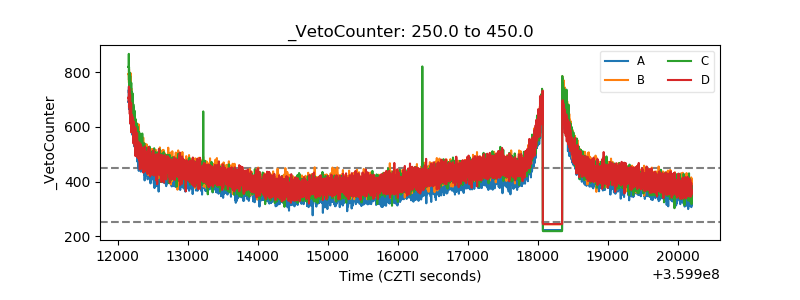 |