| Param | Original file | Final file |
|---|---|---|
| Filename | modeM0/AS1A10_055T01_9000004414_30634cztM0_level2.evt | modeM0/AS1A10_055T01_9000004414_30634cztM0_level2_quad_clean.evt |
| Size (bytes) | 785,770,560 | 108,596,160 |
| Size | 749.4 MB | 103.6 MB |
| Events in quadrant A | 3,835,063 | 728,348 |
| Events in quadrant B | 5,936,726 | 721,212 |
| Events in quadrant C | 3,754,627 | 689,669 |
| Events in quadrant D | 9,762,460 | 624,478 |
| Mode M9 | |||
|---|---|---|---|
| Quadrant | BADHDUFLAG | Total packets | Discarded packets |
| A | 0 | 2 | 0 |
| B | 0 | 2 | 0 |
| C | 0 | 2 | 0 |
| D | 0 | 2 | 0 |
| Mode M0 | |||
|---|---|---|---|
| Quadrant | BADHDUFLAG | Total packets | Discarded packets |
| A | 0 | 16199 | 1 |
| B | 0 | 23139 | 1 |
| C | 0 | 16027 | 1 |
| D | 0 | 34266 | 1 |
| Mode SS | |||
|---|---|---|---|
| Quadrant | BADHDUFLAG | Total packets | Discarded packets |
| A | 0 | 152 | 0 |
| B | 0 | 152 | 0 |
| C | 0 | 152 | 0 |
| D | 0 | 152 | 0 |
| Quadrant | Total seconds | Saturated seconds | Saturation percentage |
|---|---|---|---|
| A | 7543 | 100 | 1.325732% |
| B | 7544 | 177 | 2.346235% |
| C | 7544 | 117 | 1.550901% |
| D | 7543 | 1183 | 15.683415% |
Noise dominated data is calculated using 1-second bins in cleaned event files. If a bin has >2000 counts, and if more than 50% of those come from <1% of pixels, then it is considered to be noise-dominated and hence unusable.
| Quadrant | # 1 sec bins | Bins with >0 counts | Bins with >2000 counts | High rate bins dominated by noise | Noise dominated (total time) | Noise dominated (detector-on time) | Marked lightcurve |
|---|---|---|---|---|---|---|---|
| A | 7678 | 7545 | 26 | 26 | 0.34% | 0.34% | 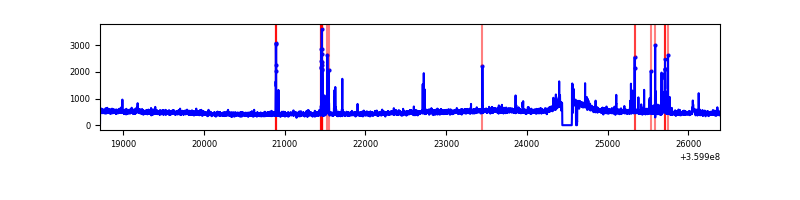 |
| B | 7679 | 7546 | 12 | 12 | 0.16% | 0.16% | 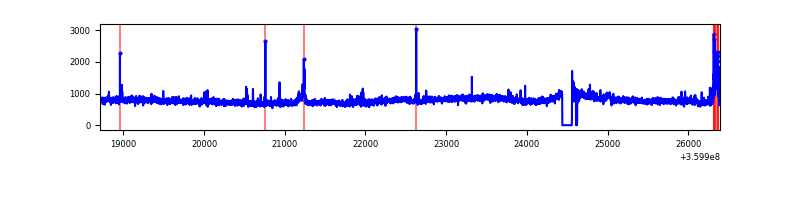 |
| C | 7679 | 7546 | 2 | 2 | 0.03% | 0.03% | 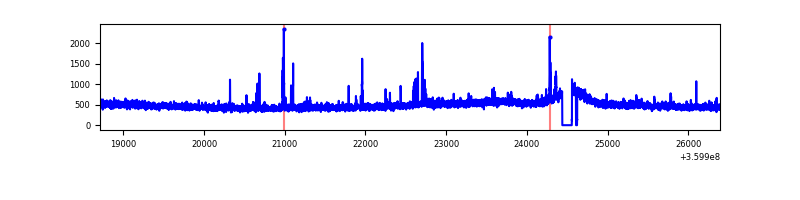 |
| D | 7678 | 7545 | 1339 | 1339 | 17.44% | 17.75% | 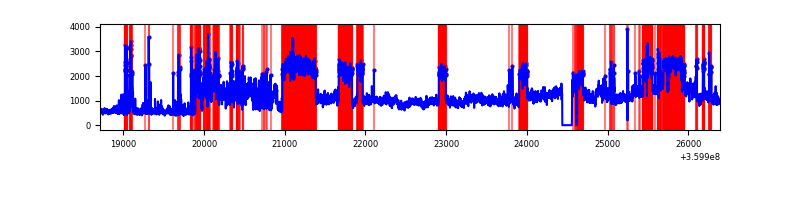 |
Top three noisy pixels from each quadrant. If the there are fewer than three noisy pixels in the level2.evt file, extra rows are filled as -1
| Pixel properties | Quadrant properties | ||||||
|---|---|---|---|---|---|---|---|
| Quadrant | DetID | PixID | Counts | Sigma | Mean | Median | Sigma |
| A | 0 | 13 | 201440 | 1058.72 | 939 | 921 | 189.4 |
| A | 13 | 254 | 14665 | 72.57 | 939 | 921 | 189.4 |
| A | 3 | 137 | 9241 | 43.93 | 939 | 921 | 189.4 |
| B | 6 | 159 | 2118895 | 12004.15 | 922 | 898 | 176.4 |
| B | 6 | 36 | 80573 | 451.57 | 922 | 898 | 176.4 |
| B | 0 | 229 | 61374 | 342.76 | 922 | 898 | 176.4 |
| C | 14 | 238 | 140970 | 674.96 | 882 | 888 | 207.5 |
| C | 3 | 233 | 88491 | 422.1 | 882 | 888 | 207.5 |
| C | 10 | 22 | 51276 | 242.79 | 882 | 888 | 207.5 |
| D | 8 | 195 | 5763334 | 28442.91 | 860 | 837 | 202.6 |
| D | 12 | 218 | 297320 | 1463.4 | 860 | 837 | 202.6 |
| D | 13 | 249 | 222368 | 1093.44 | 860 | 837 | 202.6 |
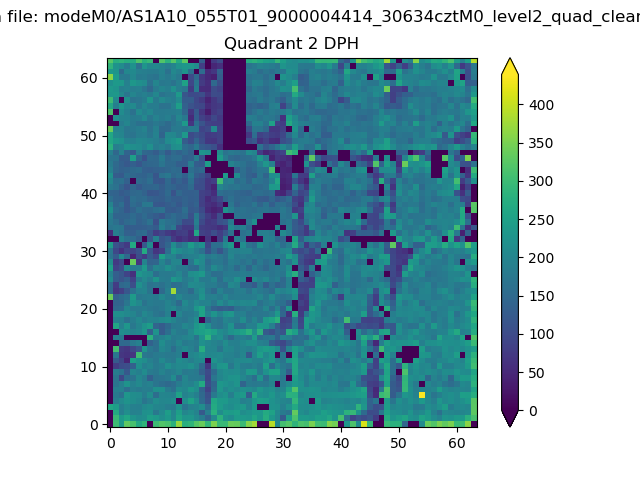
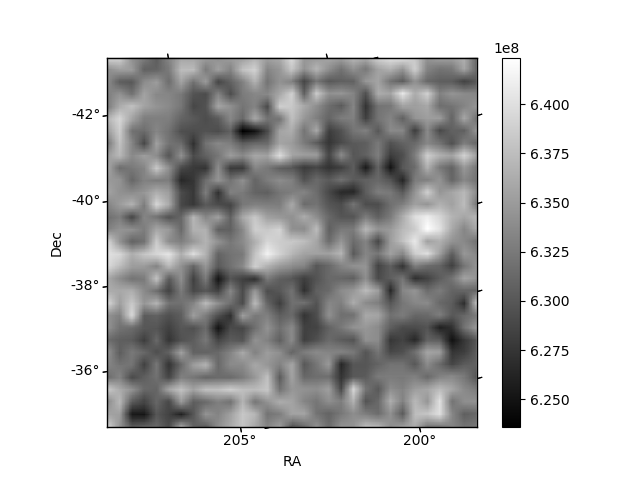
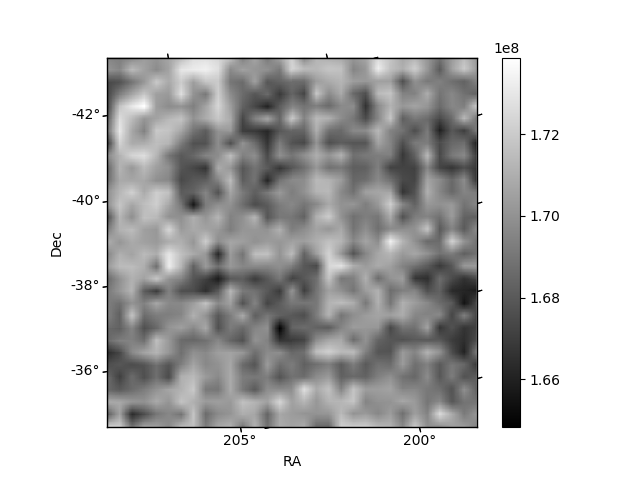
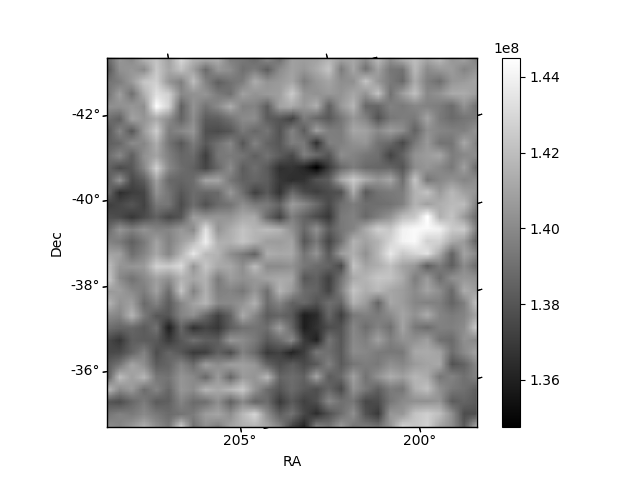
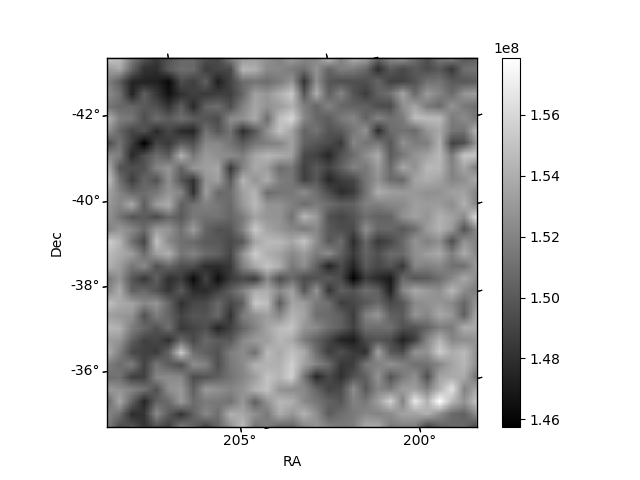
Histogram calculated using DETX and DETY for each event in the final _common_clean file
| Quadrant A | 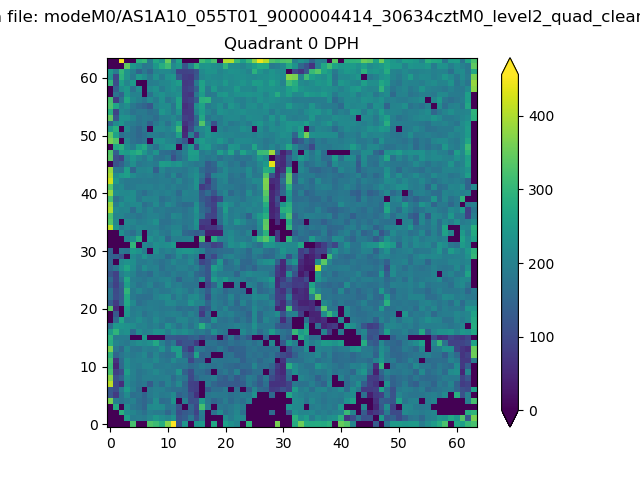 |
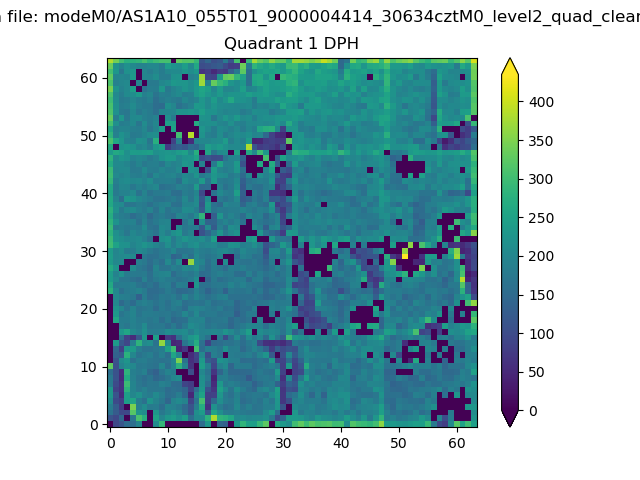 |
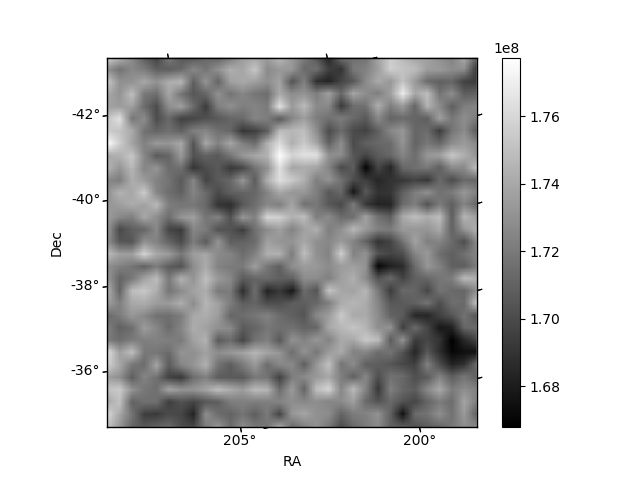
Quadrant B |
|---|---|---|---|
| Quadrant D | 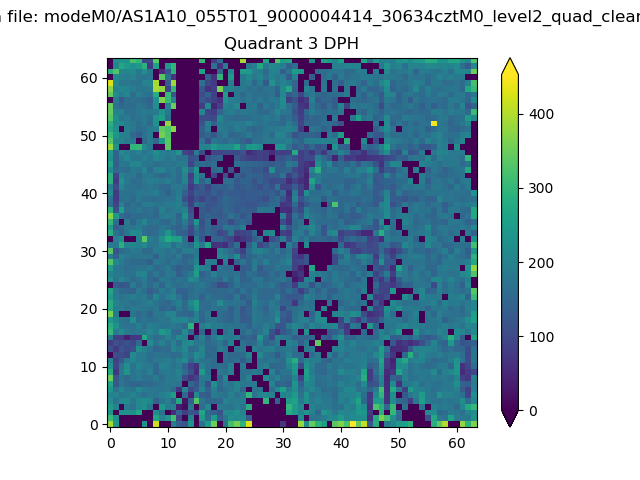 |
 |
Quadrant C |
| Plot type | Count rate plots | Images |
|---|---|---|
| Comparison with Poisson distribution Blue bars denote a histogram of data divided into 1 sec bins. Red curve is a Poisson curve with rate = median count rate of data. |
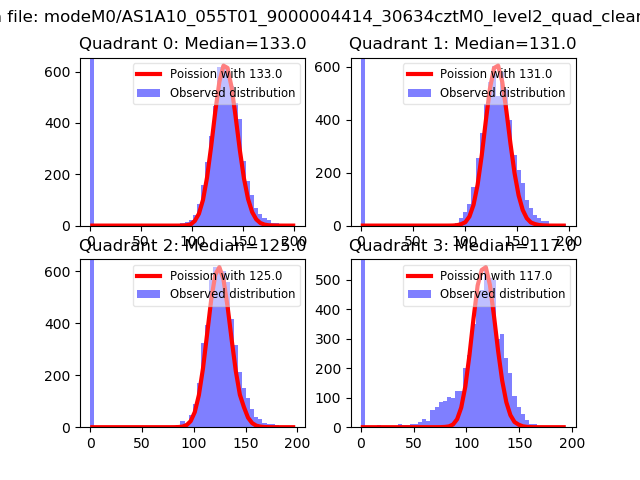 |
 |
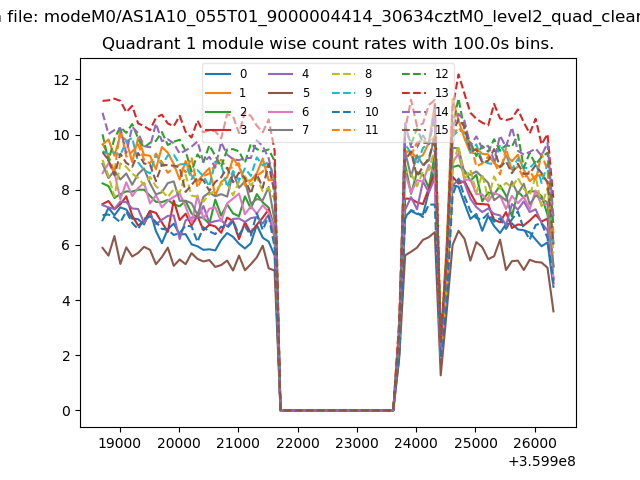
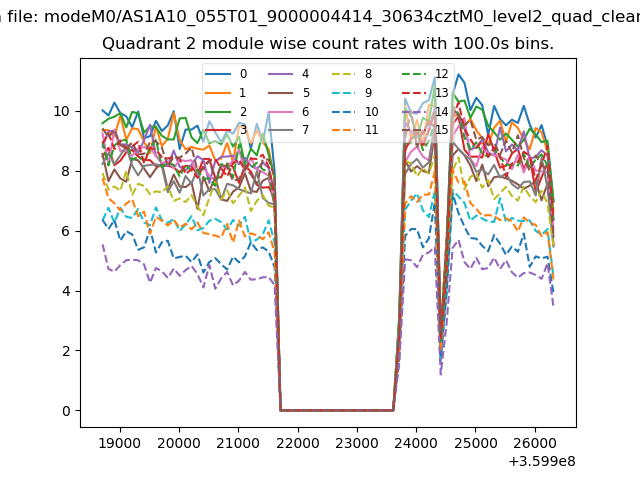
| Quadrant-wise count rates Data is divided into 100 sec bins |
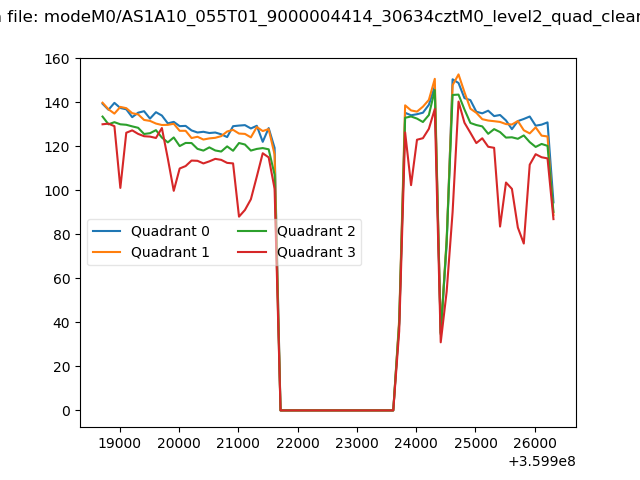 |
|
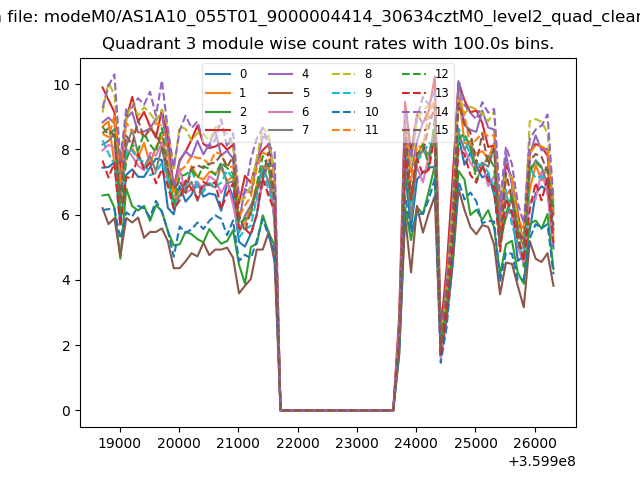
| Module-wise count rates for Quadrant A Data is divided into 100 sec bins |
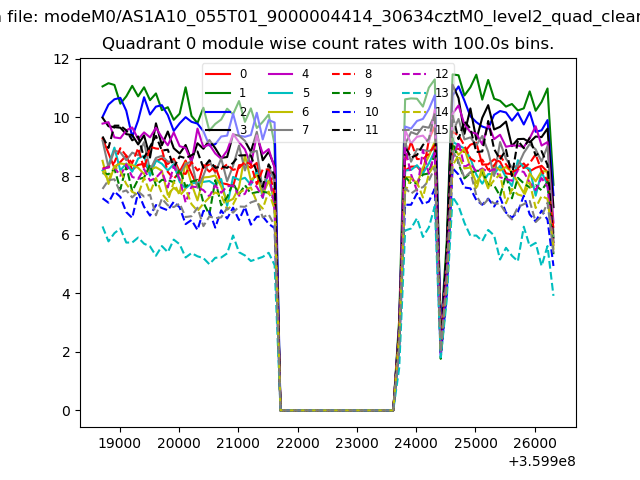 |
 |
| Module-wise count rates for Quadrant B Data is divided into 100 sec bins |
 |
 |
| Module-wise count rates for Quadrant C Data is divided into 100 sec bins |
 |
 |
| Module-wise count rates for Quadrant D Data is divided into 100 sec bins |
 |
 |
| Parameter | Plot |
|---|---|
| CZT HV Monitor |  |
| D_VDD | 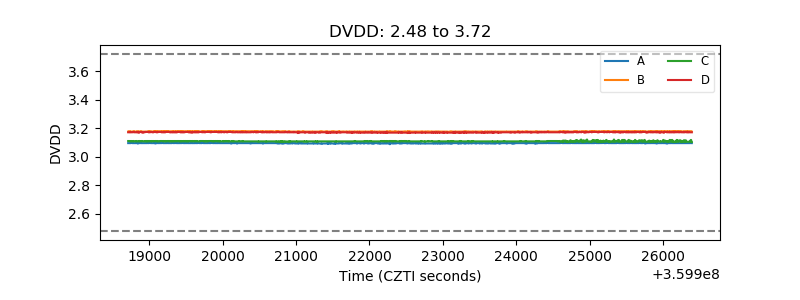 |
| Temperature 1 | 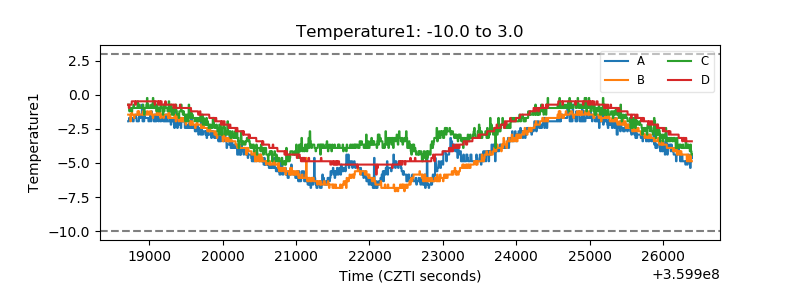 |
| Veto HV Monitor | 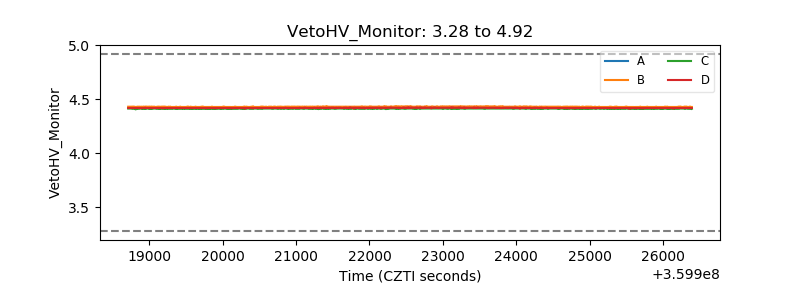 |
| Veto LLD |  |
| Alpha Counter | 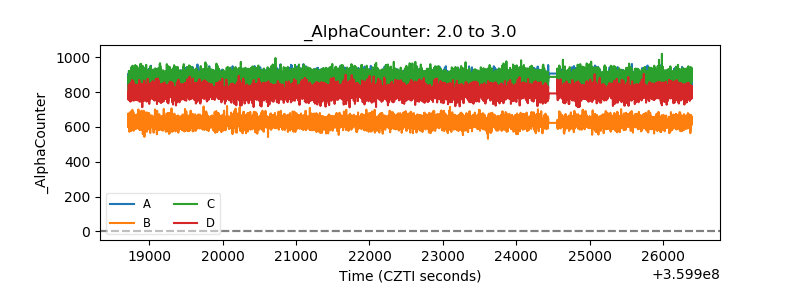 |
| _CPM_Rate | 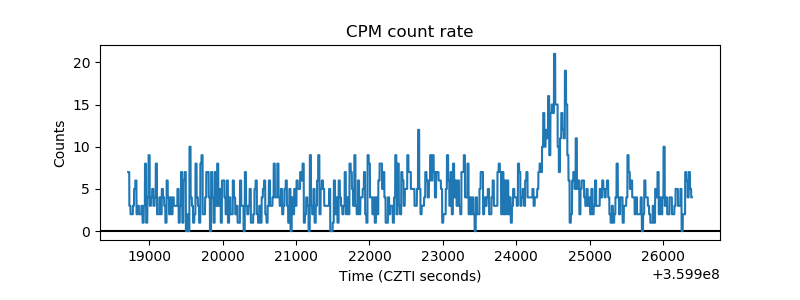 |
| CZT Counter | 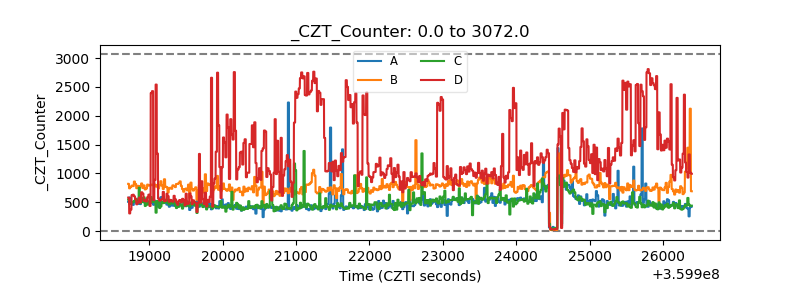 |
| +2.5 Volts monitor |  |
| +5 Volts monitor | 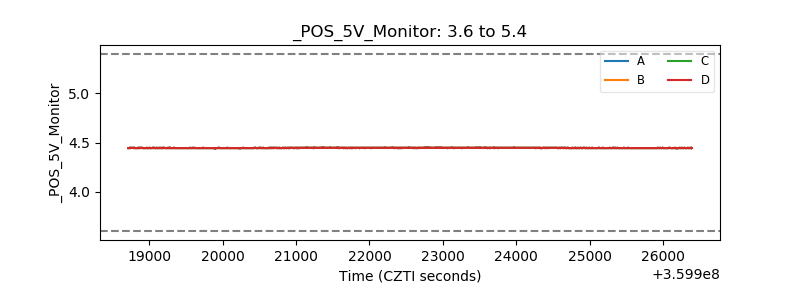 |
| _ROLL_ROT | 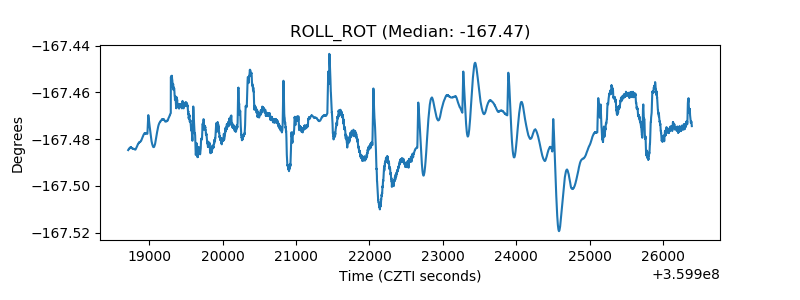 |
| _Roll_DEC | 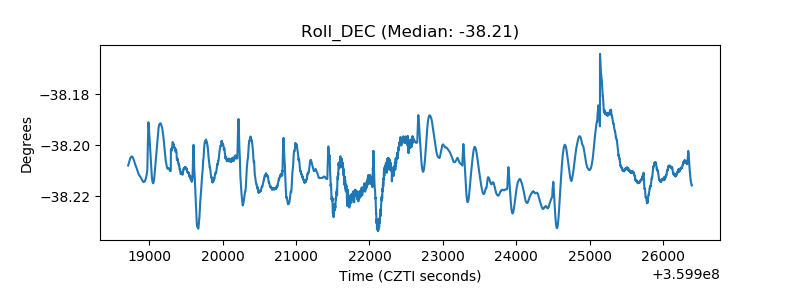 |
| _Roll_RA | 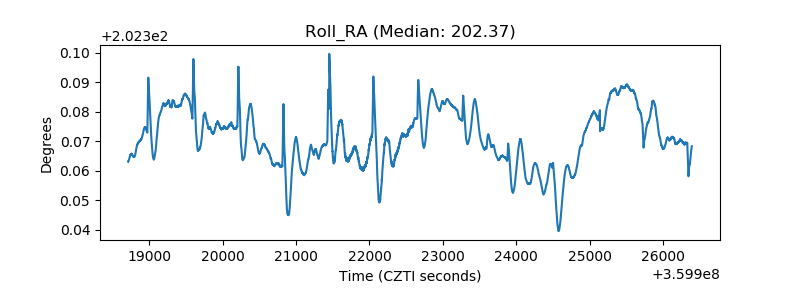 |
| Veto Counter | 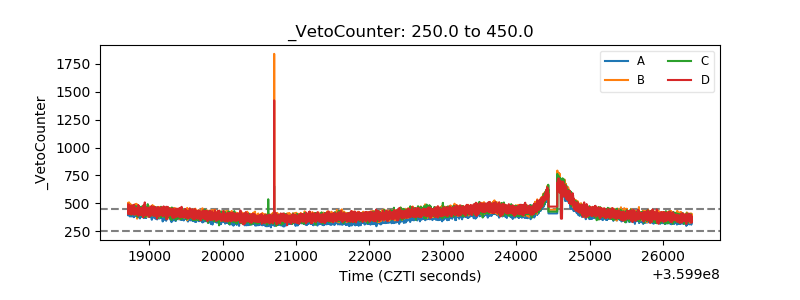 |