| Param | Original file | Final file |
|---|---|---|
| Filename | modeM0/AS1A10_055T01_9000004414_30635cztM0_level2.evt | modeM0/AS1A10_055T01_9000004414_30635cztM0_level2_quad_clean.evt |
| Size (bytes) | 868,901,760 | 109,756,800 |
| Size | 828.6 MB | 104.7 MB |
| Events in quadrant A | 4,122,145 | 745,855 |
| Events in quadrant B | 6,078,709 | 737,400 |
| Events in quadrant C | 3,825,406 | 707,487 |
| Events in quadrant D | 11,770,056 | 596,982 |
| Mode M9 | |||
|---|---|---|---|
| Quadrant | BADHDUFLAG | Total packets | Discarded packets |
| A | 0 | 5 | 0 |
| B | 0 | 5 | 0 |
| C | 0 | 5 | 0 |
| D | 0 | 5 | 0 |
| Mode M0 | |||
|---|---|---|---|
| Quadrant | BADHDUFLAG | Total packets | Discarded packets |
| A | 0 | 17314 | 2 |
| B | 0 | 23709 | 2 |
| C | 0 | 16283 | 2 |
| D | 0 | 40401 | 4 |
| Mode SS | |||
|---|---|---|---|
| Quadrant | BADHDUFLAG | Total packets | Discarded packets |
| A | 0 | 158 | 0 |
| B | 0 | 158 | 0 |
| C | 0 | 158 | 0 |
| D | 0 | 158 | 0 |
| Quadrant | Total seconds | Saturated seconds | Saturation percentage |
|---|---|---|---|
| A | 7698 | 142 | 1.844635% |
| B | 7698 | 218 | 2.831904% |
| C | 7698 | 128 | 1.662770% |
| D | 7698 | 2078 | 26.994024% |
Noise dominated data is calculated using 1-second bins in cleaned event files. If a bin has >2000 counts, and if more than 50% of those come from <1% of pixels, then it is considered to be noise-dominated and hence unusable.
| Quadrant | # 1 sec bins | Bins with >0 counts | Bins with >2000 counts | High rate bins dominated by noise | Noise dominated (total time) | Noise dominated (detector-on time) | Marked lightcurve |
|---|---|---|---|---|---|---|---|
| A | 8053 | 7700 | 42 | 42 | 0.52% | 0.55% | 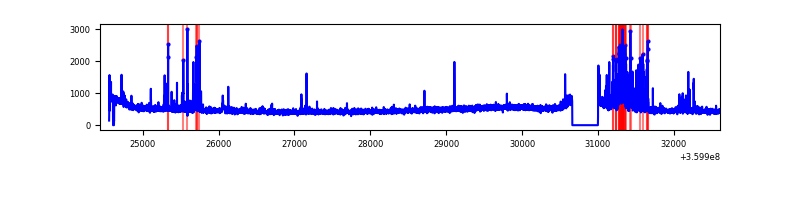 |
| B | 8053 | 7700 | 16 | 16 | 0.20% | 0.21% | 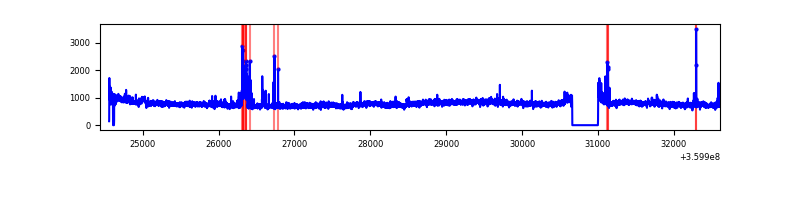 |
| C | 8053 | 7700 | 0 | 0 | 0.00% | 0.00% | 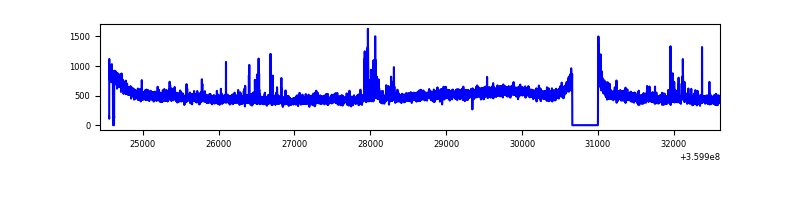 |
| D | 8173 | 7701 | 2094 | 2094 | 25.62% | 27.19% | 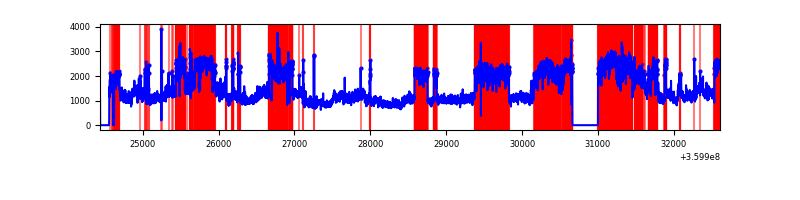 |
Top three noisy pixels from each quadrant. If the there are fewer than three noisy pixels in the level2.evt file, extra rows are filled as -1
| Pixel properties | Quadrant properties | ||||||
|---|---|---|---|---|---|---|---|
| Quadrant | DetID | PixID | Counts | Sigma | Mean | Median | Sigma |
| A | 0 | 13 | 419092 | 2165.2 | 954 | 936 | 193.1 |
| A | 13 | 254 | 14980 | 72.72 | 954 | 936 | 193.1 |
| A | 8 | 192 | 14357 | 69.49 | 954 | 936 | 193.1 |
| B | 6 | 159 | 2180620 | 12011.77 | 938 | 913 | 181.5 |
| B | 6 | 36 | 90458 | 493.46 | 938 | 913 | 181.5 |
| B | 0 | 229 | 39870 | 214.68 | 938 | 913 | 181.5 |
| C | 14 | 238 | 148560 | 698.06 | 898 | 902 | 211.5 |
| C | 3 | 233 | 97959 | 458.84 | 898 | 902 | 211.5 |
| C | 15 | 208 | 22086 | 100.15 | 898 | 902 | 211.5 |
| D | 8 | 195 | 6924897 | 35337.69 | 830 | 808 | 195.9 |
| D | 10 | 253 | 1082303 | 5519.5 | 830 | 808 | 195.9 |
| D | 13 | 249 | 191873 | 975.12 | 830 | 808 | 195.9 |
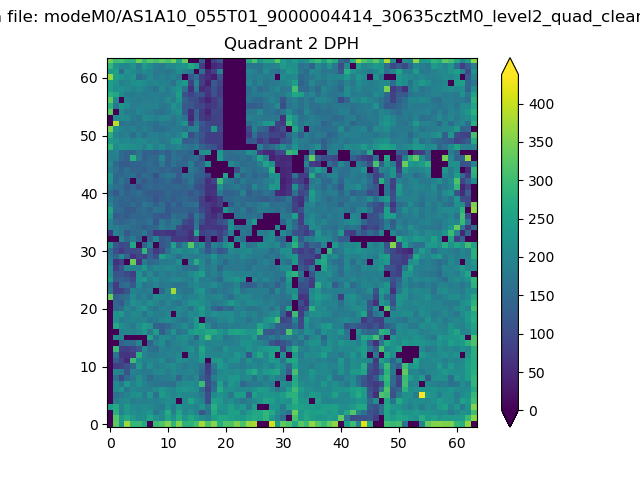
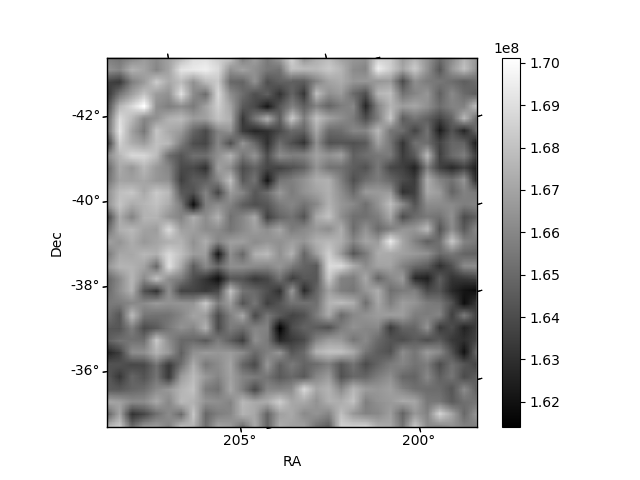
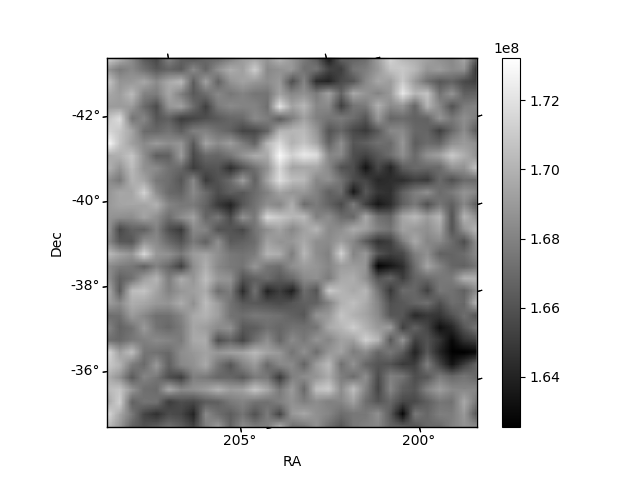
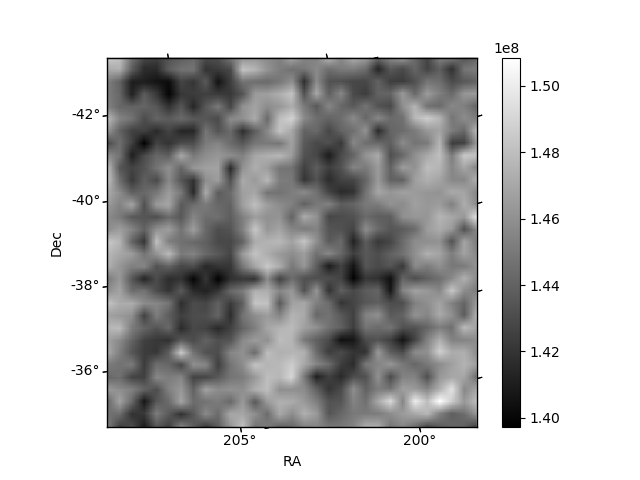
Histogram calculated using DETX and DETY for each event in the final _common_clean file
| Quadrant A | 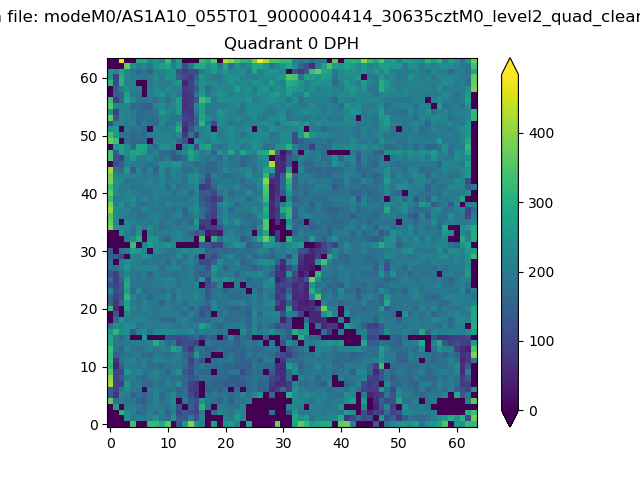 |
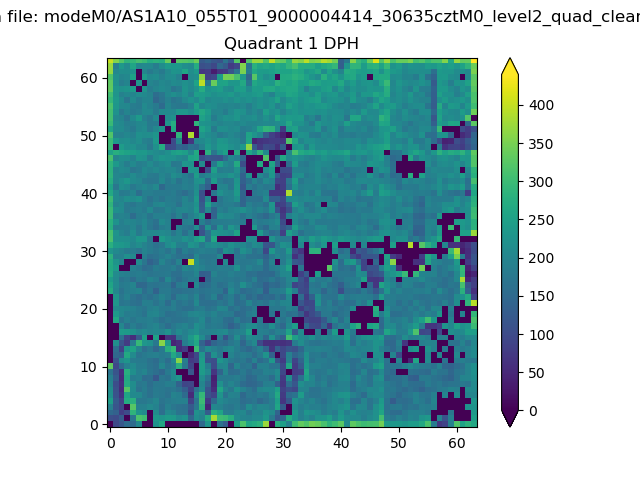 |
Quadrant B |
|---|---|---|---|
| Quadrant D | 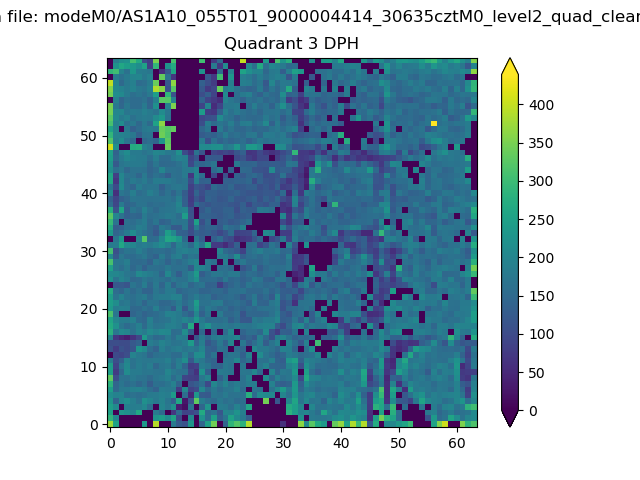 |
 |
Quadrant C |
| Plot type | Count rate plots | Images |
|---|---|---|
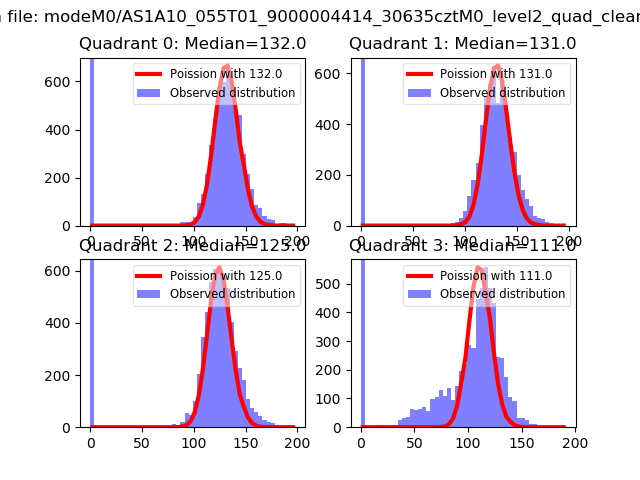
| Comparison with Poisson distribution Blue bars denote a histogram of data divided into 1 sec bins. Red curve is a Poisson curve with rate = median count rate of data. |
 |
 |
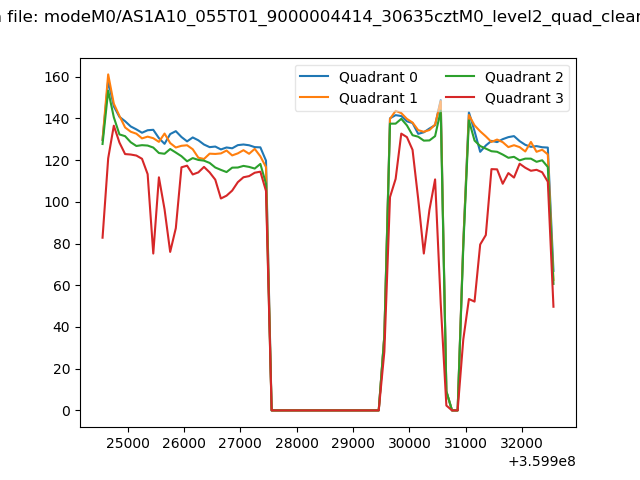
| Quadrant-wise count rates Data is divided into 100 sec bins |
 |
|
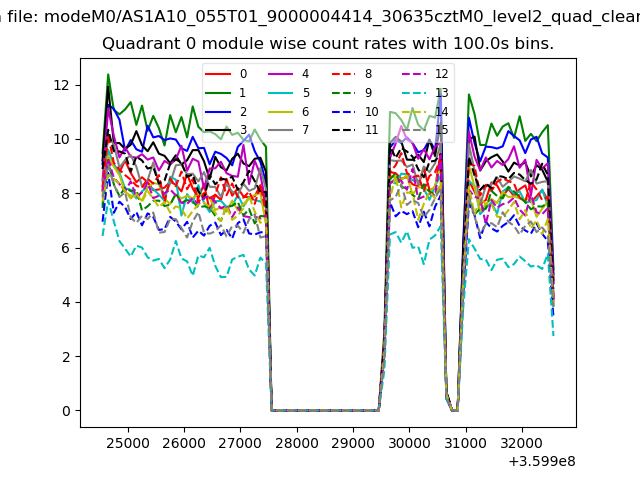
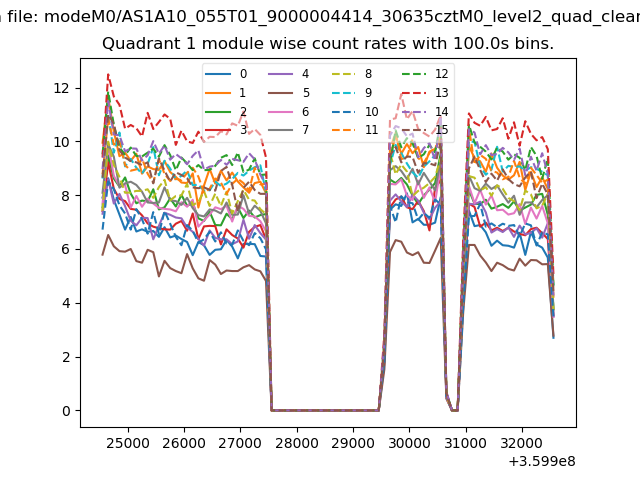
| Module-wise count rates for Quadrant A Data is divided into 100 sec bins |
 |
 |
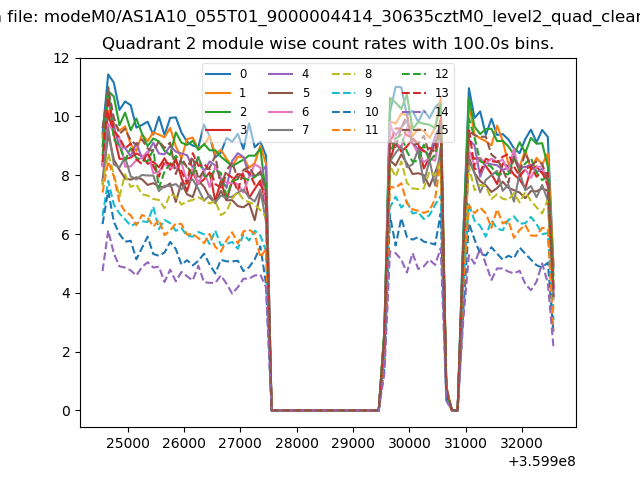
| Module-wise count rates for Quadrant B Data is divided into 100 sec bins |
 |
 |
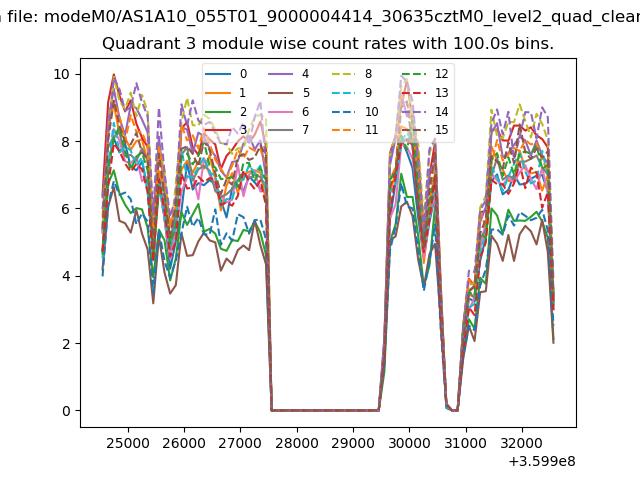
| Module-wise count rates for Quadrant C Data is divided into 100 sec bins |
 |
 |
| Module-wise count rates for Quadrant D Data is divided into 100 sec bins |
 |
 |
| Parameter | Plot |
|---|---|
| CZT HV Monitor | 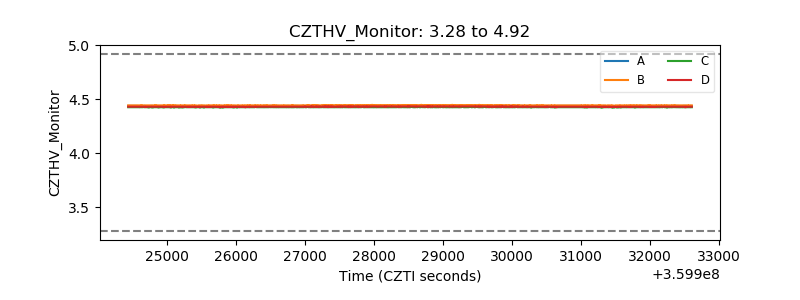 |
| D_VDD | 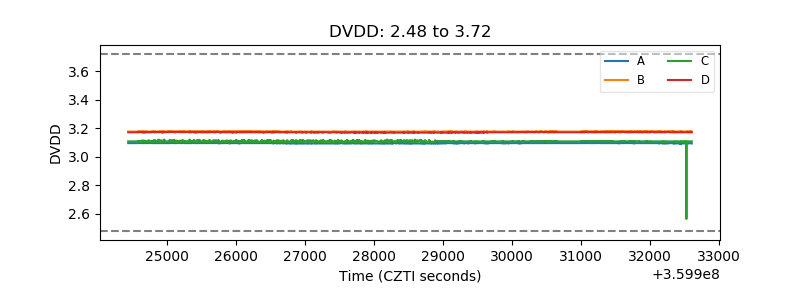 |
| Temperature 1 | 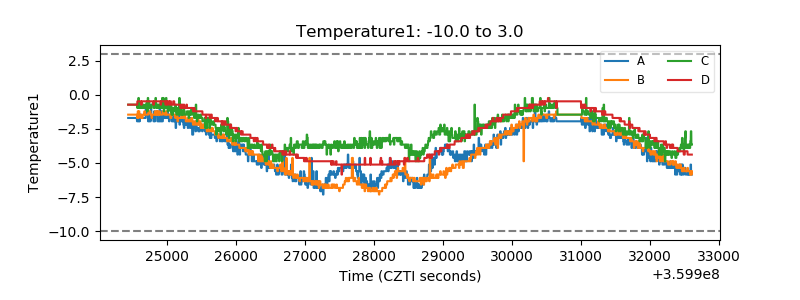 |
| Veto HV Monitor | 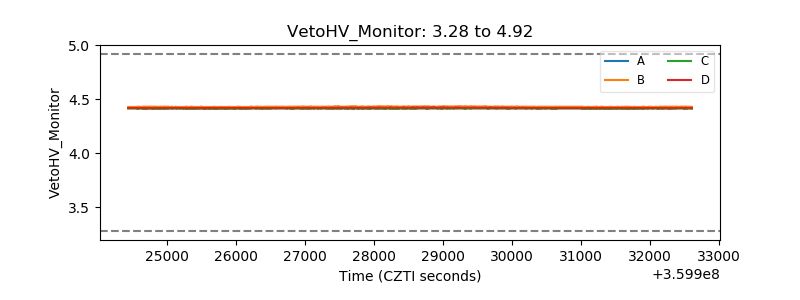 |
| Veto LLD |  |
| Alpha Counter | 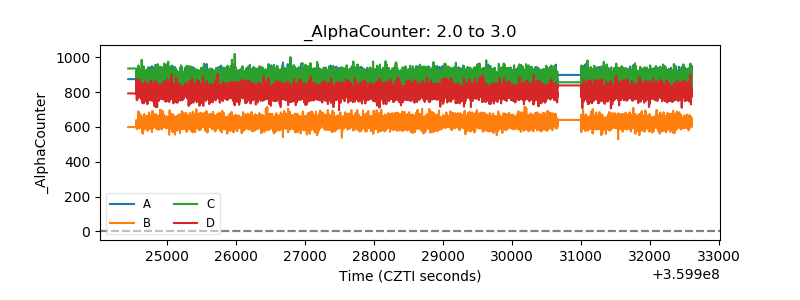 |
| _CPM_Rate | 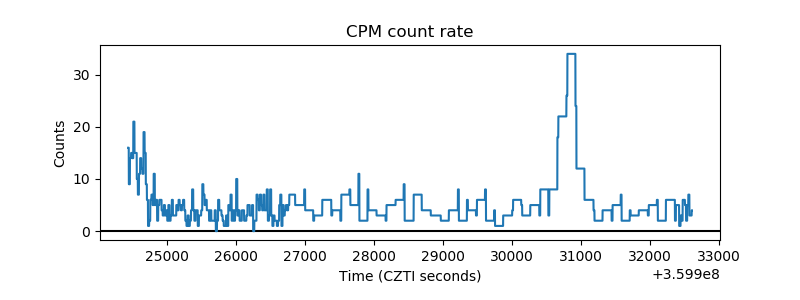 |
| CZT Counter | 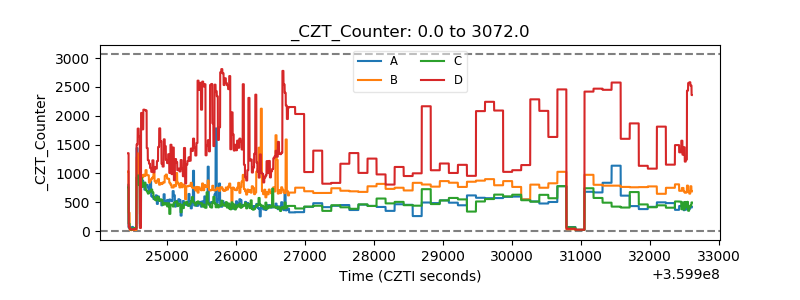 |
| +2.5 Volts monitor |  |
| +5 Volts monitor |  |
| _ROLL_ROT | 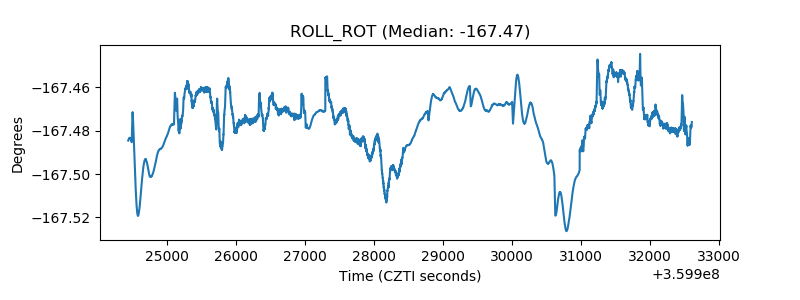 |
| _Roll_DEC | 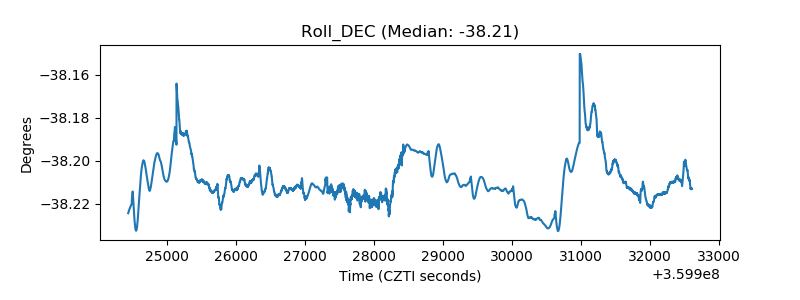 |
| _Roll_RA | 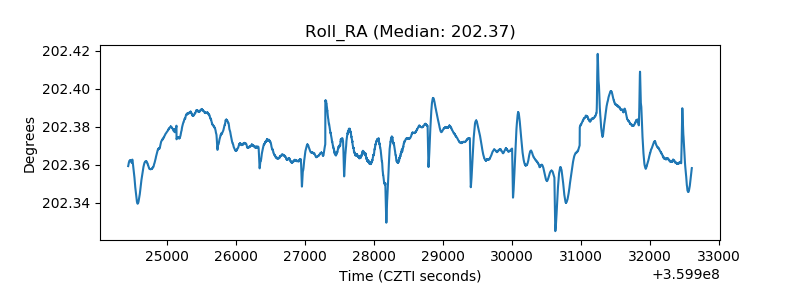 |
| Veto Counter | 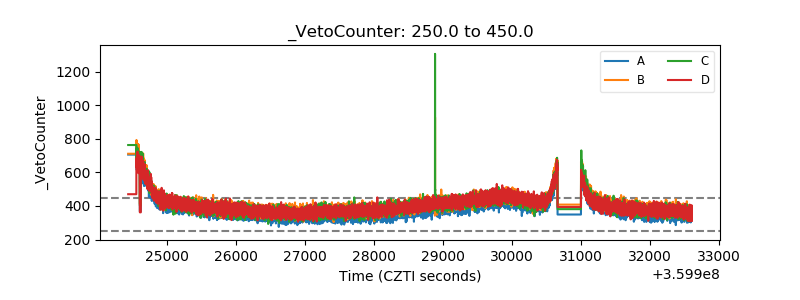 |