| Param | Original file | Final file |
|---|---|---|
| Filename | modeM0/AS1A10_055T01_9000004414_30637cztM0_level2.evt | modeM0/AS1A10_055T01_9000004414_30637cztM0_level2_quad_clean.evt |
| Size (bytes) | 622,707,840 | 72,593,280 |
| Size | 593.9 MB | 69.2 MB |
| Events in quadrant A | 3,503,848 | 474,516 |
| Events in quadrant B | 4,371,809 | 473,585 |
| Events in quadrant C | 2,875,833 | 453,021 |
| Events in quadrant D | 7,721,848 | 397,361 |
| Mode M9 | |||
|---|---|---|---|
| Quadrant | BADHDUFLAG | Total packets | Discarded packets |
| A | 0 | 3 | 0 |
| B | 0 | 3 | 0 |
| C | 0 | 3 | 0 |
| D | 0 | 3 | 0 |
| Mode M0 | |||
|---|---|---|---|
| Quadrant | BADHDUFLAG | Total packets | Discarded packets |
| A | 0 | 14303 | 0 |
| B | 0 | 17217 | 0 |
| C | 0 | 12274 | 0 |
| D | 0 | 26985 | 0 |
| Mode SS | |||
|---|---|---|---|
| Quadrant | BADHDUFLAG | Total packets | Discarded packets |
| A | 0 | 116 | 0 |
| B | 0 | 116 | 0 |
| C | 0 | 116 | 0 |
| D | 0 | 116 | 0 |
| Quadrant | Total seconds | Saturated seconds | Saturation percentage |
|---|---|---|---|
| A | 5709 | 173 | 3.030303% |
| B | 5710 | 43 | 0.753065% |
| C | 5710 | 50 | 0.875657% |
| D | 5710 | 858 | 15.026270% |
Noise dominated data is calculated using 1-second bins in cleaned event files. If a bin has >2000 counts, and if more than 50% of those come from <1% of pixels, then it is considered to be noise-dominated and hence unusable.
| Quadrant | # 1 sec bins | Bins with >0 counts | Bins with >2000 counts | High rate bins dominated by noise | Noise dominated (total time) | Noise dominated (detector-on time) | Marked lightcurve |
|---|---|---|---|---|---|---|---|
| A | 5709 | 5709 | 121 | 121 | 2.12% | 2.12% | 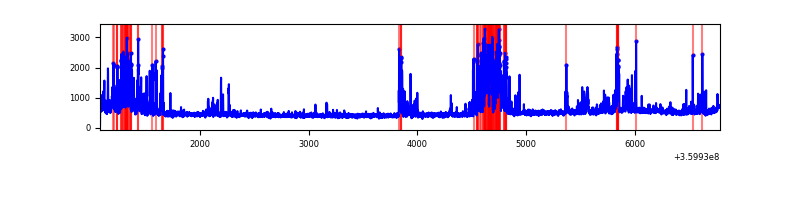 |
| B | 5710 | 5710 | 5 | 5 | 0.09% | 0.09% | 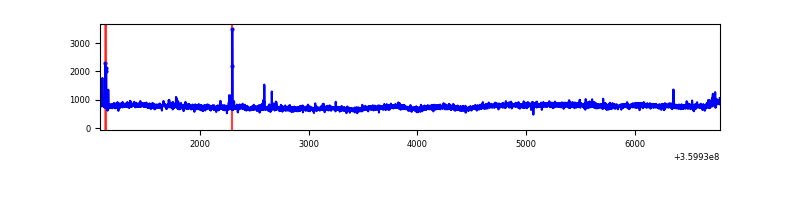 |
| C | 5710 | 5710 | 2 | 2 | 0.04% | 0.04% | 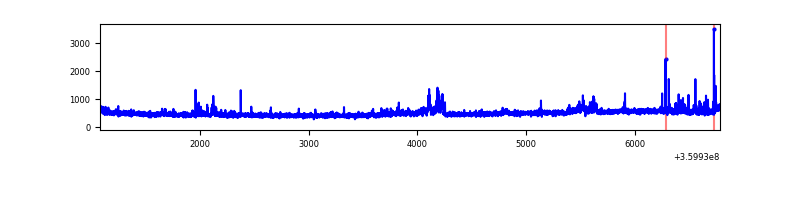 |
| D | 5710 | 5710 | 903 | 903 | 15.81% | 15.81% |  |
Top three noisy pixels from each quadrant. If the there are fewer than three noisy pixels in the level2.evt file, extra rows are filled as -1
| Pixel properties | Quadrant properties | ||||||
|---|---|---|---|---|---|---|---|
| Quadrant | DetID | PixID | Counts | Sigma | Mean | Median | Sigma |
| A | 0 | 13 | 868084 | 6271.25 | 682 | 669 | 138.3 |
| A | 13 | 254 | 11408 | 77.64 | 682 | 669 | 138.3 |
| A | 3 | 137 | 6943 | 45.36 | 682 | 669 | 138.3 |
| B | 6 | 159 | 1631252 | 12352.05 | 680 | 663 | 132.0 |
| B | 0 | 229 | 16919 | 123.14 | 680 | 663 | 132.0 |
| B | 12 | 111 | 16173 | 117.49 | 680 | 663 | 132.0 |
| C | 3 | 233 | 109686 | 704.81 | 653 | 655 | 154.7 |
| C | 14 | 238 | 108531 | 697.34 | 653 | 655 | 154.7 |
| C | 15 | 208 | 73908 | 473.53 | 653 | 655 | 154.7 |
| D | 8 | 195 | 4533935 | 30203.68 | 627 | 608 | 150.1 |
| D | 10 | 253 | 405038 | 2694.55 | 627 | 608 | 150.1 |
| D | 12 | 227 | 165743 | 1100.22 | 627 | 608 | 150.1 |
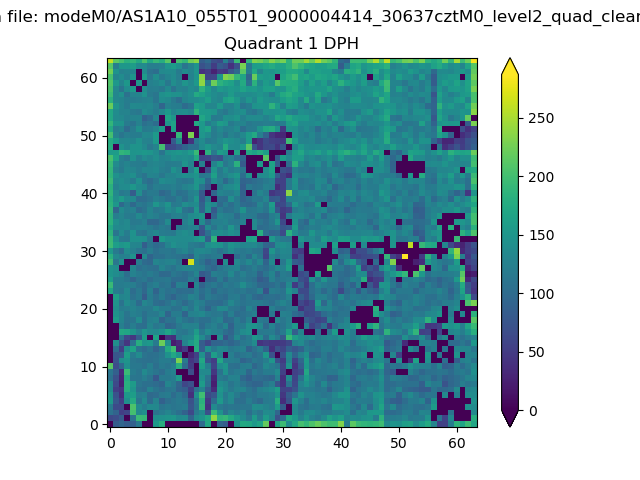
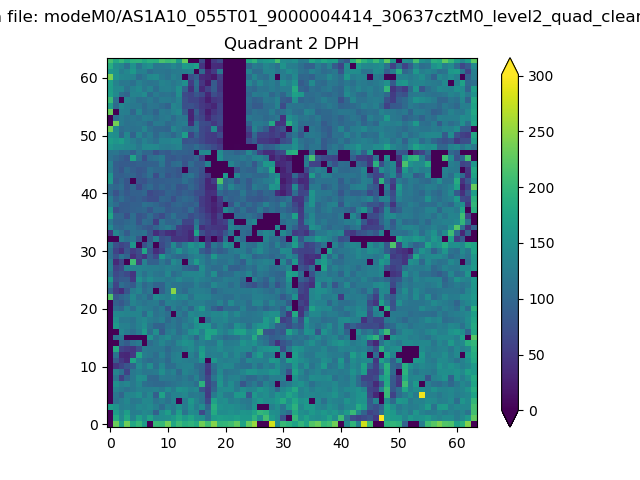
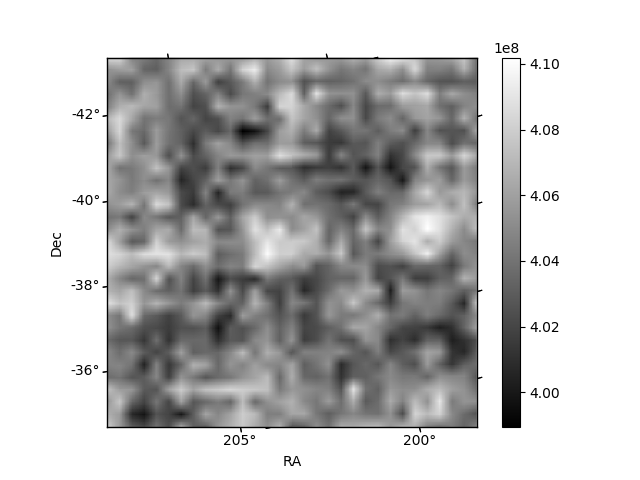
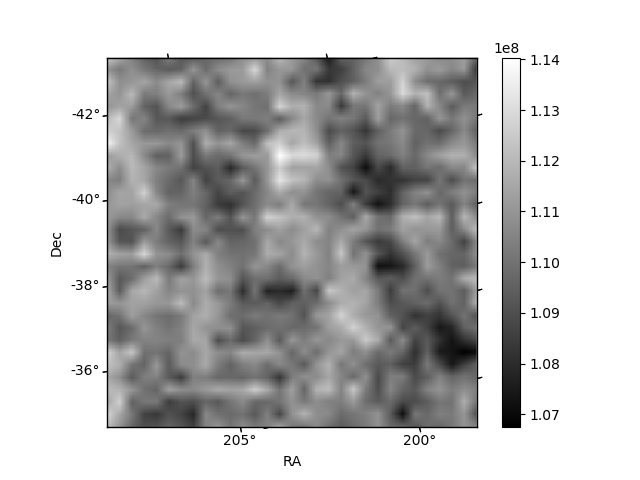
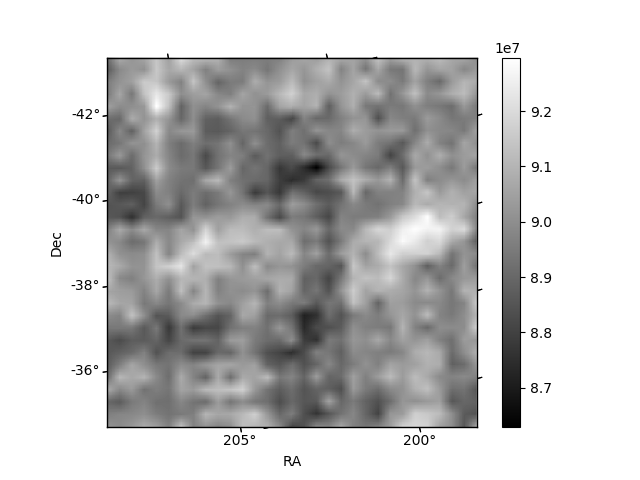
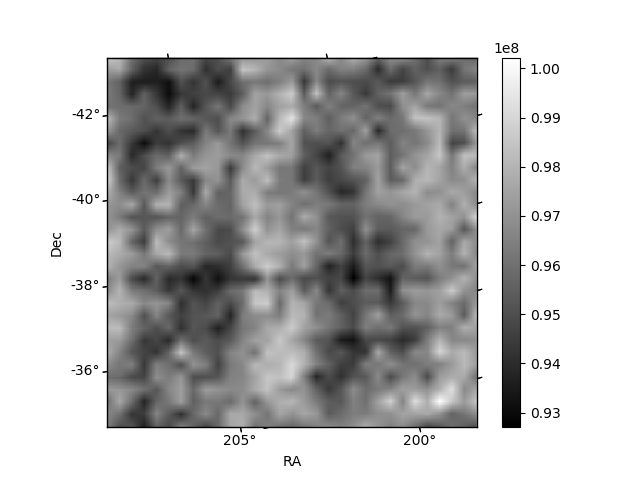
Histogram calculated using DETX and DETY for each event in the final _common_clean file
| Quadrant A | 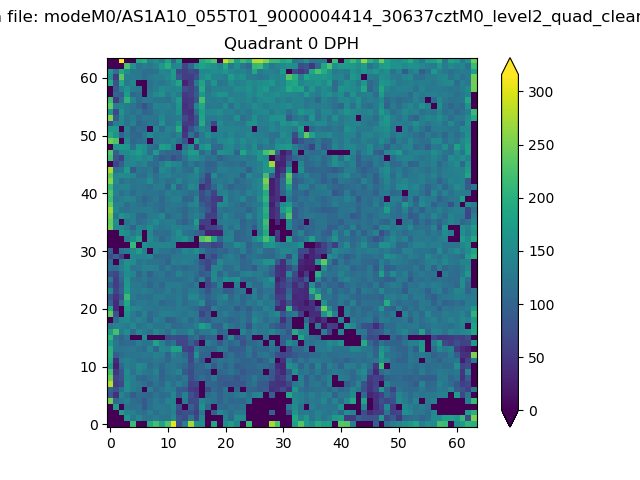 |
 |
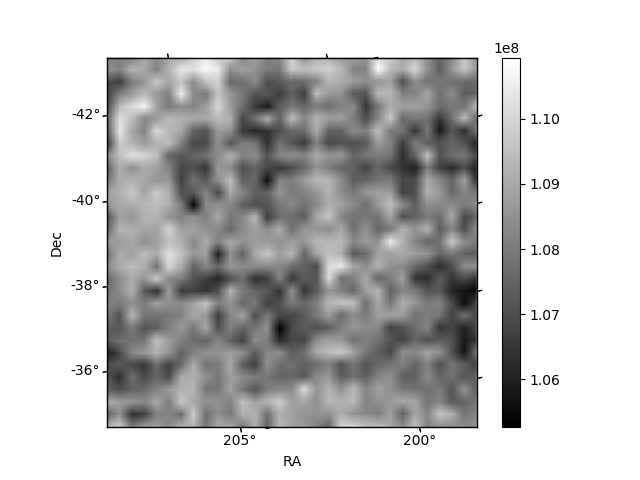
Quadrant B |
|---|---|---|---|
| Quadrant D | 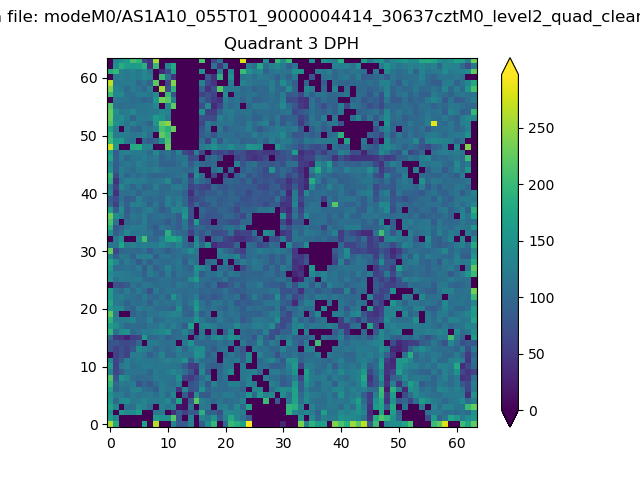 |
 |
Quadrant C |
| Plot type | Count rate plots | Images |
|---|---|---|
| Comparison with Poisson distribution Blue bars denote a histogram of data divided into 1 sec bins. Red curve is a Poisson curve with rate = median count rate of data. |
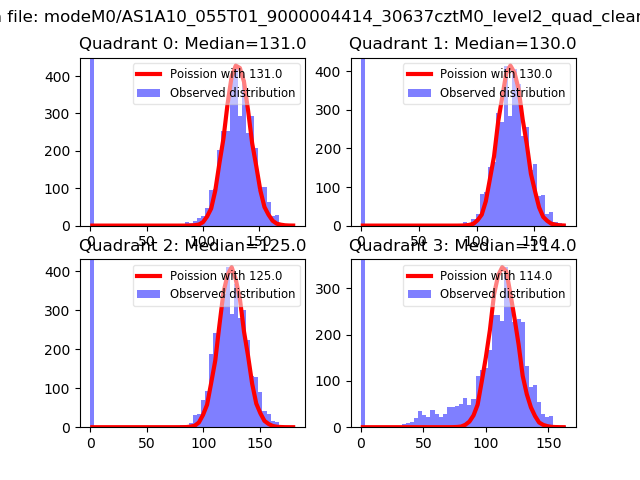 |
 |
| Quadrant-wise count rates Data is divided into 100 sec bins |
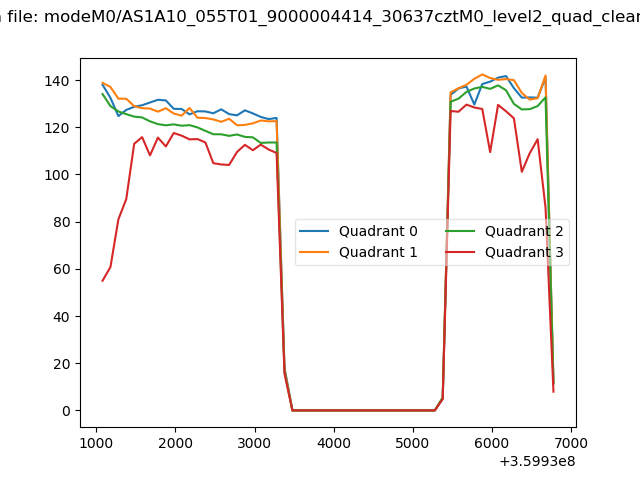 |
|
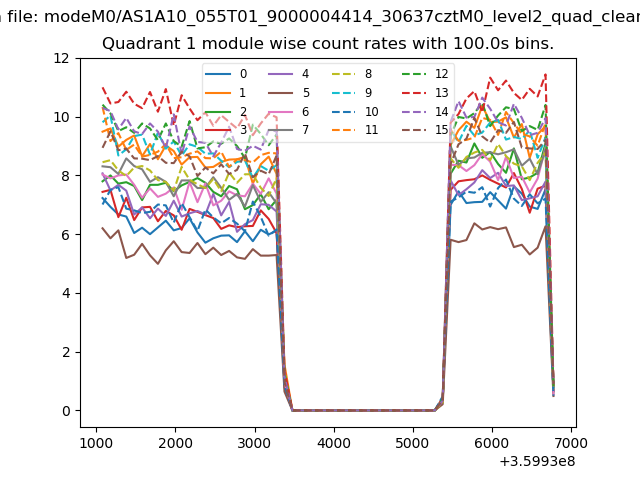
| Module-wise count rates for Quadrant A Data is divided into 100 sec bins |
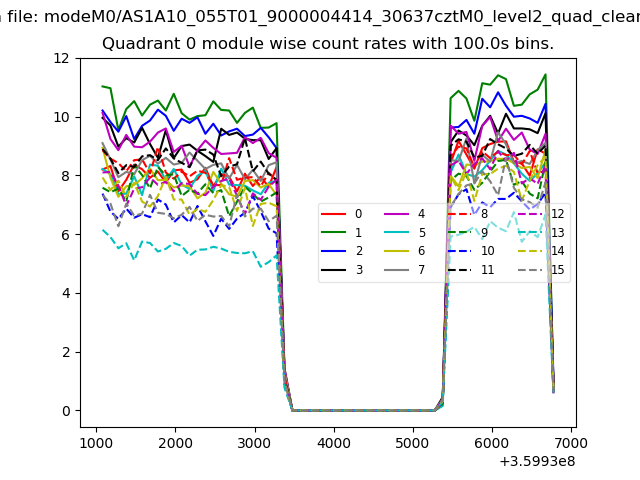 |
 |
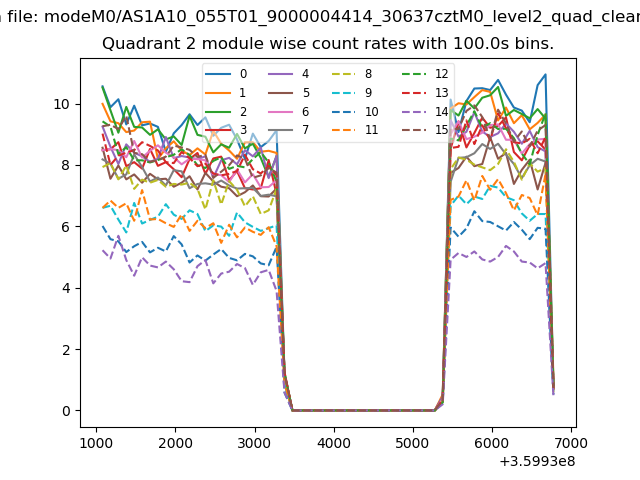
| Module-wise count rates for Quadrant B Data is divided into 100 sec bins |
 |
 |
| Module-wise count rates for Quadrant C Data is divided into 100 sec bins |
 |
 |
| Module-wise count rates for Quadrant D Data is divided into 100 sec bins |
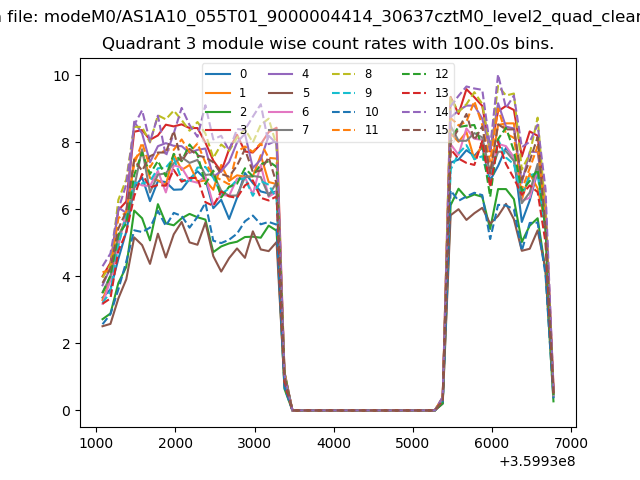 |
 |
| Parameter | Plot |
|---|---|
| CZT HV Monitor | 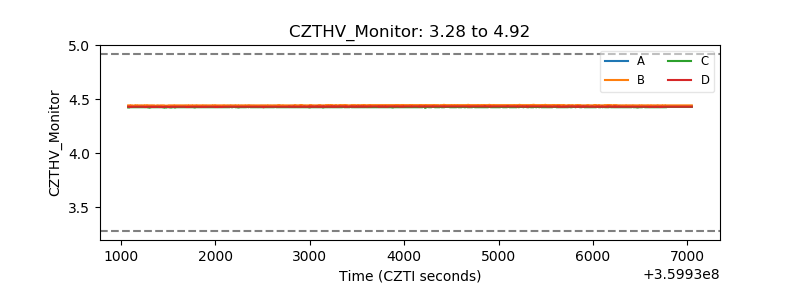 |
| D_VDD | 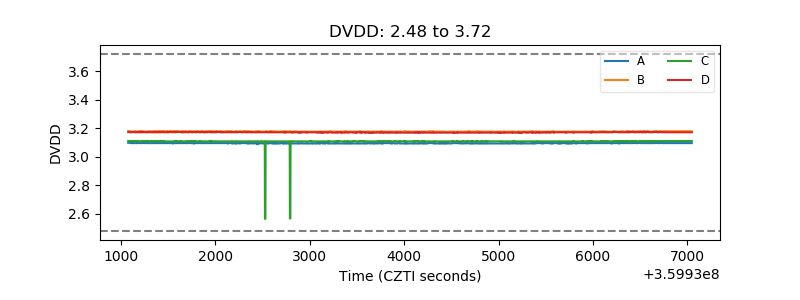 |
| Temperature 1 | 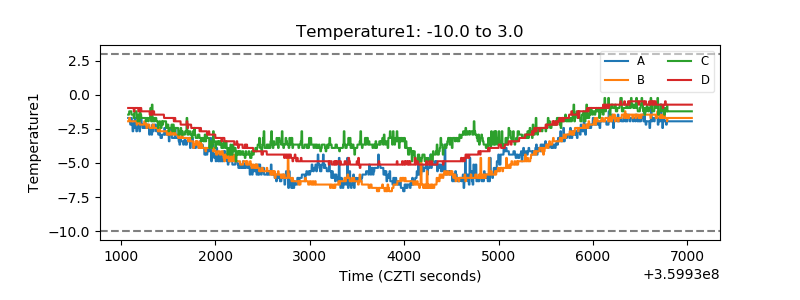 |
| Veto HV Monitor | 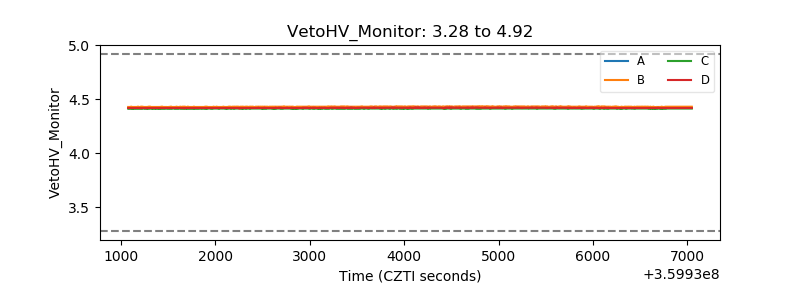 |
| Veto LLD | 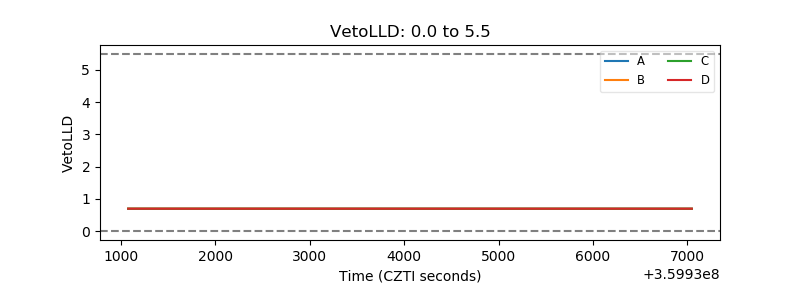 |
| Alpha Counter | 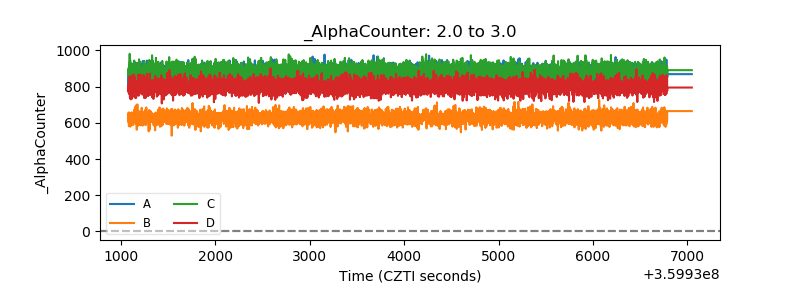 |
| _CPM_Rate | 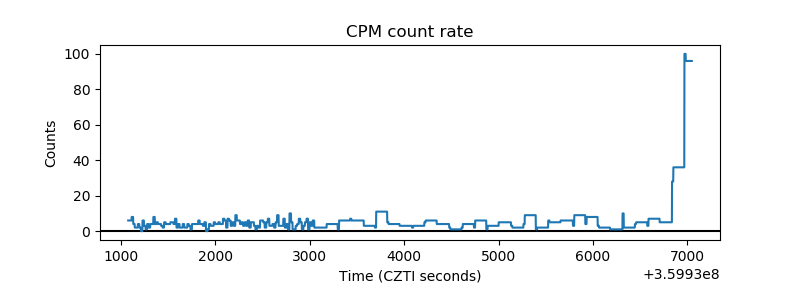 |
| CZT Counter | 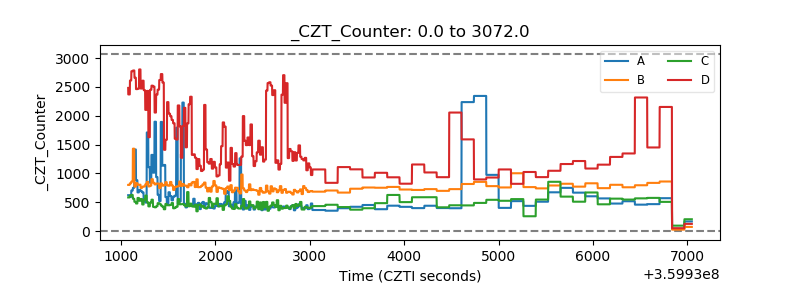 |
| +2.5 Volts monitor |  |
| +5 Volts monitor |  |
| _ROLL_ROT | 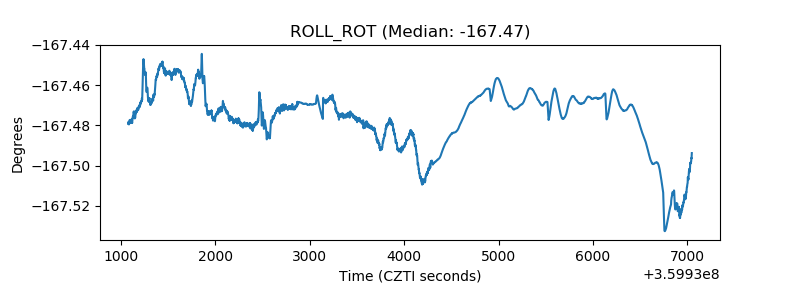 |
| _Roll_DEC | 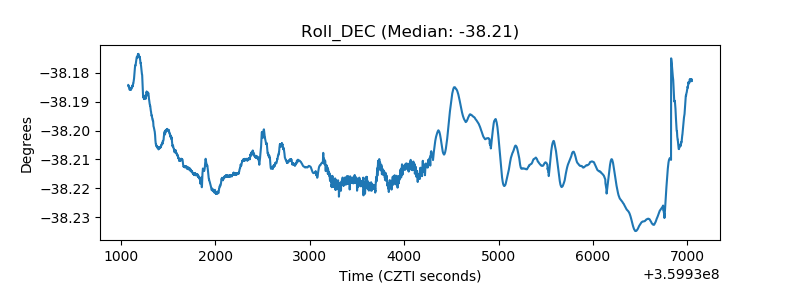 |
| _Roll_RA | 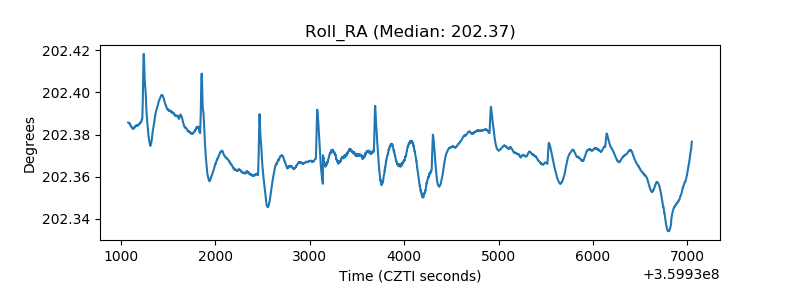 |
| Veto Counter | 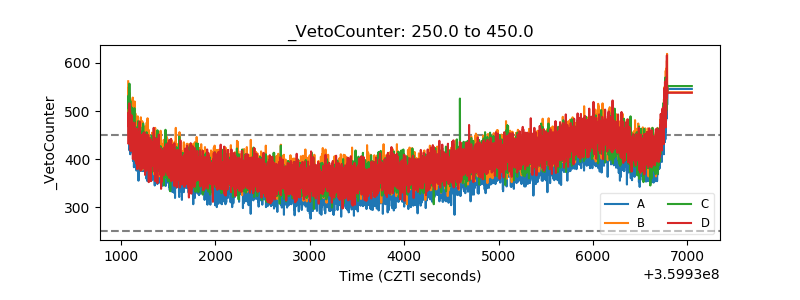 |