| Param | Original file | Final file |
|---|---|---|
| Filename | modeM0/AS1A10_055T01_9000004414_30638cztM0_level2.evt | modeM0/AS1A10_055T01_9000004414_30638cztM0_level2_quad_clean.evt |
| Size (bytes) | 230,584,320 | 35,709,120 |
| Size | 219.9 MB | 34.1 MB |
| Events in quadrant A | 962,341 | 252,092 |
| Events in quadrant B | 1,452,838 | 249,033 |
| Events in quadrant C | 965,030 | 237,716 |
| Events in quadrant D | 3,470,662 | 201,687 |
| Mode M9 | |||
|---|---|---|---|
| Quadrant | BADHDUFLAG | Total packets | Discarded packets |
| A | 0 | 5 | 0 |
| B | 0 | 5 | 0 |
| C | 0 | 5 | 0 |
| D | 0 | 5 | 0 |
| Mode M0 | |||
|---|---|---|---|
| Quadrant | BADHDUFLAG | Total packets | Discarded packets |
| A | 0 | 4113 | 1 |
| B | 0 | 5814 | 1 |
| C | 0 | 4143 | 1 |
| D | 0 | 11617 | 1 |
| Mode SS | |||
|---|---|---|---|
| Quadrant | BADHDUFLAG | Total packets | Discarded packets |
| A | 0 | 42 | 0 |
| B | 0 | 42 | 0 |
| C | 0 | 42 | 0 |
| D | 0 | 42 | 0 |
| Quadrant | Total seconds | Saturated seconds | Saturation percentage |
|---|---|---|---|
| A | 1919 | 17 | 0.885878% |
| B | 1920 | 15 | 0.781250% |
| C | 1920 | 25 | 1.302083% |
| D | 1920 | 612 | 31.875000% |
Noise dominated data is calculated using 1-second bins in cleaned event files. If a bin has >2000 counts, and if more than 50% of those come from <1% of pixels, then it is considered to be noise-dominated and hence unusable.
| Quadrant | # 1 sec bins | Bins with >0 counts | Bins with >2000 counts | High rate bins dominated by noise | Noise dominated (total time) | Noise dominated (detector-on time) | Marked lightcurve |
|---|---|---|---|---|---|---|---|
| A | 2464 | 1920 | 2 | 2 | 0.08% | 0.10% | 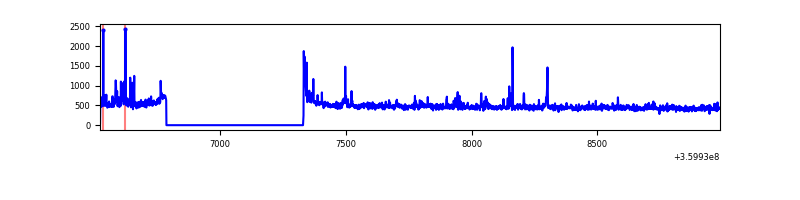 |
| B | 2465 | 1921 | 0 | 0 | 0.00% | 0.00% | 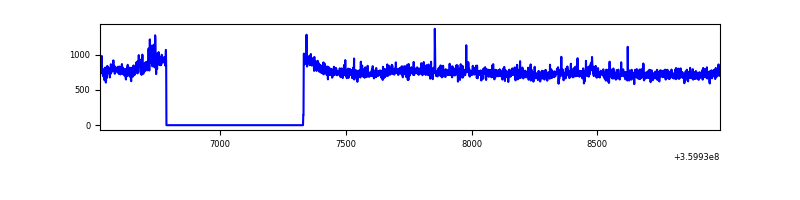 |
| C | 2465 | 1921 | 4 | 4 | 0.16% | 0.21% | 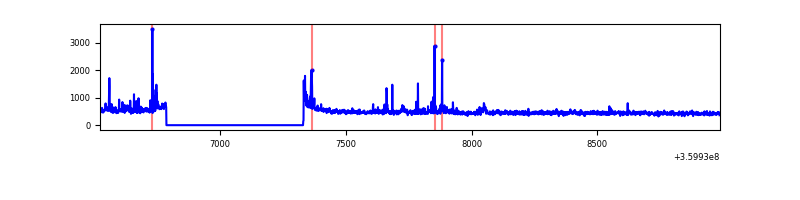 |
| D | 2465 | 1921 | 640 | 640 | 25.96% | 33.32% | 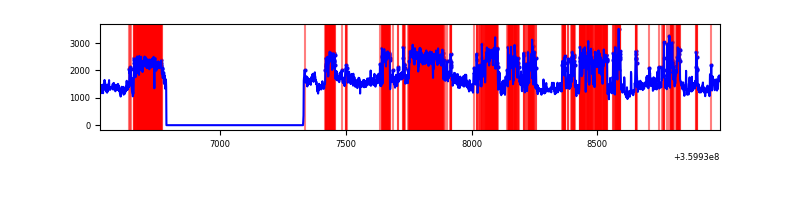 |
Top three noisy pixels from each quadrant. If the there are fewer than three noisy pixels in the level2.evt file, extra rows are filled as -1
| Pixel properties | Quadrant properties | ||||||
|---|---|---|---|---|---|---|---|
| Quadrant | DetID | PixID | Counts | Sigma | Mean | Median | Sigma |
| A | 0 | 13 | 54844 | 1134.19 | 231 | 228 | 48.2 |
| A | 8 | 192 | 7233 | 145.47 | 231 | 228 | 48.2 |
| A | 0 | 31 | 4861 | 96.21 | 231 | 228 | 48.2 |
| B | 6 | 159 | 532757 | 11159.43 | 229 | 223 | 47.7 |
| B | 0 | 229 | 7735 | 157.42 | 229 | 223 | 47.7 |
| B | 5 | 172 | 7553 | 153.6 | 229 | 223 | 47.7 |
| C | 15 | 208 | 47718 | 905.85 | 216 | 217 | 52.4 |
| C | 14 | 238 | 34520 | 654.16 | 216 | 217 | 52.4 |
| C | 0 | 10 | 15569 | 292.76 | 216 | 217 | 52.4 |
| D | 8 | 195 | 2168655 | 43645.38 | 200 | 194 | 49.7 |
| D | 12 | 33 | 371786 | 7479.16 | 200 | 194 | 49.7 |
| D | 1 | 52 | 85752 | 1722.06 | 200 | 194 | 49.7 |
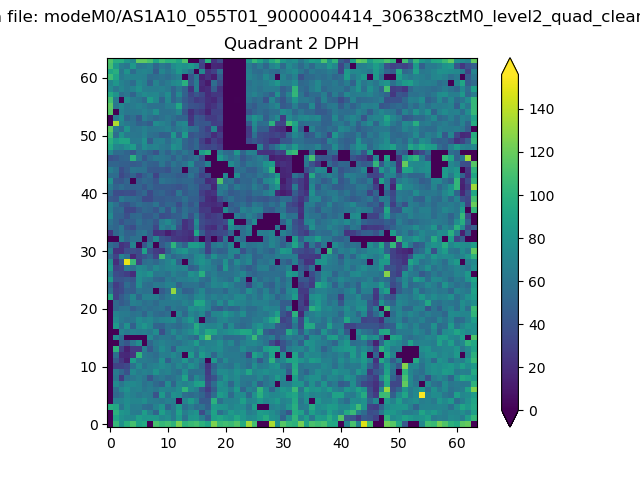
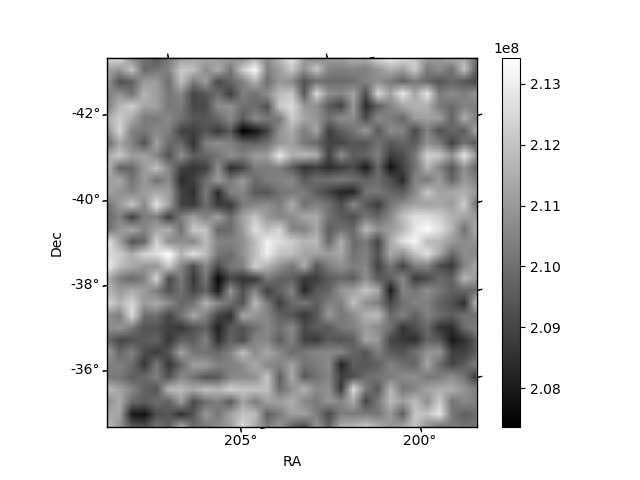
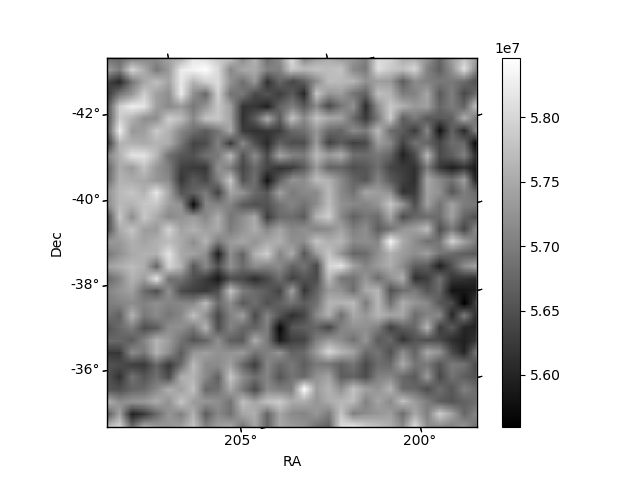
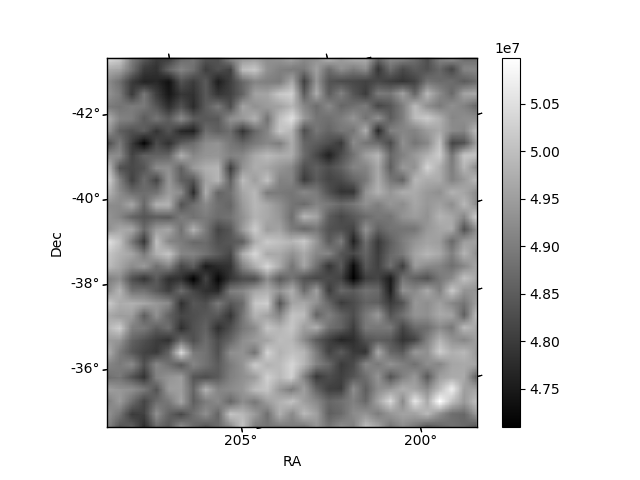
Histogram calculated using DETX and DETY for each event in the final _common_clean file
| Quadrant A | 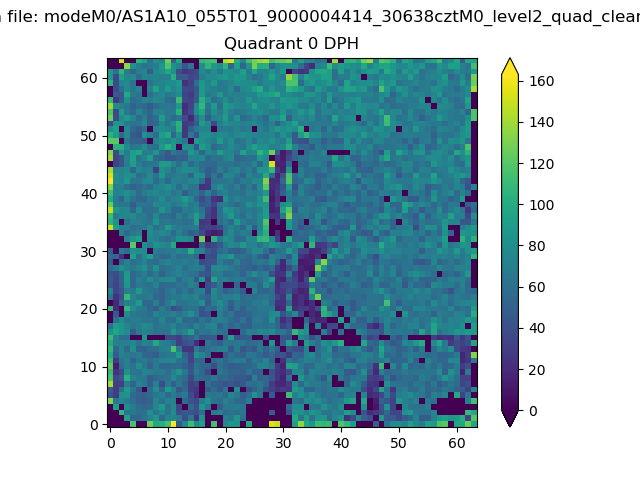 |
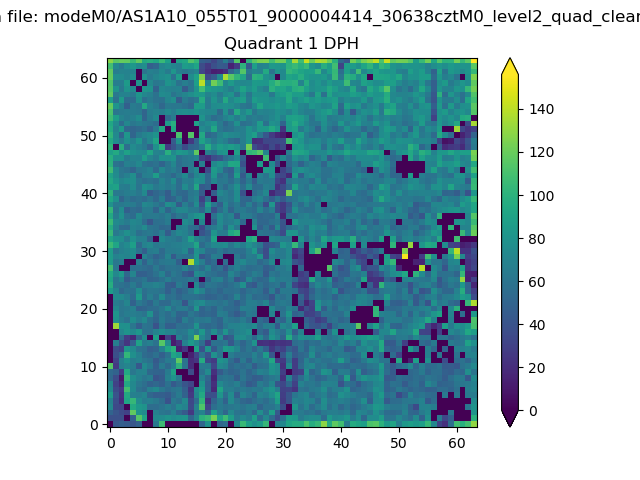 |
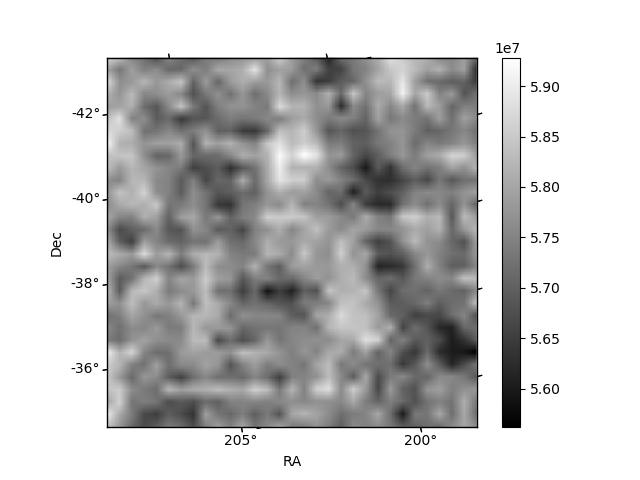
Quadrant B |
|---|---|---|---|
| Quadrant D | 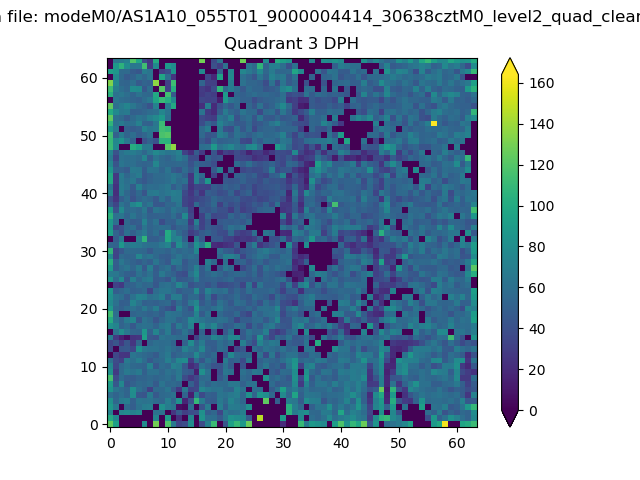 |
 |
Quadrant C |
| Plot type | Count rate plots | Images |
|---|---|---|
| Comparison with Poisson distribution Blue bars denote a histogram of data divided into 1 sec bins. Red curve is a Poisson curve with rate = median count rate of data. |
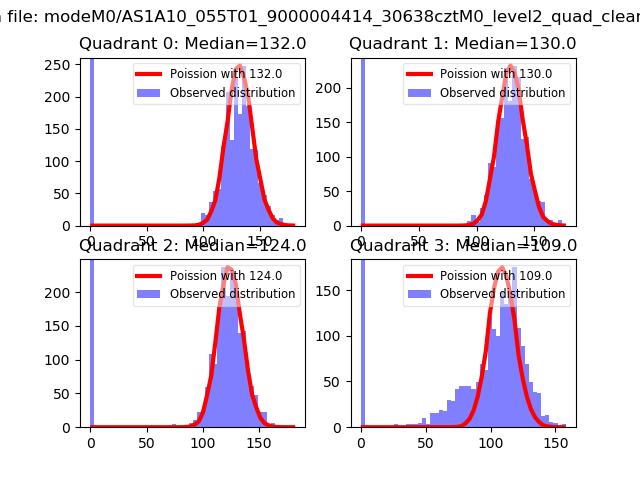 |
 |
| Quadrant-wise count rates Data is divided into 100 sec bins |
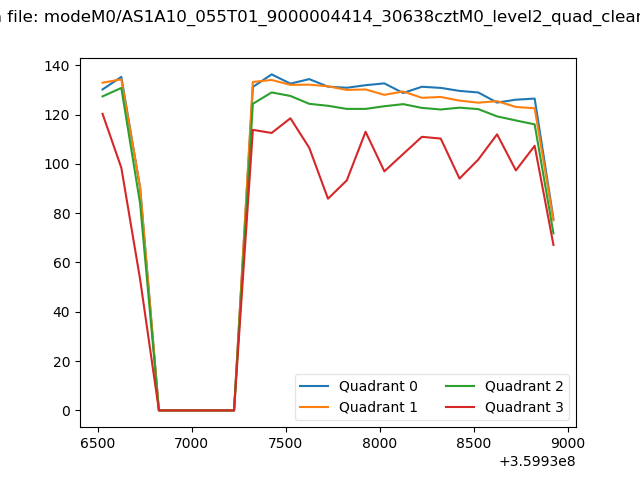 |
|
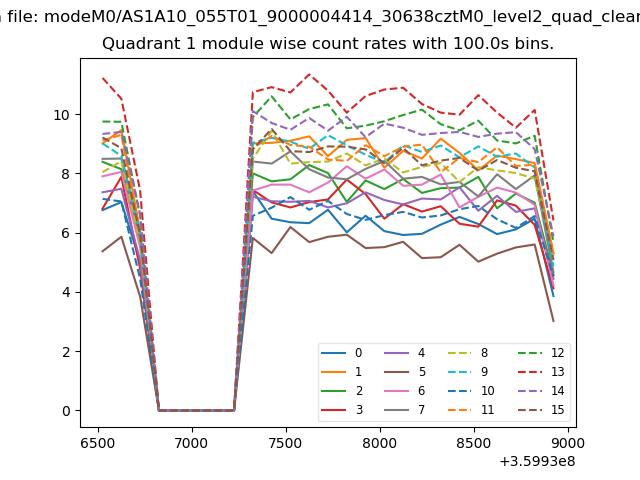
| Module-wise count rates for Quadrant A Data is divided into 100 sec bins |
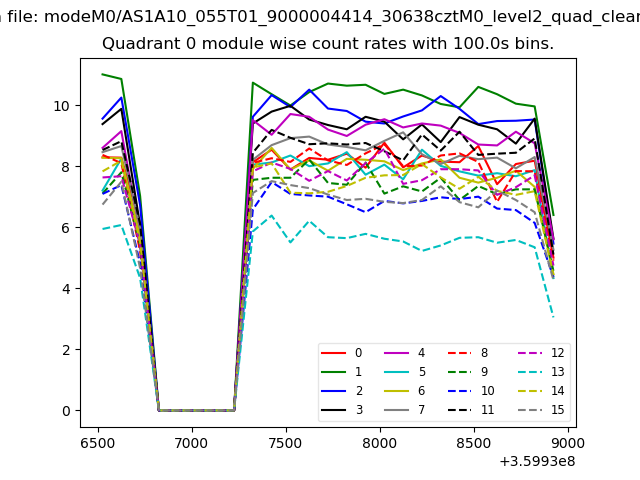 |
 |
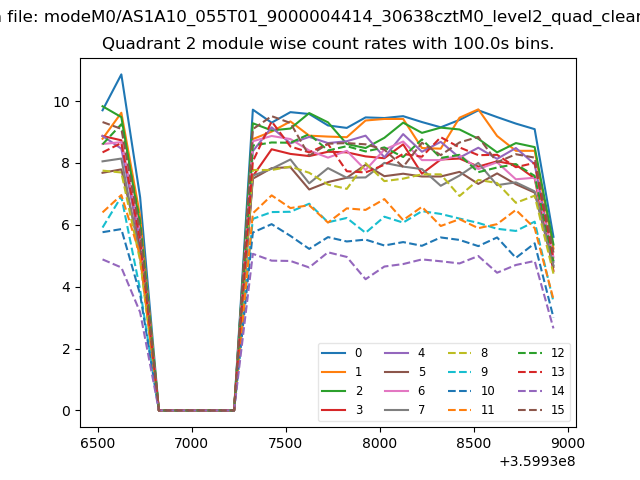
| Module-wise count rates for Quadrant B Data is divided into 100 sec bins |
 |
 |
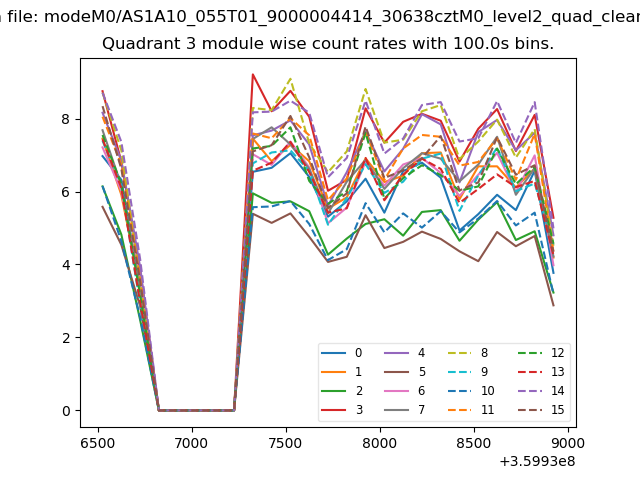
| Module-wise count rates for Quadrant C Data is divided into 100 sec bins |
 |
 |
| Module-wise count rates for Quadrant D Data is divided into 100 sec bins |
 |
 |
| Parameter | Plot |
|---|---|
| CZT HV Monitor | 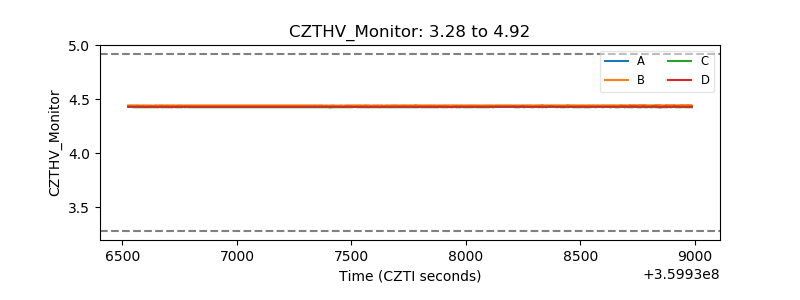 |
| D_VDD | 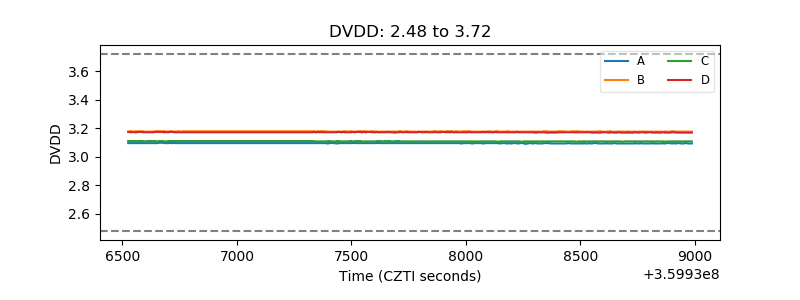 |
| Temperature 1 |  |
| Veto HV Monitor | 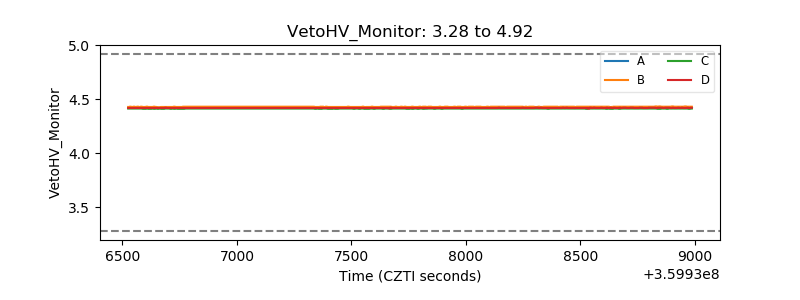 |
| Veto LLD | 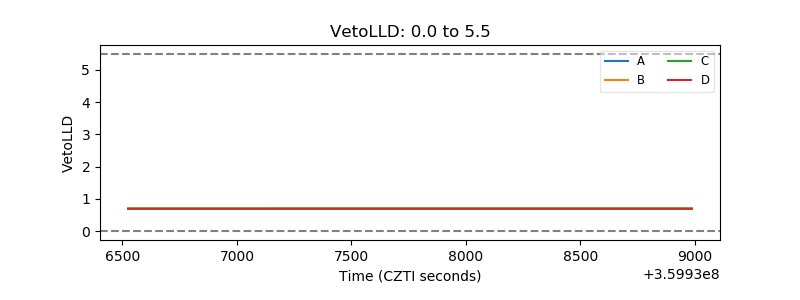 |
| Alpha Counter | 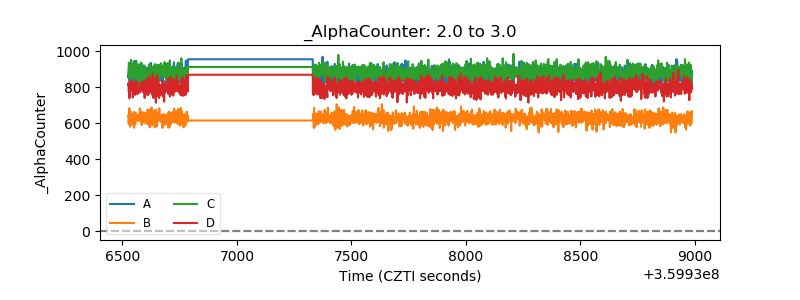 |
| _CPM_Rate | 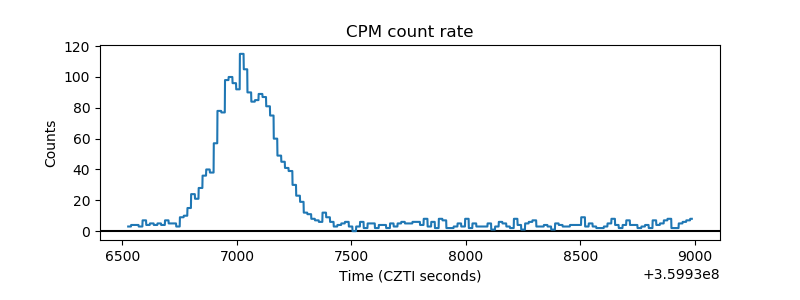 |
| CZT Counter | 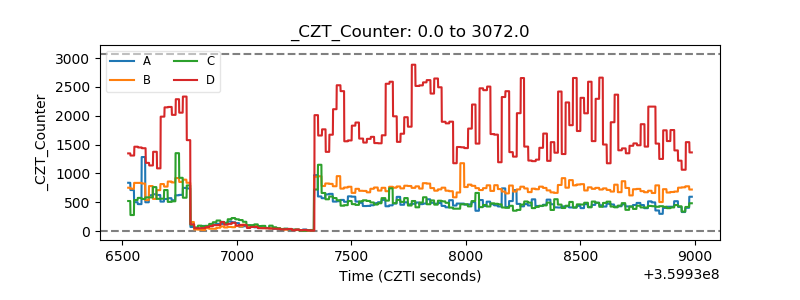 |
| +2.5 Volts monitor |  |
| +5 Volts monitor |  |
| _ROLL_ROT | 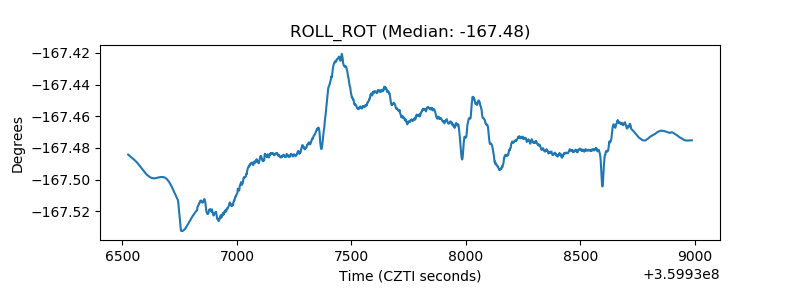 |
| _Roll_DEC |  |
| _Roll_RA | 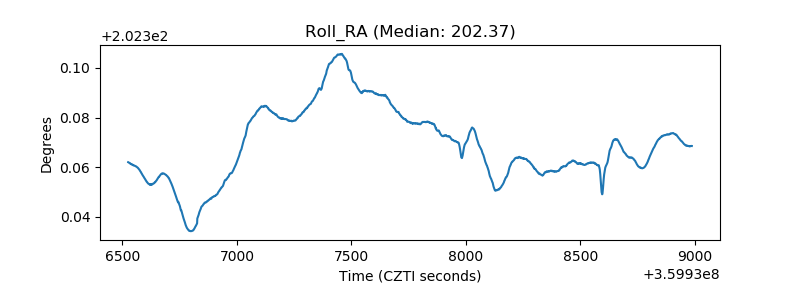 |
| Veto Counter | 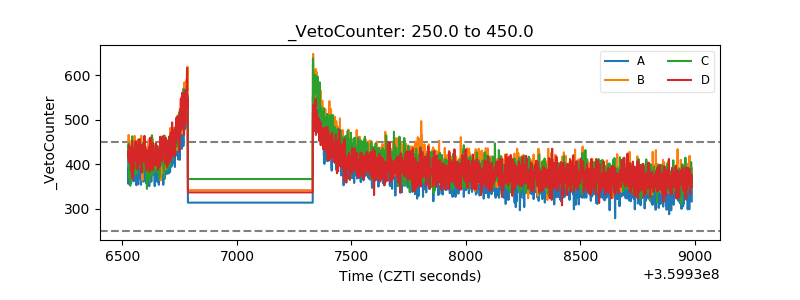 |