| Param | Original file | Final file |
|---|---|---|
| Filename | modeM0/AS1A10_103T02_9000004416_30638cztM0_level2.evt | modeM0/AS1A10_103T02_9000004416_30638cztM0_level2_quad_clean.evt |
| Size (bytes) | 1,179,296,640 | 124,099,200 |
| Size | 1.1 GB | 118.4 MB |
| Events in quadrant A | 4,928,540 | 811,583 |
| Events in quadrant B | 7,565,523 | 816,635 |
| Events in quadrant C | 5,044,504 | 785,022 |
| Events in quadrant D | 17,504,951 | 652,323 |
| Mode M9 | |||
|---|---|---|---|
| Quadrant | BADHDUFLAG | Total packets | Discarded packets |
| A | 0 | 16 | 0 |
| B | 0 | 16 | 0 |
| C | 0 | 16 | 0 |
| D | 0 | 16 | 0 |
| Mode M0 | |||
|---|---|---|---|
| Quadrant | BADHDUFLAG | Total packets | Discarded packets |
| A | 0 | 20930 | 1 |
| B | 0 | 30067 | 1 |
| C | 0 | 20911 | 2 |
| D | 0 | 58954 | 1 |
| Mode SS | |||
|---|---|---|---|
| Quadrant | BADHDUFLAG | Total packets | Discarded packets |
| A | 0 | 202 | 0 |
| B | 0 | 202 | 0 |
| C | 0 | 202 | 0 |
| D | 0 | 202 | 0 |
| Quadrant | Total seconds | Saturated seconds | Saturation percentage |
|---|---|---|---|
| A | 9992 | 41 | 0.410328% |
| B | 9992 | 116 | 1.160929% |
| C | 9991 | 132 | 1.321189% |
| D | 9991 | 3945 | 39.485537% |
Noise dominated data is calculated using 1-second bins in cleaned event files. If a bin has >2000 counts, and if more than 50% of those come from <1% of pixels, then it is considered to be noise-dominated and hence unusable.
| Quadrant | # 1 sec bins | Bins with >0 counts | Bins with >2000 counts | High rate bins dominated by noise | Noise dominated (total time) | Noise dominated (detector-on time) | Marked lightcurve |
|---|---|---|---|---|---|---|---|
| A | 11577 | 9994 | 7 | 7 | 0.06% | 0.07% | 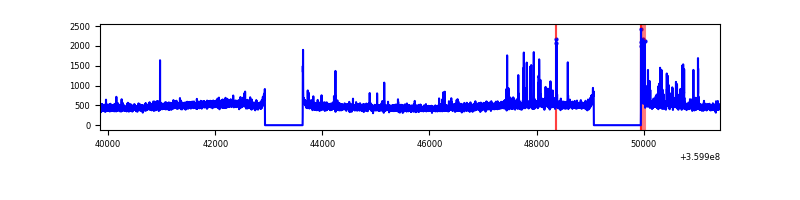 |
| B | 11577 | 9994 | 2 | 2 | 0.02% | 0.02% | 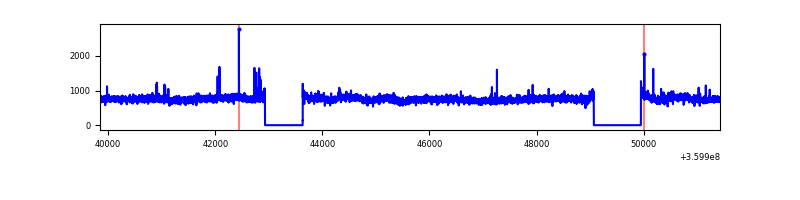 |
| C | 11576 | 9993 | 15 | 15 | 0.13% | 0.15% | 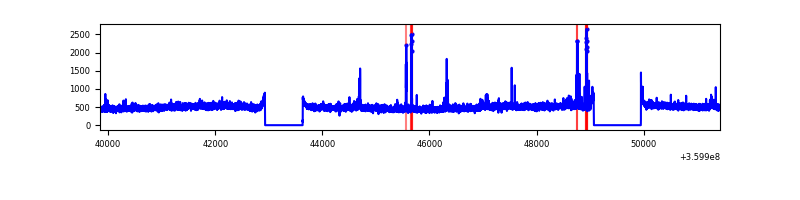 |
| D | 11576 | 9993 | 3850 | 3850 | 33.26% | 38.53% | 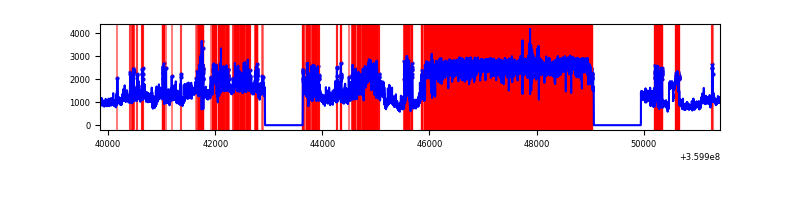 |
Top three noisy pixels from each quadrant. If the there are fewer than three noisy pixels in the level2.evt file, extra rows are filled as -1
| Pixel properties | Quadrant properties | ||||||
|---|---|---|---|---|---|---|---|
| Quadrant | DetID | PixID | Counts | Sigma | Mean | Median | Sigma |
| A | 0 | 13 | 192485 | 788.61 | 1218 | 1193 | 242.6 |
| A | 8 | 192 | 19894 | 77.1 | 1218 | 1193 | 242.6 |
| A | 0 | 31 | 17186 | 65.93 | 1218 | 1193 | 242.6 |
| B | 6 | 159 | 2730728 | 11773.43 | 1208 | 1177 | 231.8 |
| B | 0 | 229 | 50288 | 211.83 | 1208 | 1177 | 231.8 |
| B | 12 | 111 | 28916 | 119.65 | 1208 | 1177 | 231.8 |
| C | 14 | 238 | 190502 | 682.35 | 1181 | 1188 | 277.4 |
| C | 10 | 22 | 152313 | 544.71 | 1181 | 1188 | 277.4 |
| C | 3 | 233 | 65739 | 232.66 | 1181 | 1188 | 277.4 |
| D | 10 | 253 | 6428684 | 27866.15 | 978 | 952 | 230.7 |
| D | 8 | 195 | 6209635 | 26916.51 | 978 | 952 | 230.7 |
| D | 1 | 52 | 618346 | 2676.59 | 978 | 952 | 230.7 |
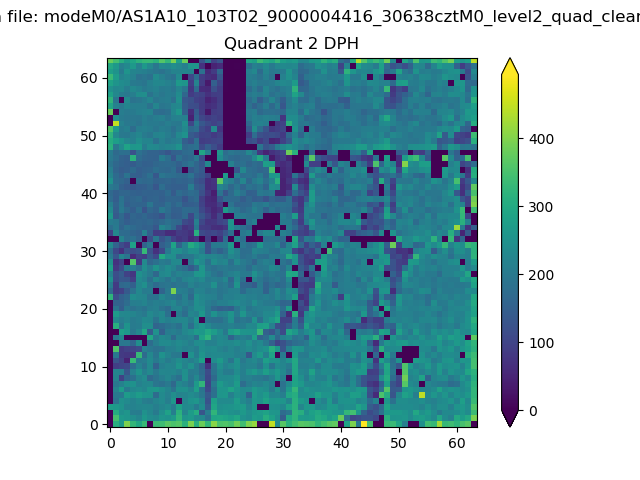
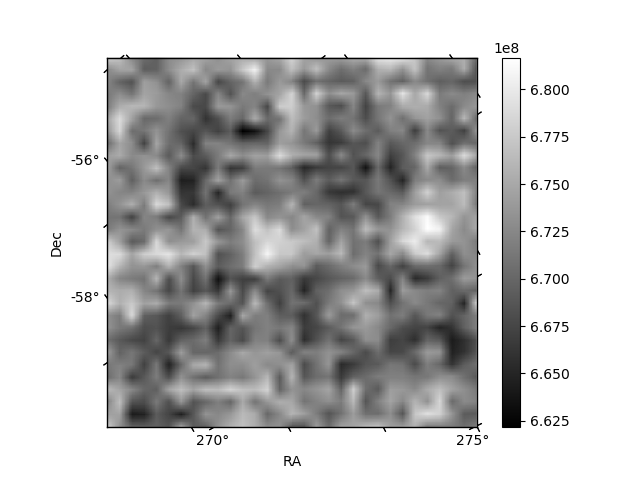
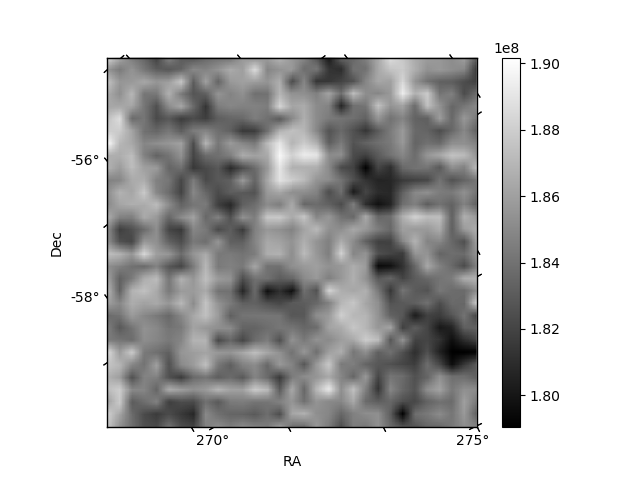
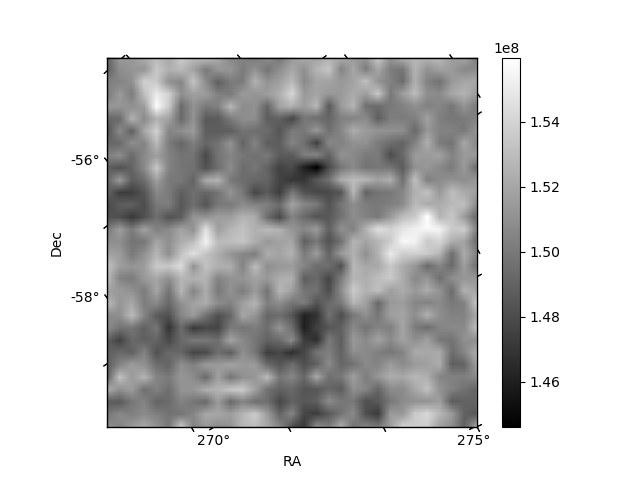
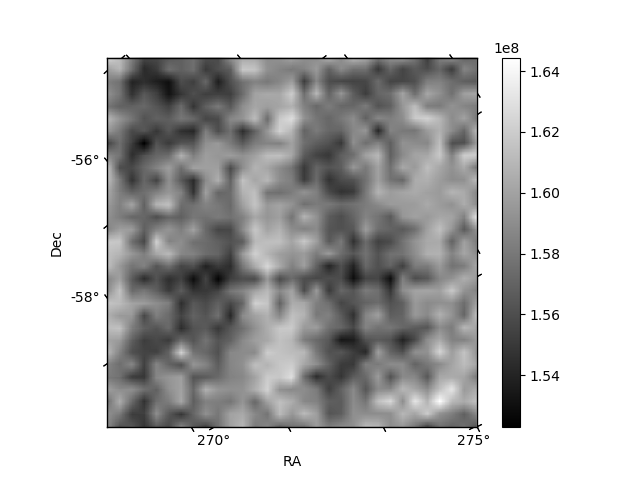
Histogram calculated using DETX and DETY for each event in the final _common_clean file
| Quadrant A | 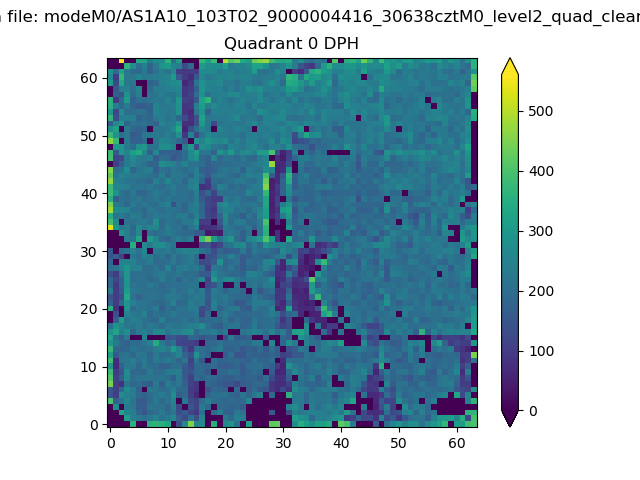 |
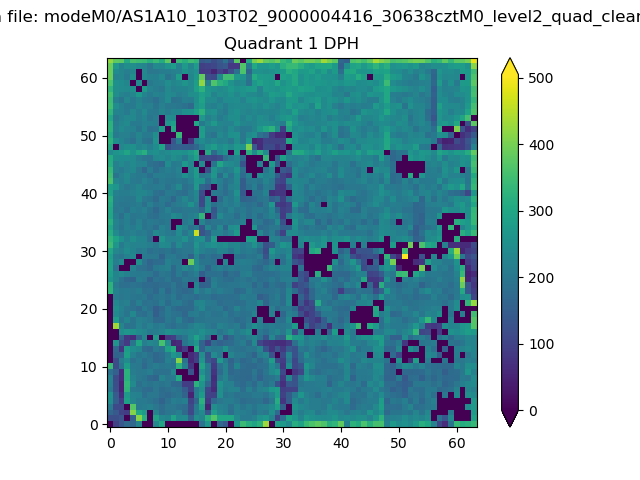 |
Quadrant B |
|---|---|---|---|
| Quadrant D | 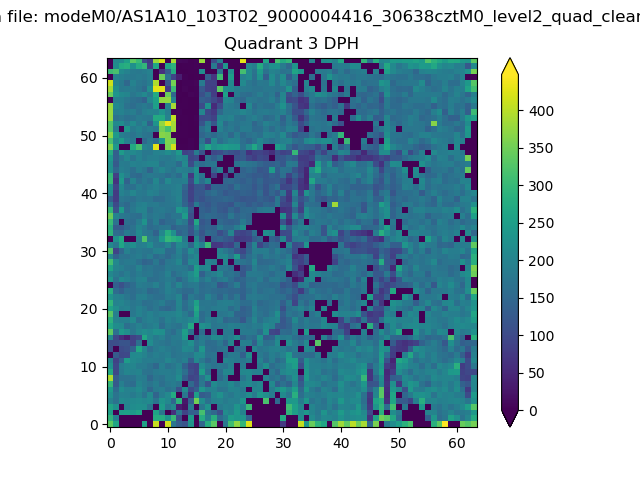 |
 |
Quadrant C |
| Plot type | Count rate plots | Images |
|---|---|---|
| Comparison with Poisson distribution Blue bars denote a histogram of data divided into 1 sec bins. Red curve is a Poisson curve with rate = median count rate of data. |
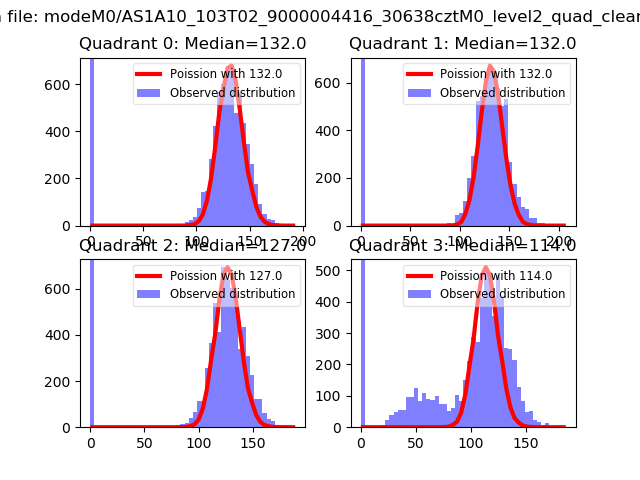 |
 |
| Quadrant-wise count rates Data is divided into 100 sec bins |
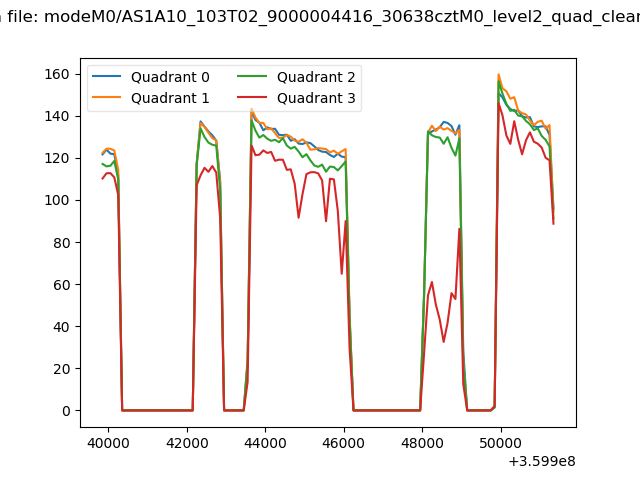 |
|
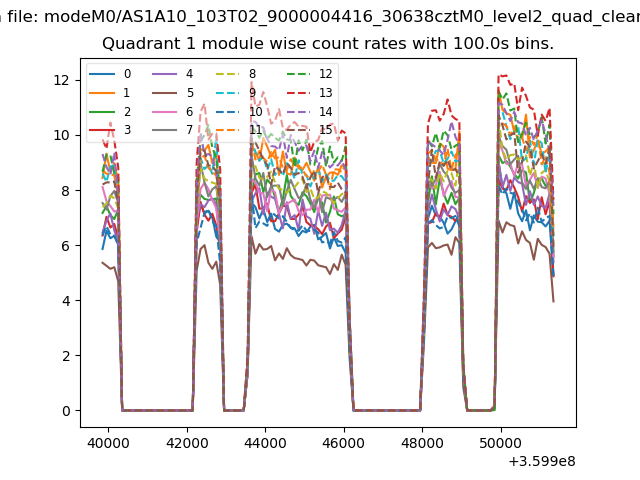
| Module-wise count rates for Quadrant A Data is divided into 100 sec bins |
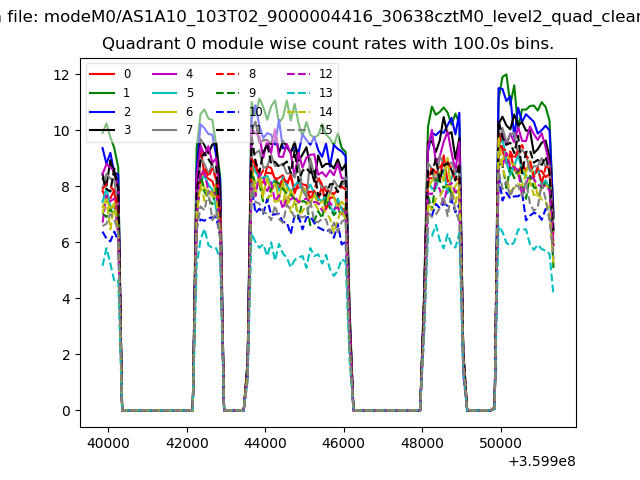 |
 |
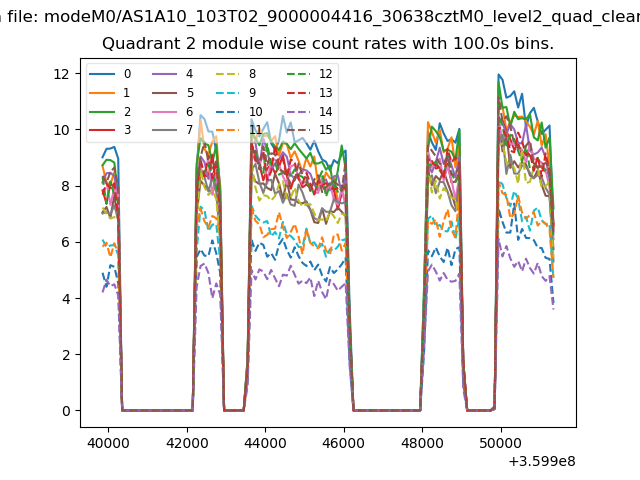
| Module-wise count rates for Quadrant B Data is divided into 100 sec bins |
 |
 |
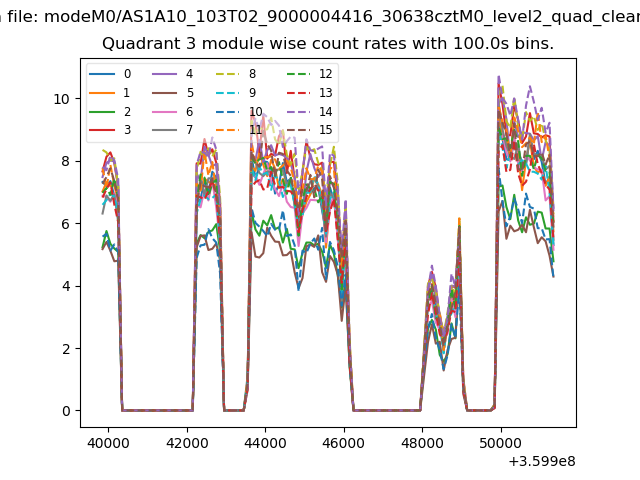
| Module-wise count rates for Quadrant C Data is divided into 100 sec bins |
 |
 |
| Module-wise count rates for Quadrant D Data is divided into 100 sec bins |
 |
 |
| Parameter | Plot |
|---|---|
| CZT HV Monitor | 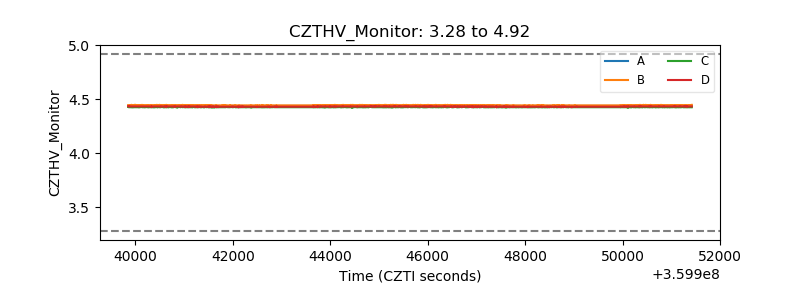 |
| D_VDD |  |
| Temperature 1 | 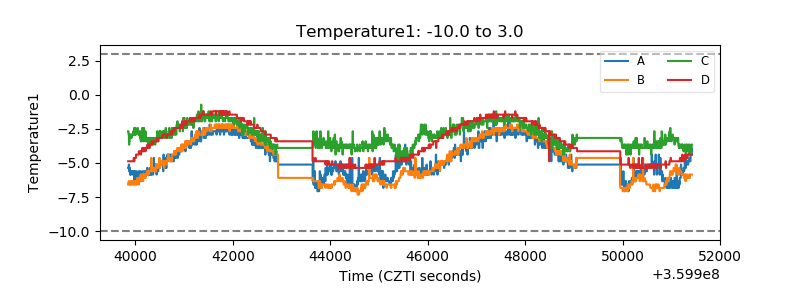 |
| Veto HV Monitor | 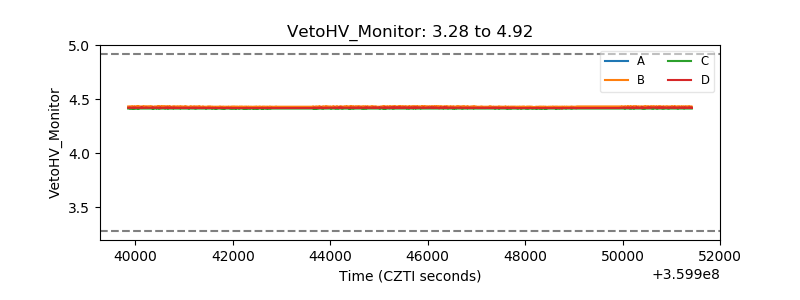 |
| Veto LLD | 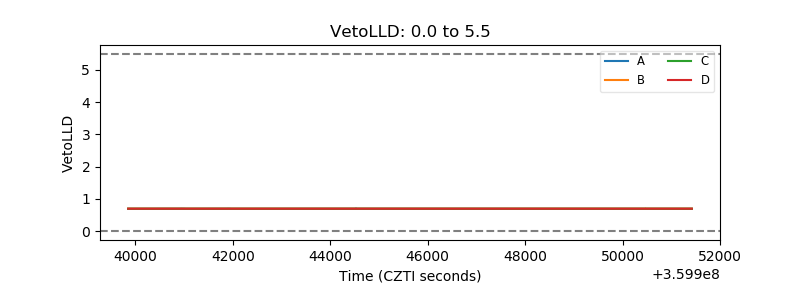 |
| Alpha Counter | 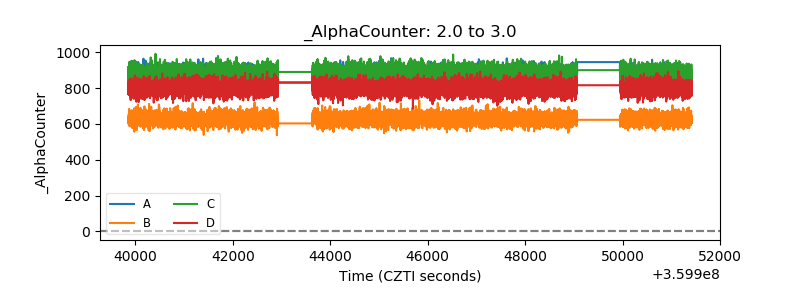 |
| _CPM_Rate | 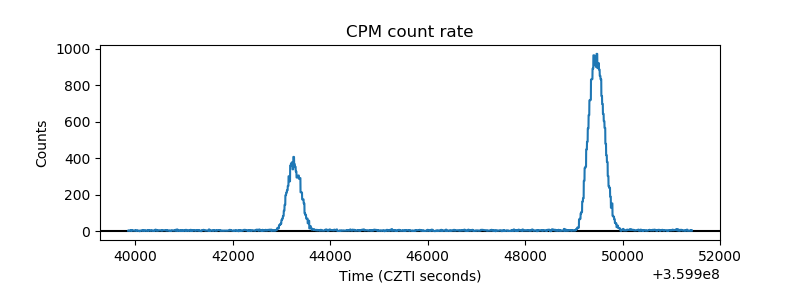 |
| CZT Counter | 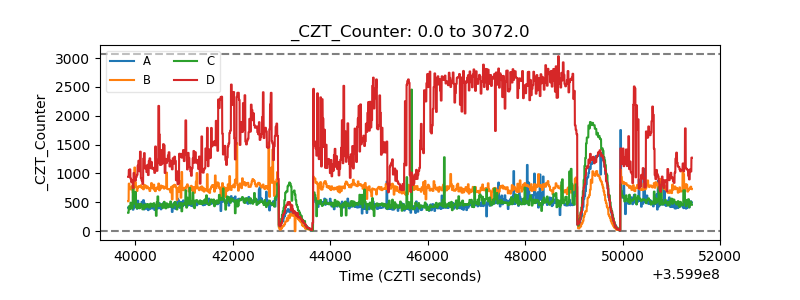 |
| +2.5 Volts monitor |  |
| +5 Volts monitor |  |
| _ROLL_ROT | 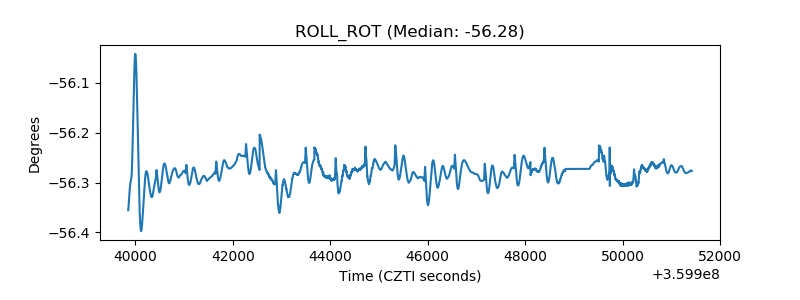 |
| _Roll_DEC | 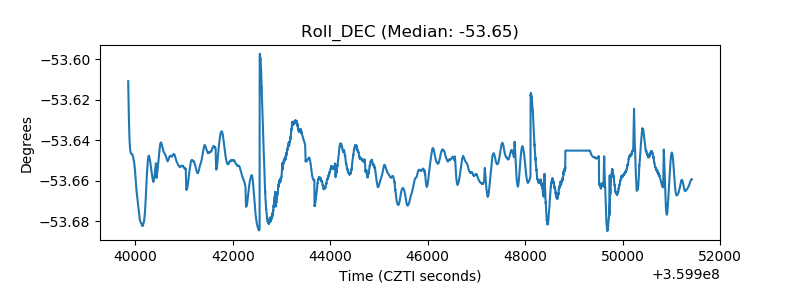 |
| _Roll_RA | 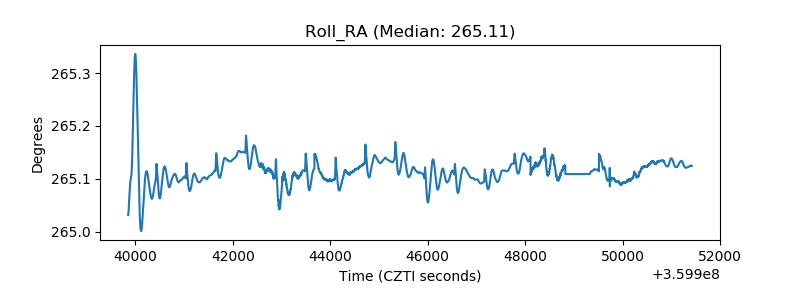 |
| Veto Counter | 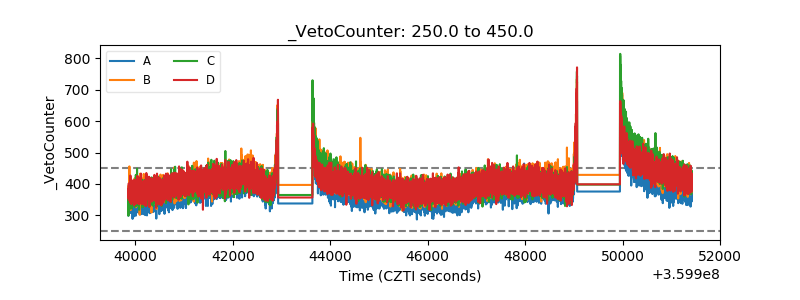 |