| Param | Original file | Final file |
|---|---|---|
| Filename | modeM0/AS1A10_103T02_9000004416_30639cztM0_level2.evt | modeM0/AS1A10_103T02_9000004416_30639cztM0_level2_quad_clean.evt |
| Size (bytes) | 734,535,360 | 102,669,120 |
| Size | 700.5 MB | 97.9 MB |
| Events in quadrant A | 3,482,034 | 681,480 |
| Events in quadrant B | 5,476,892 | 684,596 |
| Events in quadrant C | 3,548,309 | 667,352 |
| Events in quadrant D | 9,283,453 | 605,108 |
| Mode M9 | |||
|---|---|---|---|
| Quadrant | BADHDUFLAG | Total packets | Discarded packets |
| A | 0 | 19 | 0 |
| B | 0 | 19 | 0 |
| C | 0 | 19 | 0 |
| D | 0 | 19 | 0 |
| Mode M0 | |||
|---|---|---|---|
| Quadrant | BADHDUFLAG | Total packets | Discarded packets |
| A | 0 | 14553 | 1 |
| B | 0 | 21350 | 1 |
| C | 0 | 14570 | 2 |
| D | 0 | 32305 | 1 |
| Mode SS | |||
|---|---|---|---|
| Quadrant | BADHDUFLAG | Total packets | Discarded packets |
| A | 0 | 138 | 0 |
| B | 0 | 138 | 0 |
| C | 0 | 138 | 0 |
| D | 0 | 138 | 0 |
| Quadrant | Total seconds | Saturated seconds | Saturation percentage |
|---|---|---|---|
| A | 6752 | 97 | 1.436611% |
| B | 6753 | 209 | 3.094921% |
| C | 6752 | 147 | 2.177133% |
| D | 6752 | 997 | 14.765995% |
Noise dominated data is calculated using 1-second bins in cleaned event files. If a bin has >2000 counts, and if more than 50% of those come from <1% of pixels, then it is considered to be noise-dominated and hence unusable.
| Quadrant | # 1 sec bins | Bins with >0 counts | Bins with >2000 counts | High rate bins dominated by noise | Noise dominated (total time) | Noise dominated (detector-on time) | Marked lightcurve |
|---|---|---|---|---|---|---|---|
| A | 8657 | 6754 | 39 | 39 | 0.45% | 0.58% |  |
| B | 8658 | 6755 | 66 | 66 | 0.76% | 0.98% |  |
| C | 8657 | 6754 | 9 | 9 | 0.10% | 0.13% |  |
| D | 8657 | 6754 | 1095 | 1095 | 12.65% | 16.21% |  |
Top three noisy pixels from each quadrant. If the there are fewer than three noisy pixels in the level2.evt file, extra rows are filled as -1
| Pixel properties | Quadrant properties | ||||||
|---|---|---|---|---|---|---|---|
| Quadrant | DetID | PixID | Counts | Sigma | Mean | Median | Sigma |
| A | 0 | 13 | 200525 | 1188.83 | 842 | 825 | 168.0 |
| A | 8 | 192 | 25233 | 145.3 | 842 | 825 | 168.0 |
| A | 13 | 254 | 11936 | 66.14 | 842 | 825 | 168.0 |
| B | 6 | 159 | 1810488 | 11357.62 | 837 | 816 | 159.3 |
| B | 6 | 36 | 320606 | 2007.02 | 837 | 816 | 159.3 |
| B | 12 | 111 | 19535 | 117.48 | 837 | 816 | 159.3 |
| C | 14 | 238 | 134869 | 693.99 | 826 | 831 | 193.1 |
| C | 10 | 22 | 73965 | 378.66 | 826 | 831 | 193.1 |
| C | 3 | 233 | 64986 | 332.17 | 826 | 831 | 193.1 |
| D | 8 | 195 | 5549033 | 28880.46 | 798 | 779 | 192.1 |
| D | 12 | 33 | 255596 | 1326.41 | 798 | 779 | 192.1 |
| D | 10 | 253 | 250840 | 1301.65 | 798 | 779 | 192.1 |
Histogram calculated using DETX and DETY for each event in the final _common_clean file
| Quadrant A |  |
 |
Quadrant B |
|---|---|---|---|
| Quadrant D |  |
 |
Quadrant C |
| Plot type | Count rate plots | Images |
|---|---|---|
| Comparison with Poisson distribution Blue bars denote a histogram of data divided into 1 sec bins. Red curve is a Poisson curve with rate = median count rate of data. |
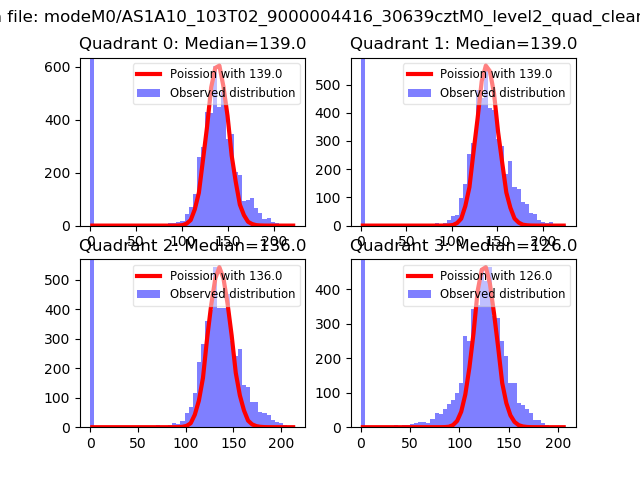 |
 |
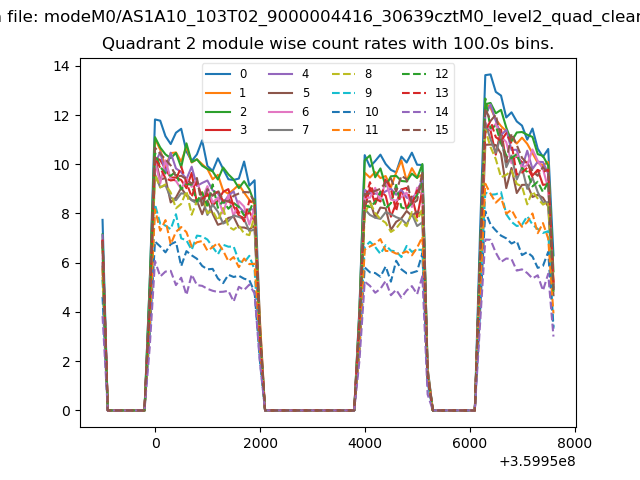
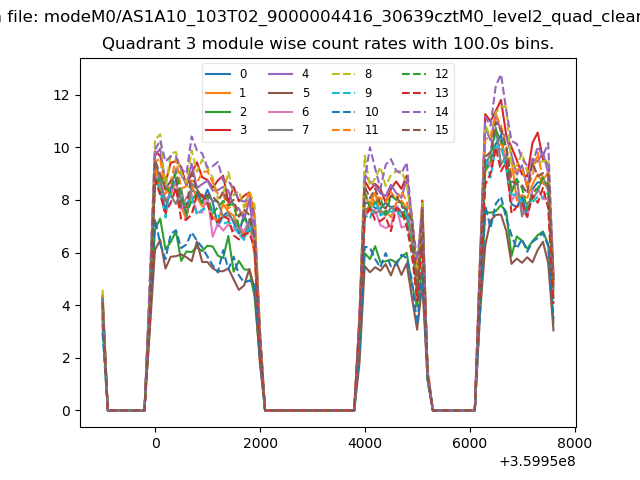
| Quadrant-wise count rates Data is divided into 100 sec bins |
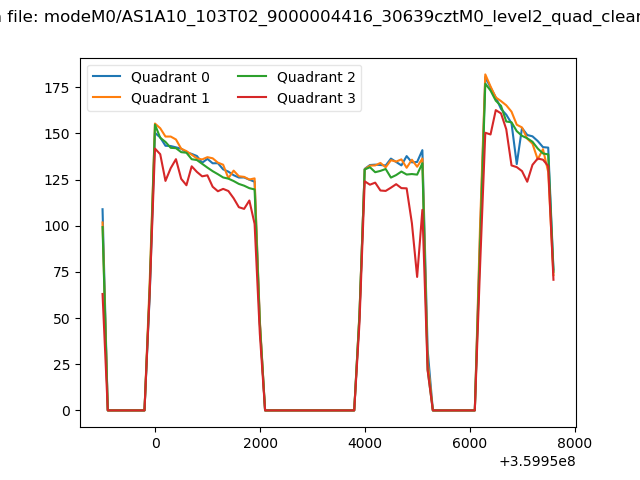 |
|
| Module-wise count rates for Quadrant A Data is divided into 100 sec bins |
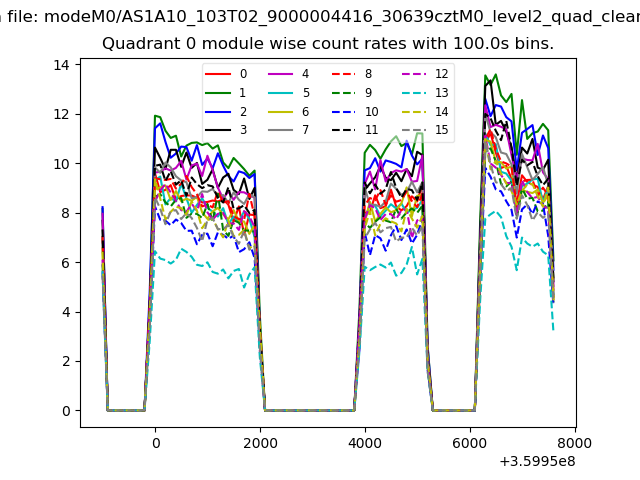 |
 |
| Module-wise count rates for Quadrant B Data is divided into 100 sec bins |
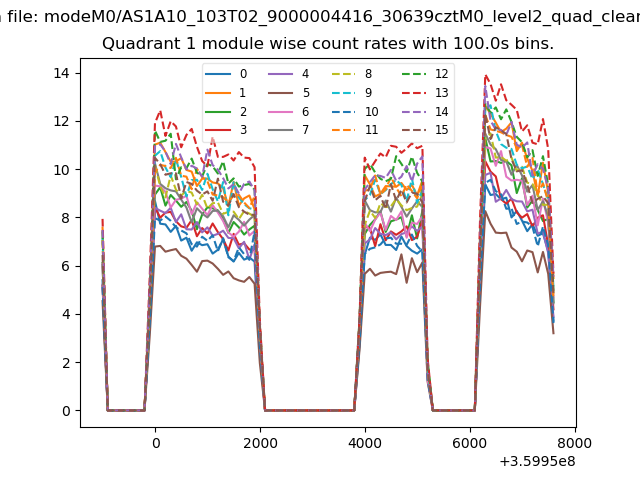 |
 |
| Module-wise count rates for Quadrant C Data is divided into 100 sec bins |
 |
 |
| Module-wise count rates for Quadrant D Data is divided into 100 sec bins |
 |
 |
| Parameter | Plot |
|---|---|
| CZT HV Monitor | 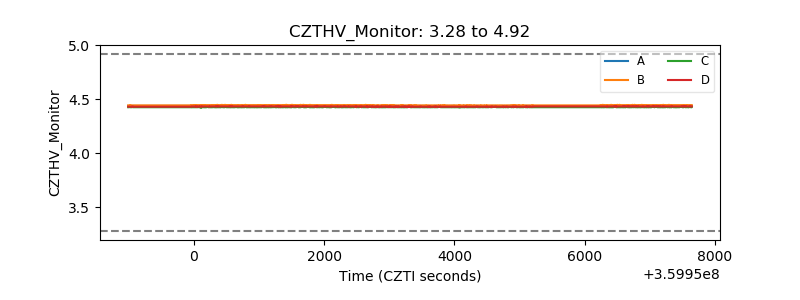 |
| D_VDD |  |
| Temperature 1 |  |
| Veto HV Monitor |  |
| Veto LLD |  |
| Alpha Counter | 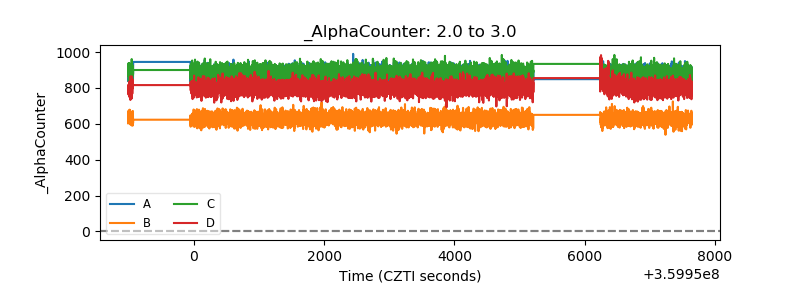 |
| _CPM_Rate | 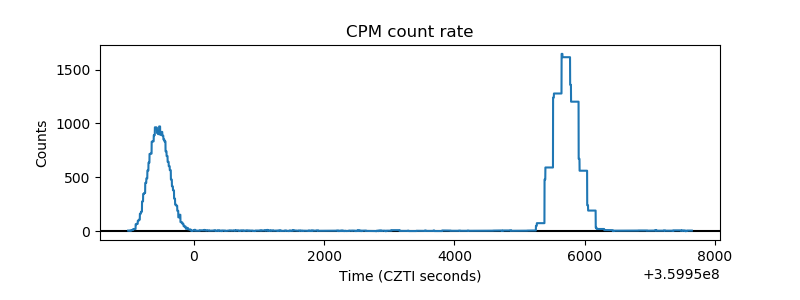 |
| CZT Counter |  |
| +2.5 Volts monitor |  |
| +5 Volts monitor |  |
| _ROLL_ROT | 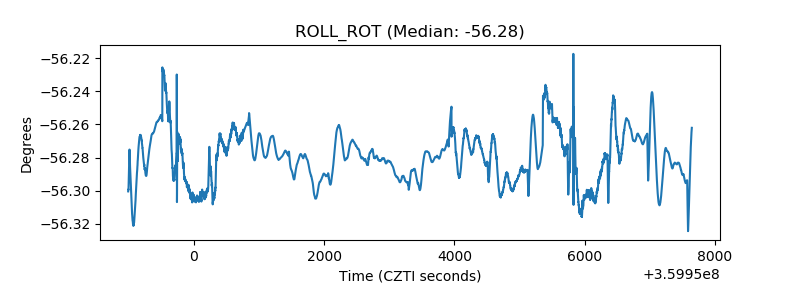 |
| _Roll_DEC | 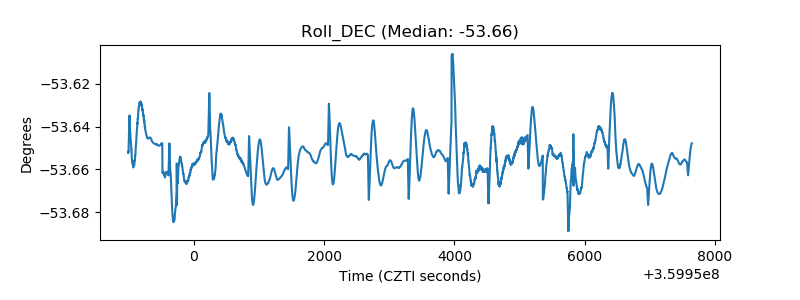 |
| _Roll_RA |  |
| Veto Counter | 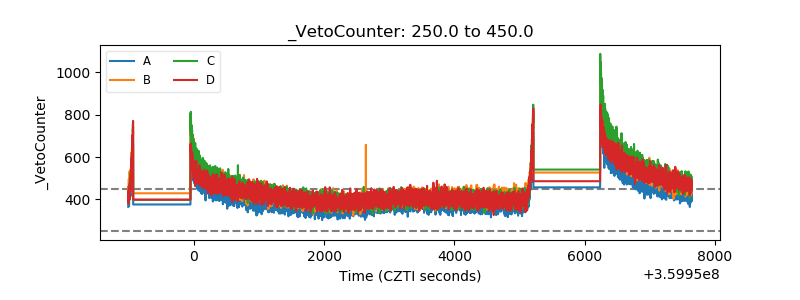 |