| Param | Original file | Final file |
|---|---|---|
| Filename | modeM0/AS1A10_103T02_9000004416_30641cztM0_level2.evt | modeM0/AS1A10_103T02_9000004416_30641cztM0_level2_quad_clean.evt |
| Size (bytes) | 739,483,200 | 101,695,680 |
| Size | 705.2 MB | 97.0 MB |
| Events in quadrant A | 3,502,404 | 680,302 |
| Events in quadrant B | 5,336,600 | 682,011 |
| Events in quadrant C | 3,546,914 | 667,042 |
| Events in quadrant D | 9,578,313 | 603,247 |
| Mode M9 | |||
|---|---|---|---|
| Quadrant | BADHDUFLAG | Total packets | Discarded packets |
| A | 0 | 11 | 0 |
| B | 0 | 12 | 0 |
| C | 0 | 12 | 0 |
| D | 0 | 12 | 0 |
| Mode M0 | |||
|---|---|---|---|
| Quadrant | BADHDUFLAG | Total packets | Discarded packets |
| A | 0 | 14375 | 2 |
| B | 0 | 20431 | 2 |
| C | 0 | 14524 | 2 |
| D | 0 | 32869 | 2 |
| Mode SS | |||
|---|---|---|---|
| Quadrant | BADHDUFLAG | Total packets | Discarded packets |
| A | 0 | 132 | 0 |
| B | 0 | 132 | 0 |
| C | 0 | 132 | 0 |
| D | 0 | 132 | 0 |
| Quadrant | Total seconds | Saturated seconds | Saturation percentage |
|---|---|---|---|
| A | 6396 | 107 | 1.672921% |
| B | 6396 | 200 | 3.126954% |
| C | 6396 | 134 | 2.095059% |
| D | 6396 | 1091 | 17.057536% |
Noise dominated data is calculated using 1-second bins in cleaned event files. If a bin has >2000 counts, and if more than 50% of those come from <1% of pixels, then it is considered to be noise-dominated and hence unusable.
| Quadrant | # 1 sec bins | Bins with >0 counts | Bins with >2000 counts | High rate bins dominated by noise | Noise dominated (total time) | Noise dominated (detector-on time) | Marked lightcurve |
|---|---|---|---|---|---|---|---|
| A | 7571 | 6397 | 48 | 48 | 0.63% | 0.75% | 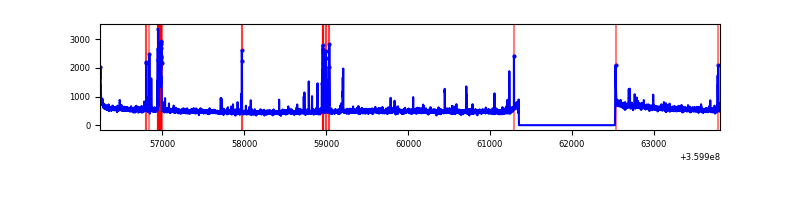 |
| B | 7571 | 6397 | 66 | 66 | 0.87% | 1.03% | 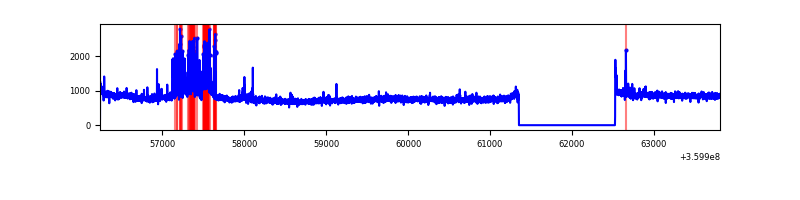 |
| C | 7571 | 6397 | 11 | 11 | 0.15% | 0.17% | 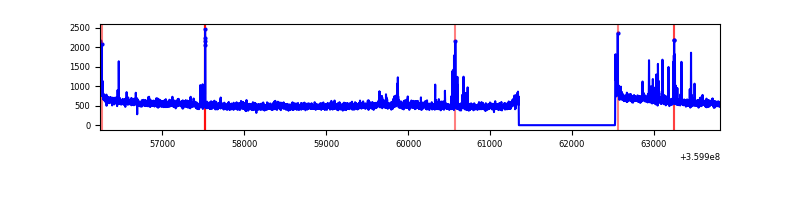 |
| D | 7571 | 6397 | 1356 | 1356 | 17.91% | 21.20% | 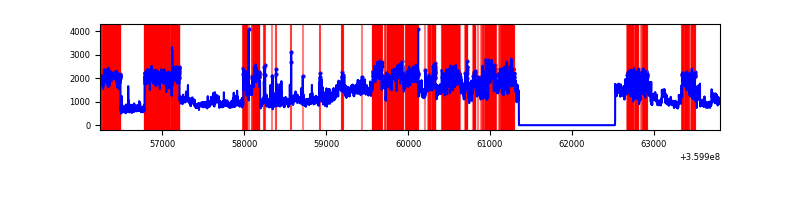 |
Top three noisy pixels from each quadrant. If the there are fewer than three noisy pixels in the level2.evt file, extra rows are filled as -1
| Pixel properties | Quadrant properties | ||||||
|---|---|---|---|---|---|---|---|
| Quadrant | DetID | PixID | Counts | Sigma | Mean | Median | Sigma |
| A | 0 | 13 | 233957 | 1400.01 | 839 | 825 | 166.5 |
| A | 8 | 192 | 23441 | 135.81 | 839 | 825 | 166.5 |
| A | 13 | 254 | 11813 | 65.99 | 839 | 825 | 166.5 |
| B | 6 | 159 | 1703841 | 11010.13 | 828 | 808 | 154.7 |
| B | 6 | 36 | 343777 | 2217.3 | 828 | 808 | 154.7 |
| B | 12 | 111 | 18364 | 113.5 | 828 | 808 | 154.7 |
| C | 14 | 238 | 136010 | 715.38 | 819 | 828 | 189.0 |
| C | 0 | 10 | 90646 | 475.32 | 819 | 828 | 189.0 |
| C | 3 | 233 | 61165 | 319.3 | 819 | 828 | 189.0 |
| D | 8 | 195 | 5983135 | 29669.56 | 793 | 779 | 201.6 |
| D | 12 | 227 | 236602 | 1169.57 | 793 | 779 | 201.6 |
| D | 12 | 33 | 217315 | 1073.91 | 793 | 779 | 201.6 |
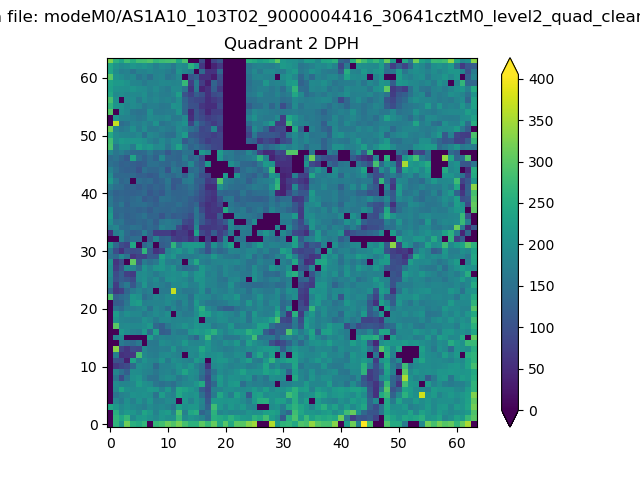
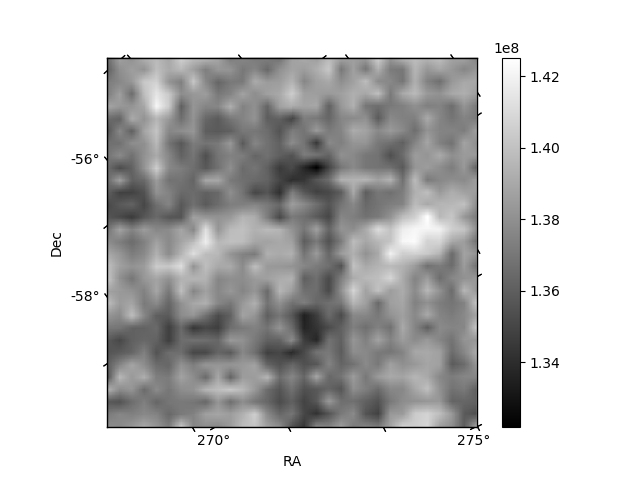
Histogram calculated using DETX and DETY for each event in the final _common_clean file
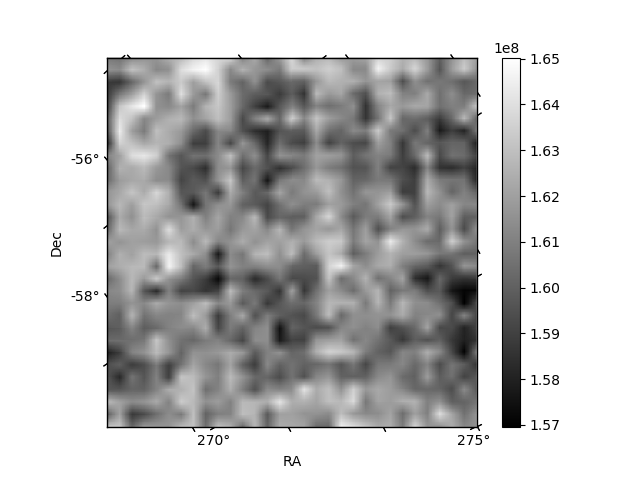
| Quadrant A |  |
 |
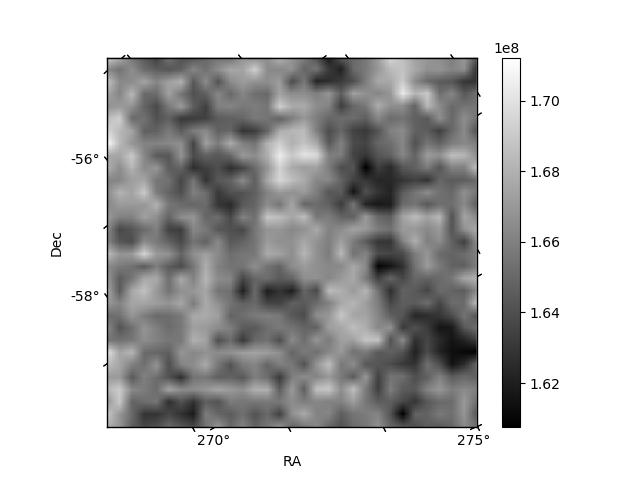
Quadrant B |
|---|---|---|---|
| Quadrant D |  |
 |
Quadrant C |
| Plot type | Count rate plots | Images |
|---|---|---|
| Comparison with Poisson distribution Blue bars denote a histogram of data divided into 1 sec bins. Red curve is a Poisson curve with rate = median count rate of data. |
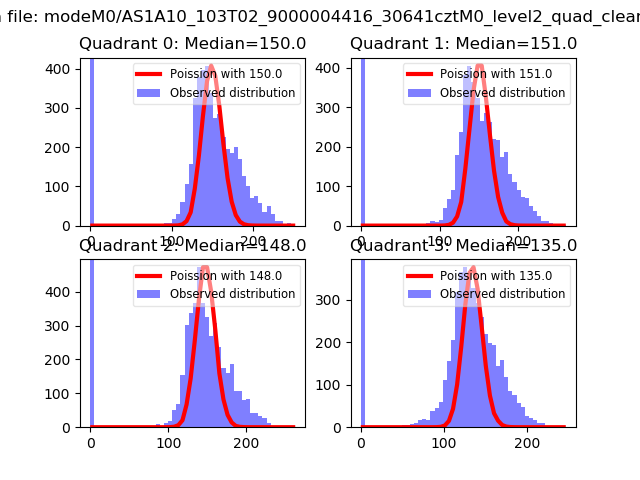 |
 |
| Quadrant-wise count rates Data is divided into 100 sec bins |
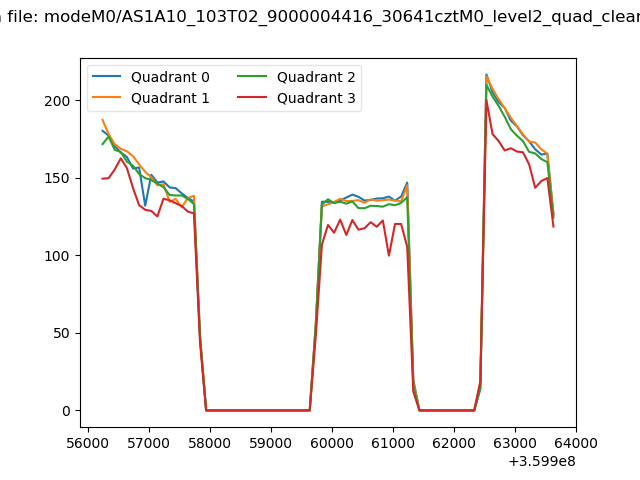 |
|
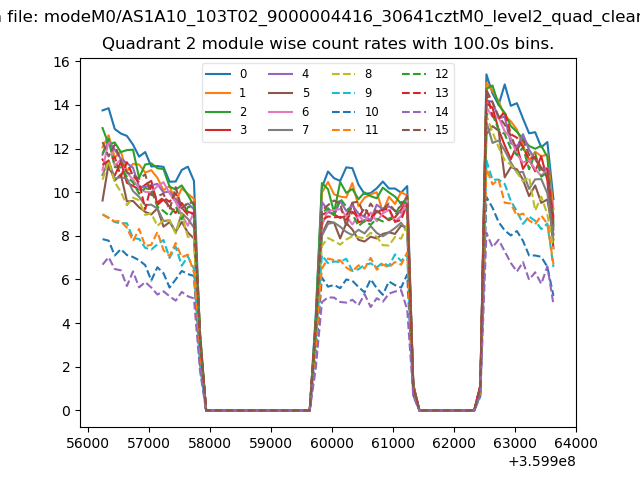
| Module-wise count rates for Quadrant A Data is divided into 100 sec bins |
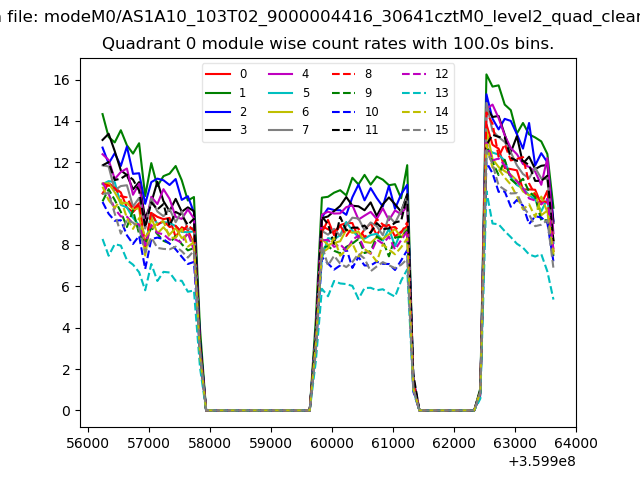 |
 |
| Module-wise count rates for Quadrant B Data is divided into 100 sec bins |
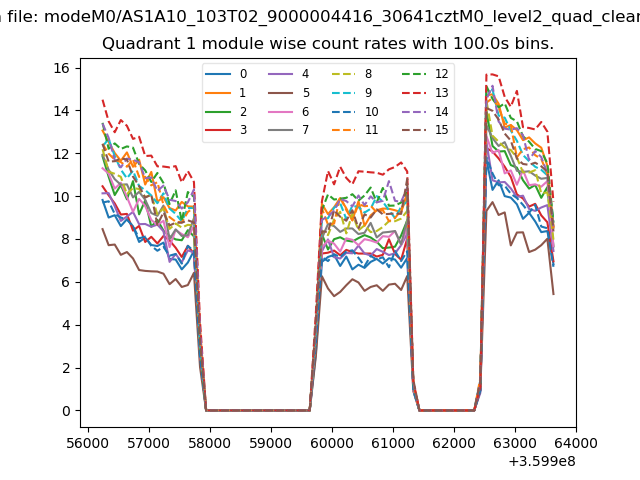 |
 |
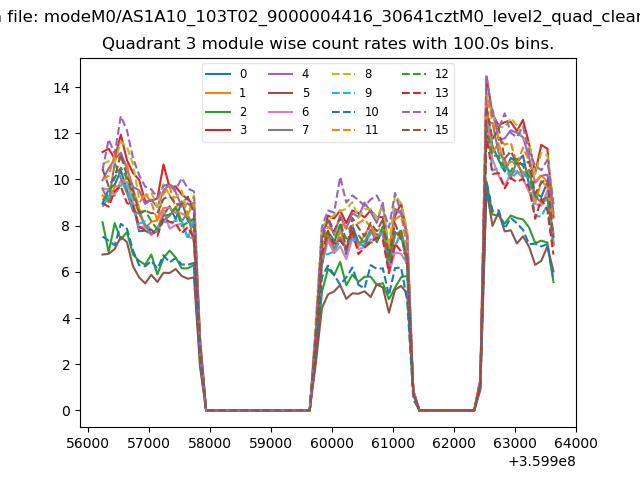
| Module-wise count rates for Quadrant C Data is divided into 100 sec bins |
 |
 |
| Module-wise count rates for Quadrant D Data is divided into 100 sec bins |
 |
 |
| Parameter | Plot |
|---|---|
| CZT HV Monitor |  |
| D_VDD | 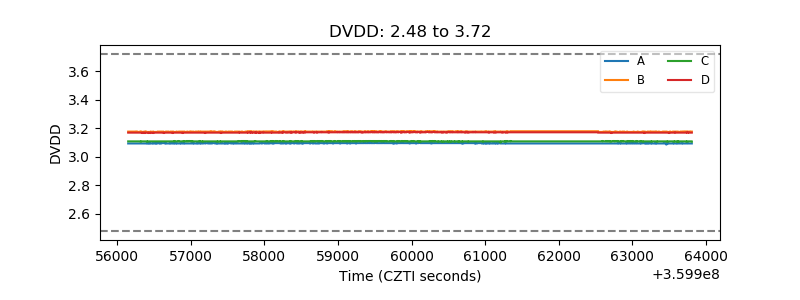 |
| Temperature 1 | 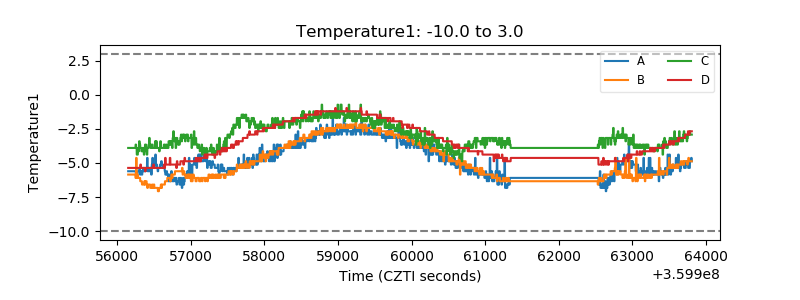 |
| Veto HV Monitor | 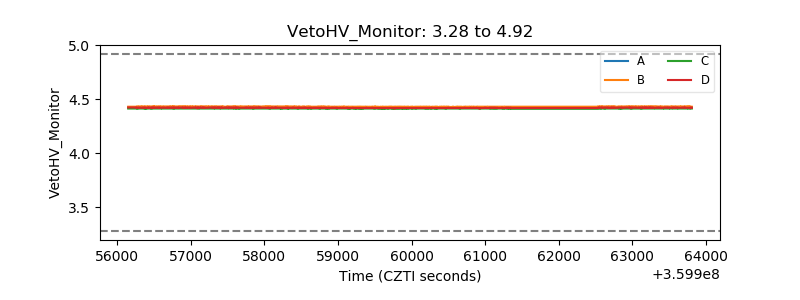 |
| Veto LLD | 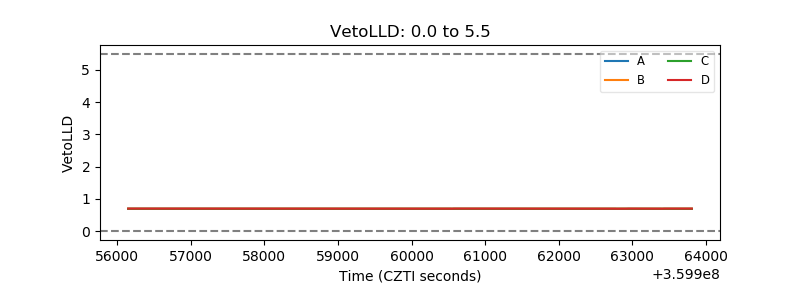 |
| Alpha Counter | 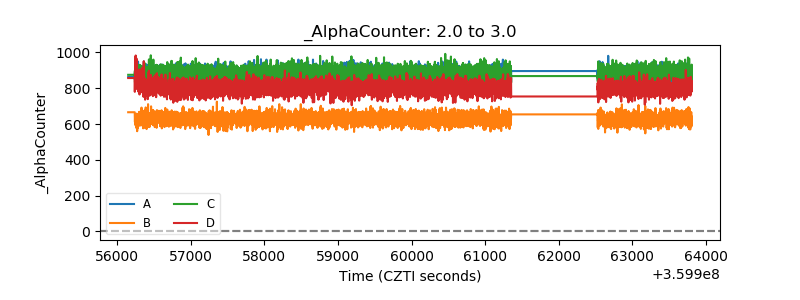 |
| _CPM_Rate | 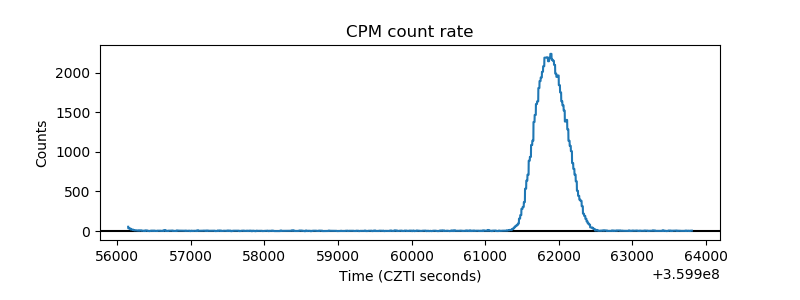 |
| CZT Counter | 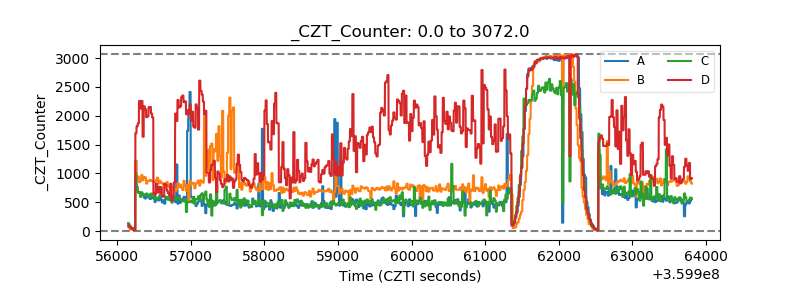 |
| +2.5 Volts monitor |  |
| +5 Volts monitor |  |
| _ROLL_ROT | 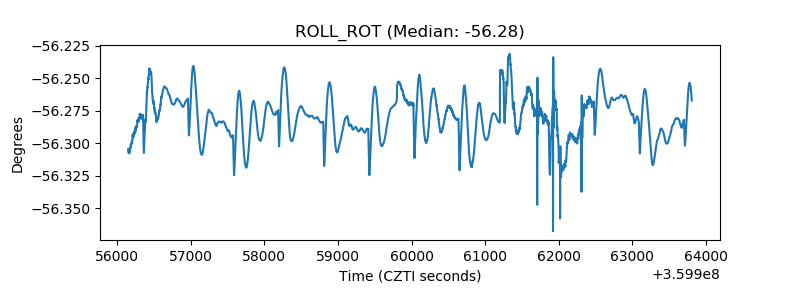 |
| _Roll_DEC | 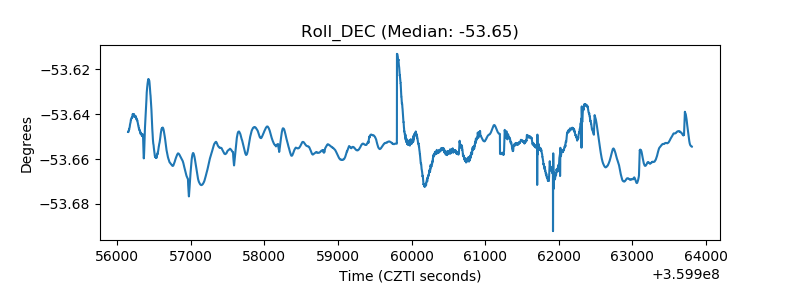 |
| _Roll_RA | 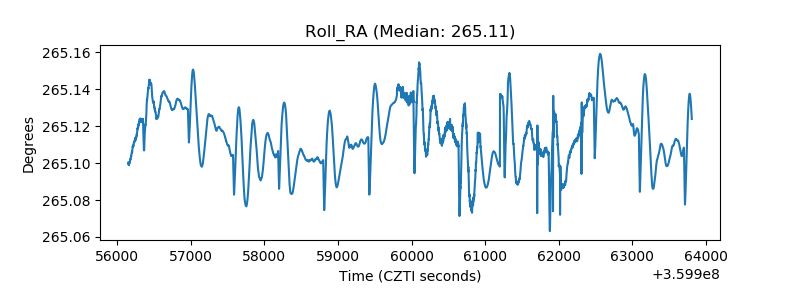 |
| Veto Counter | 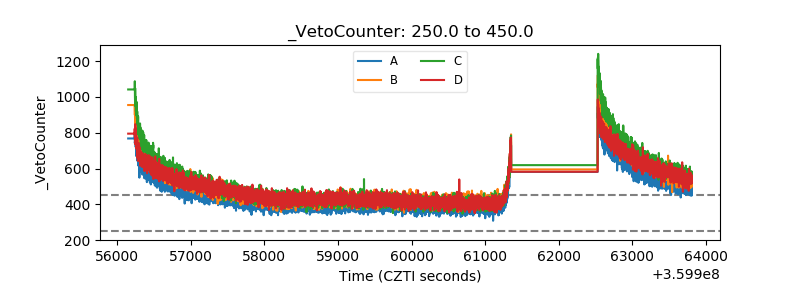 |