| Param | Original file | Final file |
|---|---|---|
| Filename | modeM0/AS1A10_103T02_9000004416_30642cztM0_level2.evt | modeM0/AS1A10_103T02_9000004416_30642cztM0_level2_quad_clean.evt |
| Size (bytes) | 707,984,640 | 88,004,160 |
| Size | 675.2 MB | 83.9 MB |
| Events in quadrant A | 3,806,378 | 578,123 |
| Events in quadrant B | 4,850,818 | 585,801 |
| Events in quadrant C | 3,479,498 | 563,226 |
| Events in quadrant D | 8,903,818 | 521,236 |
| Mode M9 | |||
|---|---|---|---|
| Quadrant | BADHDUFLAG | Total packets | Discarded packets |
| A | 0 | 13 | 0 |
| B | 0 | 13 | 0 |
| C | 0 | 13 | 0 |
| D | 0 | 13 | 0 |
| Mode M0 | |||
|---|---|---|---|
| Quadrant | BADHDUFLAG | Total packets | Discarded packets |
| A | 0 | 15032 | 1 |
| B | 0 | 18495 | 2 |
| C | 0 | 14072 | 1 |
| D | 0 | 30659 | 1 |
| Mode SS | |||
|---|---|---|---|
| Quadrant | BADHDUFLAG | Total packets | Discarded packets |
| A | 0 | 122 | 0 |
| B | 0 | 122 | 0 |
| C | 0 | 122 | 0 |
| D | 0 | 122 | 0 |
| Quadrant | Total seconds | Saturated seconds | Saturation percentage |
|---|---|---|---|
| A | 5957 | 210 | 3.525264% |
| B | 5956 | 103 | 1.729349% |
| C | 5956 | 159 | 2.669577% |
| D | 5957 | 758 | 12.724526% |
Noise dominated data is calculated using 1-second bins in cleaned event files. If a bin has >2000 counts, and if more than 50% of those come from <1% of pixels, then it is considered to be noise-dominated and hence unusable.
| Quadrant | # 1 sec bins | Bins with >0 counts | Bins with >2000 counts | High rate bins dominated by noise | Noise dominated (total time) | Noise dominated (detector-on time) | Marked lightcurve |
|---|---|---|---|---|---|---|---|
| A | 7217 | 5958 | 114 | 114 | 1.58% | 1.91% | 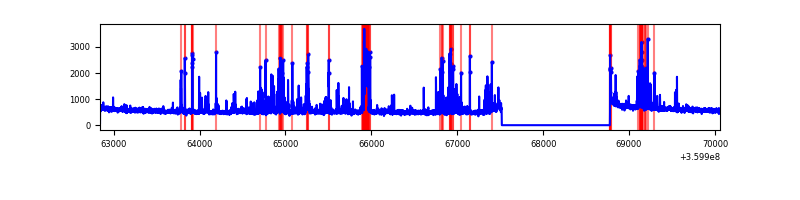 |
| B | 7216 | 5957 | 0 | 0 | 0.00% | 0.00% | 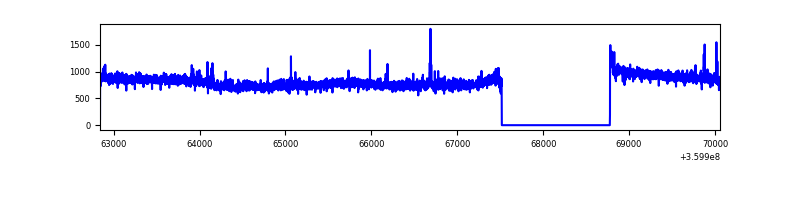 |
| C | 7216 | 5957 | 18 | 18 | 0.25% | 0.30% | 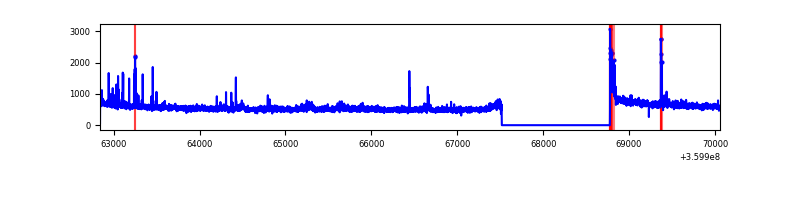 |
| D | 7217 | 5958 | 768 | 768 | 10.64% | 12.89% | 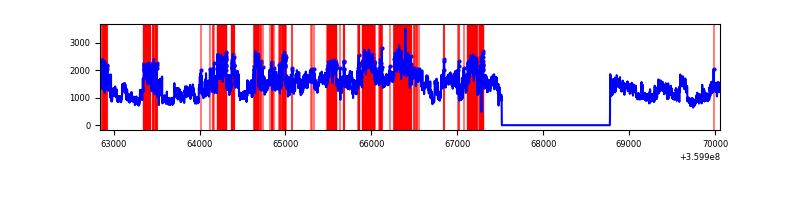 |
Top three noisy pixels from each quadrant. If the there are fewer than three noisy pixels in the level2.evt file, extra rows are filled as -1
| Pixel properties | Quadrant properties | ||||||
|---|---|---|---|---|---|---|---|
| Quadrant | DetID | PixID | Counts | Sigma | Mean | Median | Sigma |
| A | 0 | 13 | 636548 | 3963.55 | 818 | 805 | 160.4 |
| A | 13 | 254 | 10709 | 61.75 | 818 | 805 | 160.4 |
| A | 8 | 192 | 10167 | 58.37 | 818 | 805 | 160.4 |
| B | 6 | 159 | 1628593 | 11046.45 | 806 | 789 | 147.4 |
| B | 0 | 229 | 22434 | 146.89 | 806 | 789 | 147.4 |
| B | 0 | 190 | 20645 | 134.74 | 806 | 789 | 147.4 |
| C | 14 | 238 | 142399 | 775.77 | 794 | 801 | 182.5 |
| C | 0 | 10 | 119336 | 649.41 | 794 | 801 | 182.5 |
| C | 10 | 22 | 47946 | 258.29 | 794 | 801 | 182.5 |
| D | 8 | 195 | 5485368 | 27580.07 | 781 | 767 | 198.9 |
| D | 12 | 227 | 233348 | 1169.57 | 781 | 767 | 198.9 |
| D | 12 | 33 | 119686 | 598.0 | 781 | 767 | 198.9 |
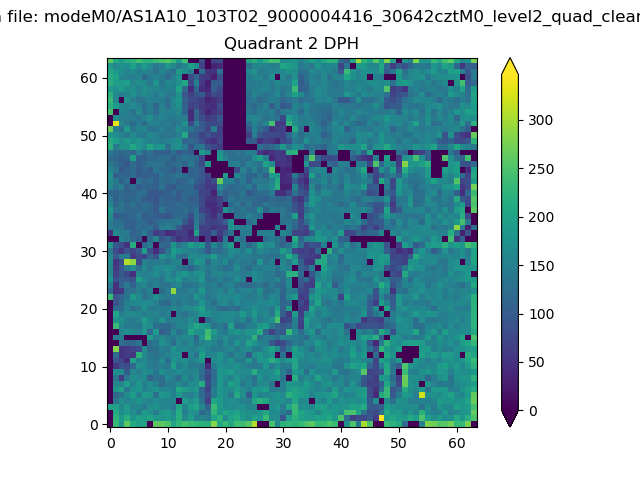
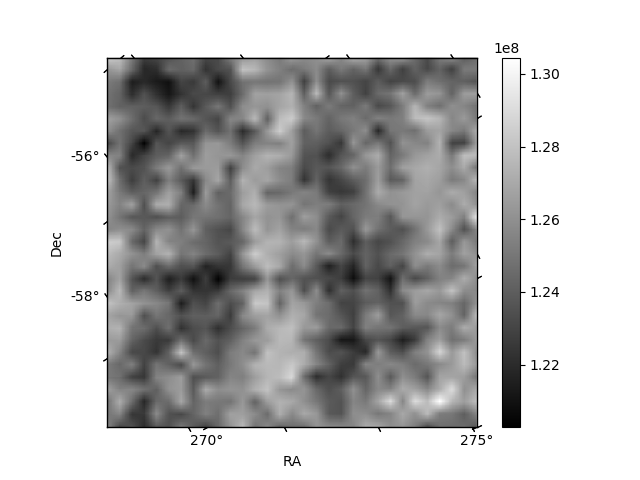
Histogram calculated using DETX and DETY for each event in the final _common_clean file
| Quadrant A | 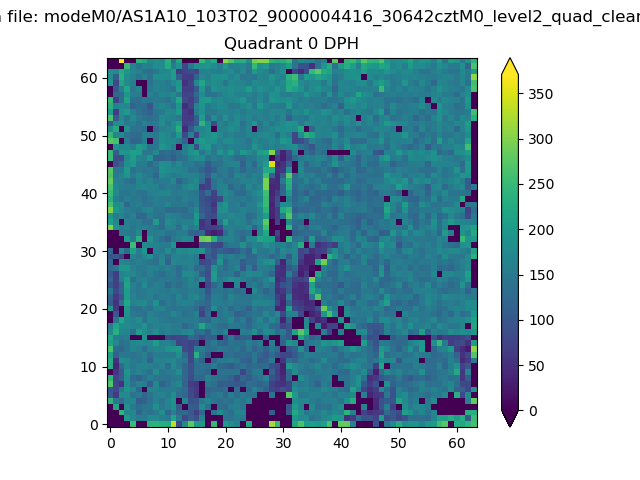 |
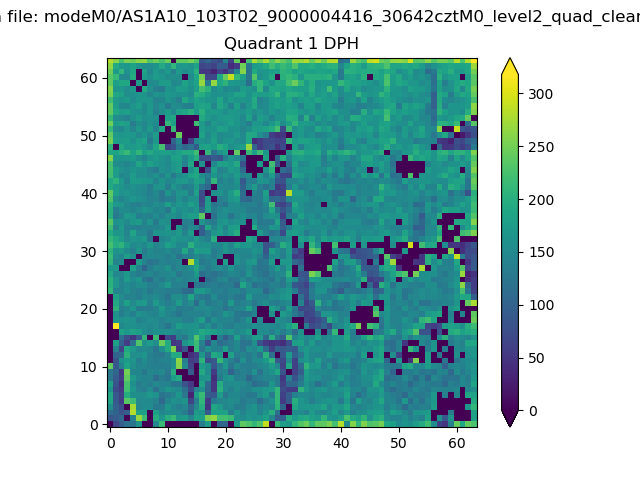 |
Quadrant B |
|---|---|---|---|
| Quadrant D | 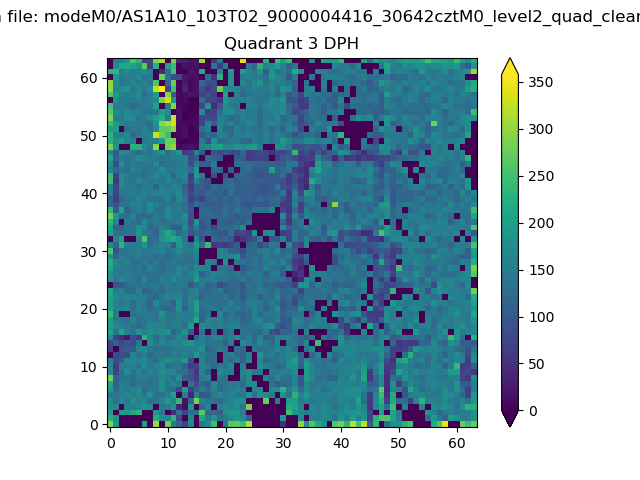 |
 |
Quadrant C |
| Plot type | Count rate plots | Images |
|---|---|---|
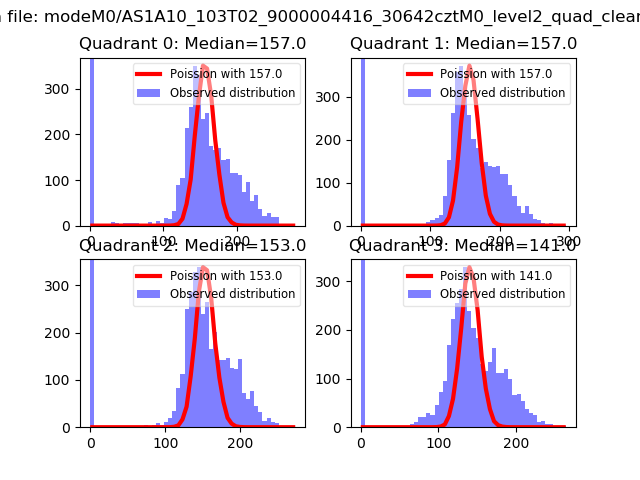
| Comparison with Poisson distribution Blue bars denote a histogram of data divided into 1 sec bins. Red curve is a Poisson curve with rate = median count rate of data. |
 |
 |
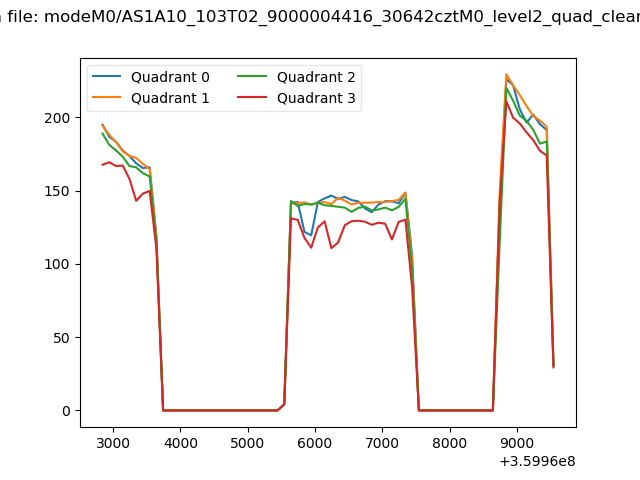
| Quadrant-wise count rates Data is divided into 100 sec bins |
 |
|
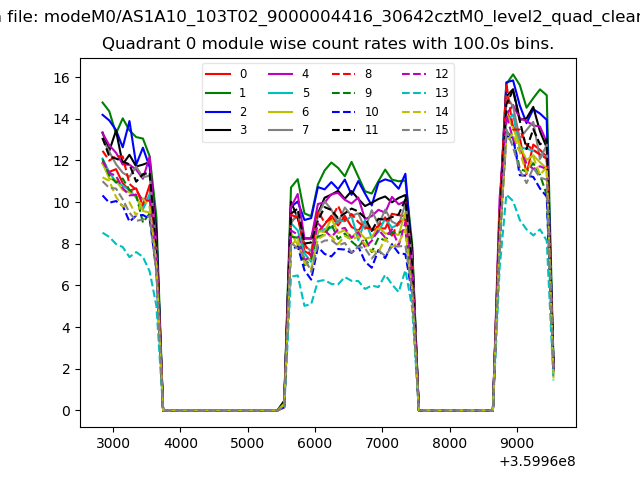
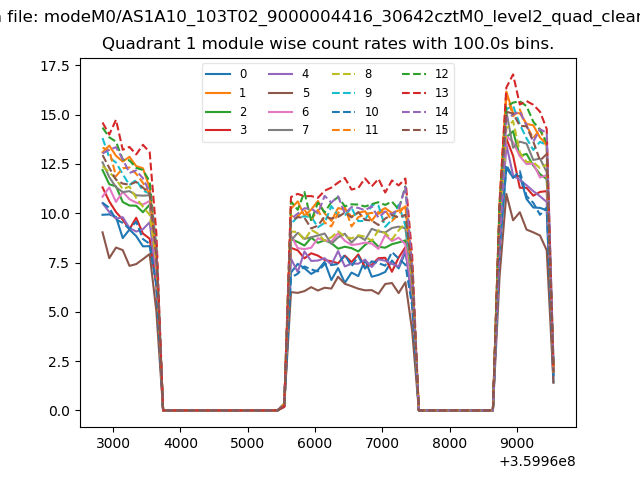
| Module-wise count rates for Quadrant A Data is divided into 100 sec bins |
 |
 |
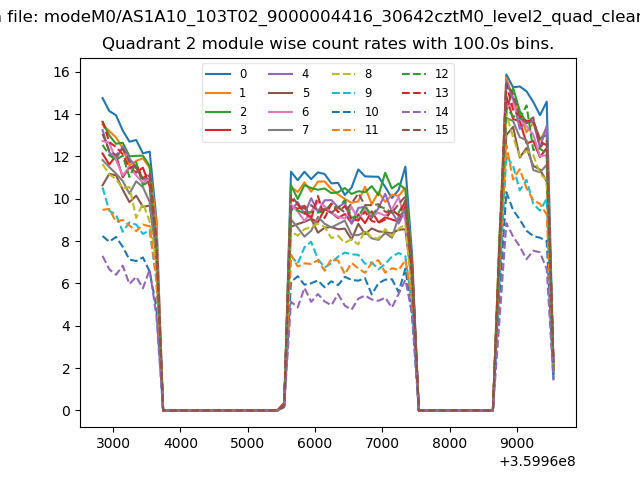
| Module-wise count rates for Quadrant B Data is divided into 100 sec bins |
 |
 |
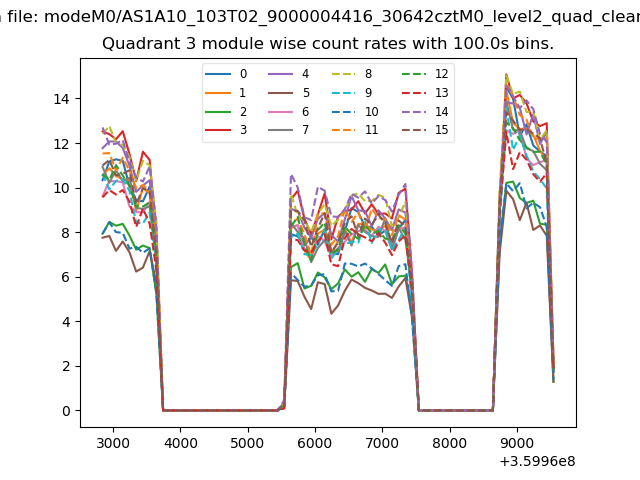
| Module-wise count rates for Quadrant C Data is divided into 100 sec bins |
 |
 |
| Module-wise count rates for Quadrant D Data is divided into 100 sec bins |
 |
 |
| Parameter | Plot |
|---|---|
| CZT HV Monitor | 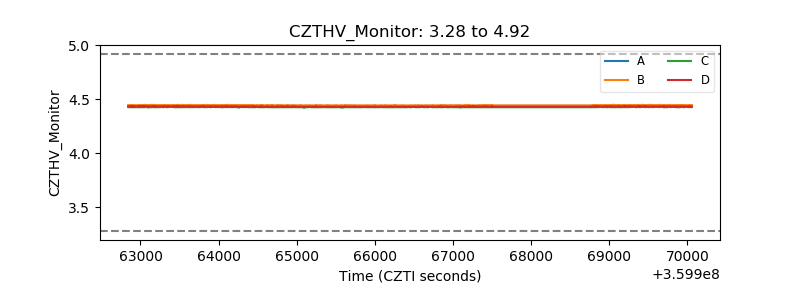 |
| D_VDD |  |
| Temperature 1 |  |
| Veto HV Monitor |  |
| Veto LLD |  |
| Alpha Counter | 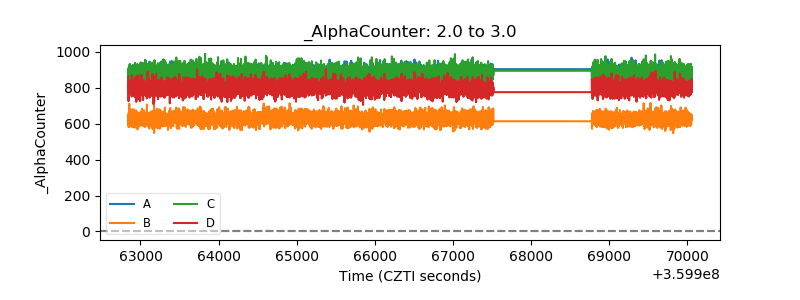 |
| _CPM_Rate | 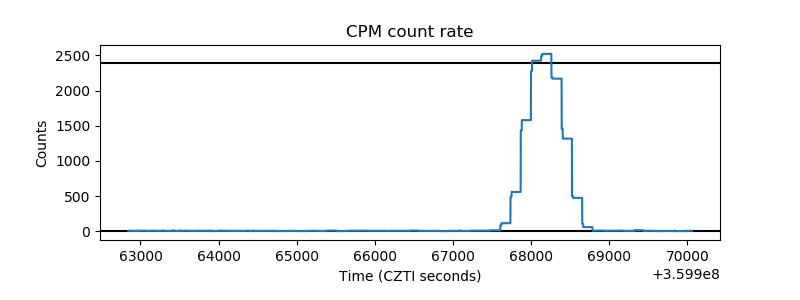 |
| CZT Counter |  |
| +2.5 Volts monitor |  |
| +5 Volts monitor | 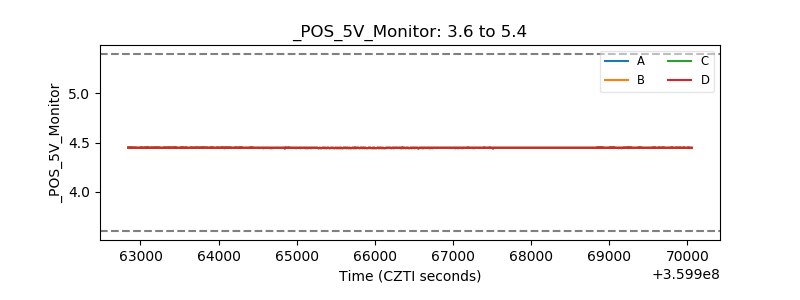 |
| _ROLL_ROT | 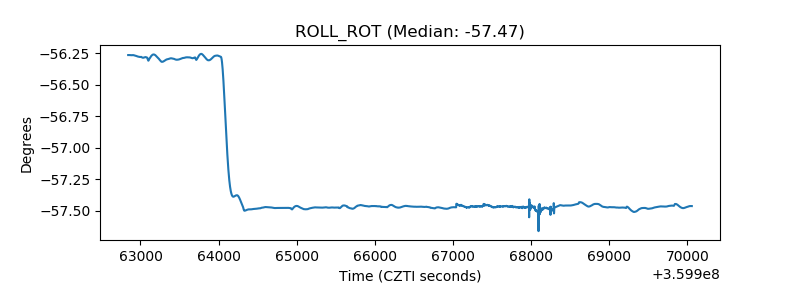 |
| _Roll_DEC | 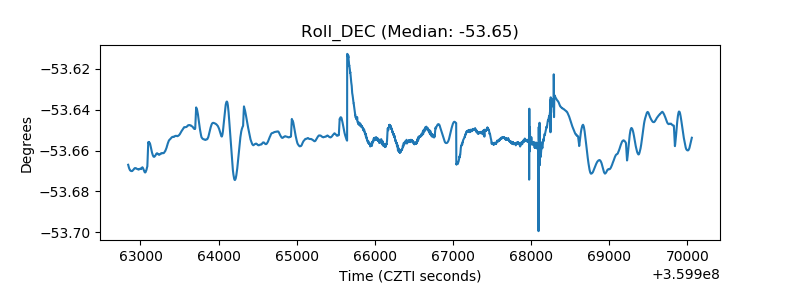 |
| _Roll_RA |  |
| Veto Counter | 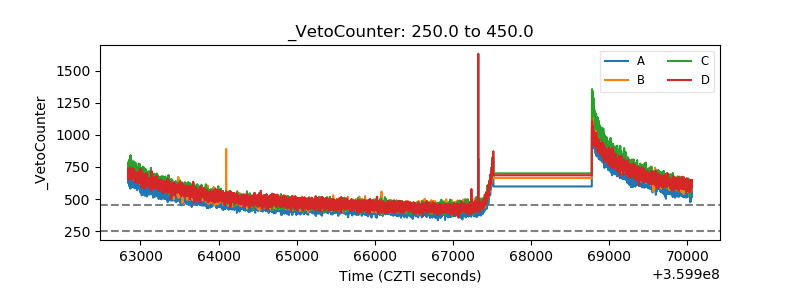 |